Analysis Summary
Notes:
- 1) No attempt has been made to eliminate the non-significant decimal places.
- 2) This batgrbproduct analysis is done using the HEASARC data.
- 3) This batgrbproduct analysis is using the flight position for the mask-weighting calculation.
======================================================================
BAT GRB EVENT DATA PROCESSING REPORT
Process Script Ver: batgrbproduct v2.48
Process Start Time: Wed Jun 14 15:17:52 EDT 2023
Host Name: batproc1
Current Working Dir: /local/data/bat1/alien/Swift_3rdBATcatalog/event/batevent_reproc/trigger1150429
======================================================================
Trigger: 01150429 Segment: 000
BAT Trigger Time: 696162015.552 [s; MET]
Trigger Stop: 696162016.576 [s; MET]
UTC: 2023-01-23T10:19:44.925060 [includes UTCF correction]
Where From?: TDRSS position message
BAT
RA: 40.9365532507019 Dec: -65.6760457513921 [deg; J2000]
Catalogged Source?: NO
Point Source?: YES
GRB Indicated?: YES [ by BAT flight software ]
Image S/N Ratio: 7.59
Image Trigger?: NO
Rate S/N Ratio: 12.6095202129185 [ if not an image trigger ]
Image S/N Ratio: 7.59
Analysis Position: [ source = BAT ]
RA: 40.9365532507019 Dec: -65.6760457513921 [deg; J2000]
Refined Position: [ source = BAT pre-slew burst ]
RA: 40.9058744728657 Dec: -65.6610676551225 [deg; J2000]
{ 02h 43m 37.4s , -65d 39' 39.8" }
+/- 1.77349267816934 [arcmin] (estimated 90% radius based on SNR)
+/- 0.661997942129068 [arcmin] (formal 1-sigma fit error)
SNR: 13.416764870035
Angular difference between the analysis and refined position is 1.175932 arcmin
Partial Coding Fraction: 0.8828125 [ including projection effects ]
Duration
T90: 5.36800003051758 +/- 1.02880127862106
Measured from: -0.892000079154968
to: 4.47599995136261 [s; relative to TRIGTIME]
T50: 2.48399996757507 +/- 0.74595452121961
Measured from: 0.371999979019165
to: 2.85599994659424 [s; relative to TRIGTIME]
Fluence
Peak Flux (peak 1 second)
Measured from: 0.115999937057495
to: 1.1159999370575 [s; relative to TRIGTIME]
Total Fluence
Measured from: -1.24800002574921
to: 4.74799990653992 [s; relative to TRIGTIME]
Band 1 Band 2 Band 3 Band 4
15-25 25-50 50-100 100-350 keV
Total 0.203676 0.214977 0.085773 0.047156
0.023261 0.023747 0.019483 0.015522 [error]
Peak 0.045166 0.057244 0.025724 0.017043
0.010040 0.010634 0.008206 0.006491 [error]
[ fluence units of on-axis counts / fully illuminated detector ]
======================================================================
====== Table of the duration information =============================
Value tstart tstop
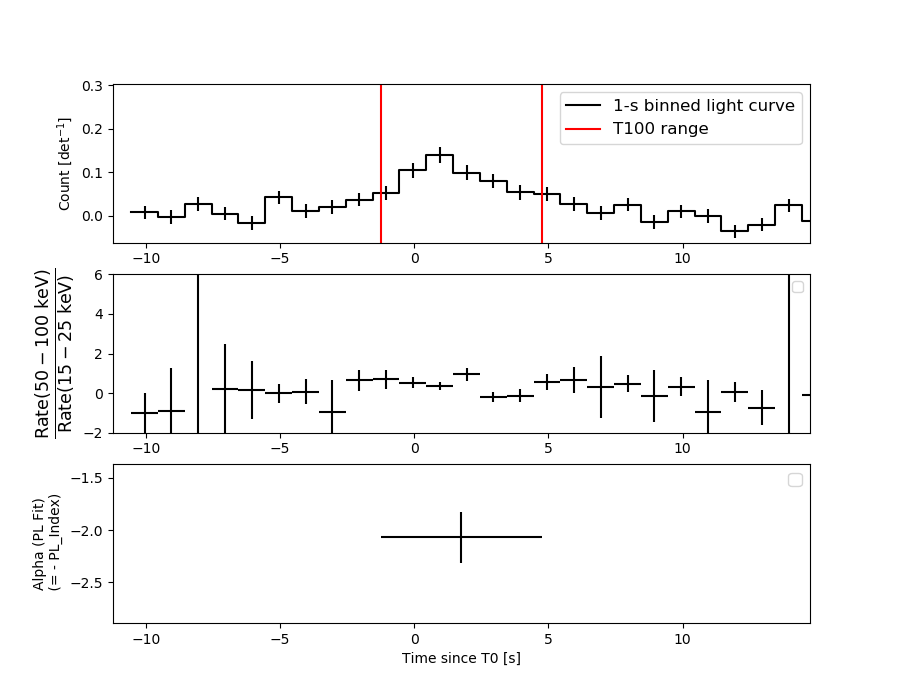
T100 5.996 -1.248 4.748
T90 5.368 -0.892 4.476
T50 2.484 0.372 2.856
Peak 1.000 0.116 1.116
====== Spectral Analysis Summary =====================================
Model : spectral model: simple power-law (PL) and cutoff power-law (CPL)
Ph_index : photon index: E^{Ph_index}
Ph_90err : 90% error of the photon index
Epeak : Epeak in keV
Epeak_90err: 90% error of Epeak
Norm : normalization at 50 keV in both the PL model and CPL model
Nomr_90err : 90% error of the normalization
chi2 : Chi-Squared
dof : degree of freedo
=== Time-averaged spectral analysis ===
(Best model with acceptable fit: PL)
Model Ph_index Ph_90err_low Ph_90err_hi Epeak Epeak_90err_low Epeak_90err_hi Norm Nomr_90err_low Norm_90err_hi chi2 dof
PL -2.062 -0.248 0.230 - - - 4.82e-03 -8.17e-04 7.94e-04 29.700 57
CPL -1.446 -0.680 1.387 35.239 -33.507 -35.239 1.13e-02 -1.13e-02 6.93e-02 28.770 56
=== 1-s peak spectral analysis ===
(Best model with acceptable fit: PL)
Model Ph_index Ph_90err_low Ph_90err_hi Epeak Epeak_90err_low Epeak_90err_hi Norm Nomr_90err_low Norm_90err_hi chi2 dof
PL -1.835 -0.371 0.345 - - - 8.14e-03 -1.97e-03 1.90e-03 47.720 57
CPL -1.601 -0.639 1.893 73.189 -73.160 -73.189 1.11e-02 -1.11e-02 1.39e-01 47.640 56
=== Fluence/Peak Flux Summary ===
Model Band1 Band2 Band3 Band4 Band5 Total
15-25 25-50 50-100 100-350 15-150 15-350 keV
Fluence PL 6.27e-08 8.19e-08 7.85e-08 1.34e-07 2.67e-07 3.57e-07 erg/cm2
90%_error_low -1.04e-08 -1.05e-08 -1.77e-08 -5.07e-08 -4.09e-08 -7.39e-08 erg/cm2
90%_error_hi 1.06e-08 1.04e-08 1.83e-08 6.80e-08 4.20e-08 8.72e-08 erg/cm2
Peak flux PL 4.63e-01 3.82e-01 2.14e-01 1.77e-01 1.14e+00 1.24e+00 ph/cm2/s
90%_error_low -1.33e-01 -7.73e-02 -6.56e-02 -8.62e-02 -2.30e-01 -2.53e-01 ph/cm2/s
90%_error_hi 1.39e-01 7.71e-02 6.59e-02 1.23e-01 2.30e-01 2.54e-01 ph/cm2/s
Fluence CPL 6.05e-08 8.84e-08 7.41e-08 4.34e-08 2.49e-07 2.66e-07 erg/cm2
90%_error_low -1.15e-08 -1.46e-08 -2.40e-08 -3.70e-08 -4.67e-08 -6.22e-08 erg/cm2
90%_error_hi 1.13e-08 1.60e-08 2.09e-08 1.56e-07 5.18e-08 1.71e-07 erg/cm2
Peak flux CPL 4.54e-01 3.95e-01 2.15e-01 1.26e-01 1.13e+00 1.19e+00 ph/cm2/s
90%_error_low -1.45e-01 -8.74e-02 -7.29e-02 -1.26e-01 -2.33e-01 -2.75e-01 ph/cm2/s
90%_error_hi 1.45e-01 1.14e-01 6.95e-02 1.12e-01 2.32e-01 2.93e-01 ph/cm2/s
======================================================================
Image
Pre-slew 15.0-350.0 keV image (Event data)
#   RAcent    DECcent   POSerr    Theta     Phi              Peak Cts       SNR   Name
   40.9059   -65.6611   0.0144    17.2781   135.8566         0.5367789     13.417 TRIG_01150429

Foreground time interval of the image:
 -1.248   4.748 (delta_t =   5.996 [sec])
Background time interval of the image:
-239.552  -1.248 (delta_t = 238.304 [sec])
Light Curves
Note: The mask-weighted lightcurves have units of either count/det or counts/sec/det, where a det is 0.4 x 0.4 = 0.16 sq cm.
Full-time range; 1 s binning
Other quick-look light curves:
- 64 ms binning (zoomed)
- 16 ms binning (zoomed)
- 8 ms binning (zoomed)
- 2 ms binning (zoomed)
- SN=5 or 10 s binning (full-time range)
- Raw light curve
Spectra
- 64 ms binning (zoomed)
- 16 ms binning (zoomed)
- 8 ms binning (zoomed)
- 2 ms binning (zoomed)
- SN=5 or 10 s binning (full-time range)
- Raw light curve
Spectra
Notes:
- 1) The fitting includes the systematic errors.
- 2) When the burst includes telescope slew time periods, the fitting uses an average response file made from multiple 5-s response files through out the slew time plus single time preiod for the non-slew times, and weighted by the total counts in the corresponding time period using addrmf. An average response file is needed becuase a spectral fit using the pre-slew DRM will introduce some errors in both a spectral shape and a normalization if the PHA file contains a lot of the slew/post-slew time interval.
- 3) For fits to more complicated models (e.g. a power-law over a cutoff power-law), the BAT team has decided to require a chi-square improvement of more than 6 for each extra dof.
Time averaged spectrum fit using the average DRM
Power-law model

Time interval is from   -1.248 sec. to    4.748 sec.

Spectral model in power-law:
------------------------------------------------------------
Parameters  : value       lower 90%   higher 90%
Photon index: -2.06189     ( -0.2478   0.230193 )
Norm@50keV  : 4.81542E-03    ( -0.000816691   0.000794275 )
------------------------------------------------------------
#Fit statistic  : Chi-Squared                   29.70     using 59 bins.
 Reduced chi-squared = 0.521053
# Null hypothesis probability of 9.99e-01 with 57 degrees of freedom

Photon flux (15-150 keV)    in 5.996 sec: 0.743712 ( -0.092506  0.092509 ) ph/cm2/s
Energy fluence (15-150 keV)             : 2.67413e-07 ( -4.08847e-08  4.20026e-08 ) ergs/cm2
Cutoff power-law model
Time interval is from   -1.248 sec. to    4.748 sec.
Spectral model in the cutoff power-law:
------------------------------------------------------------
Parameters  : value       lower 90%   higher 90%
Photon index: -1.44643     ( -0.680991   1.38673 )
Epeak [keV] : 35.2389      ( -33.5101 -35.2418 )
Norm@50keV  : 1.13365E-02    ( -0.0113507   0.0692555 )
------------------------------------------------------------
#Fit statistic  : Chi-Squared                   28.77     using 59 bins.
 Reduced chi-squared = 0.51375
# Null hypothesis probability of 9.99e-01 with 56 degrees of freedom

Photon flux (15-150 keV)    in 5.996 sec: 0.729451 ( -0.095743  0.095782 ) ph/cm2/s
Energy fluence (15-150 keV)             : 2.49461e-07 ( -4.66916e-08  5.18203e-08 ) ergs/cm2
1-s peak spectrum fit
Power-law model
Time interval is from    0.116 sec. to    1.116 sec.

Spectral model in power-law:
------------------------------------------------------------
Parameters  : value       lower 90%   higher 90%
Photon index: -1.83469     ( -0.371189   0.344617 )
Norm@50keV  : 8.14141E-03    ( -0.00197195   0.00189509 )
------------------------------------------------------------
#Fit statistic  : Chi-Squared                   47.72     using 59 bins.
 Reduced chi-squared = 0.837193
# Null hypothesis probability of 8.04e-01 with 57 degrees of freedom

Photon flux (15-150 keV)    in 1 sec: 1.13737 ( -0.230153  0.23021 ) ph/cm2/s
Energy fluence (15-150 keV)             : 7.48893e-08 ( -1.77349e-08  1.81722e-08 ) ergs/cm2
Cutoff power-law model

Time interval is from    0.116 sec. to    1.116 sec.
Spectral model in the cutoff power-law:
------------------------------------------------------------
Parameters  : value       lower 90%   higher 90%
Photon index: -1.60115     ( -0.638527   1.89319 )
Epeak [keV] : 73.1892      ( -73.2079 -73.2373 )
Norm@50keV  : 1.11165E-02    ( -0.0111117   0.139285 )
------------------------------------------------------------
#Fit statistic  : Chi-Squared                   47.64     using 59 bins.
 Reduced chi-squared = 0.850714
# Null hypothesis probability of 7.79e-01 with 56 degrees of freedom

Photon flux (15-150 keV)    in 1 sec: 1.13179 ( -0.23291  0.23234 ) ph/cm2/s
Energy fluence (15-150 keV)             : 7.32251e-08 ( -2.02405e-08  1.94899e-08 ) ergs/cm2
Time-resolved spectra
Distribution
T90 vs. Hardness ratio plot
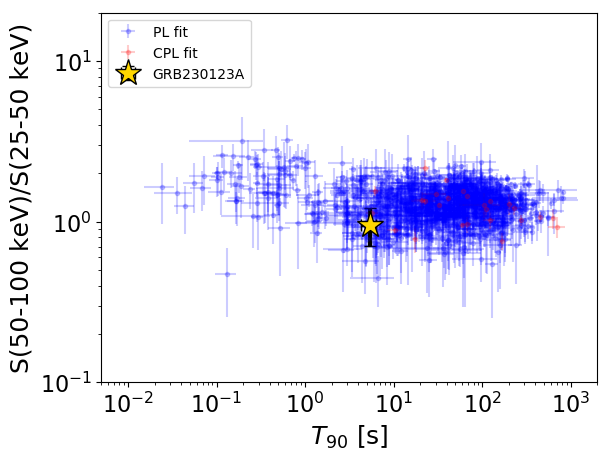
T90                                   = 5.368 sec.
Hardness ratio (energy fluence ratio) = 0.958032070953
S(15-50 keV) vs. S(50-150 keV) plot
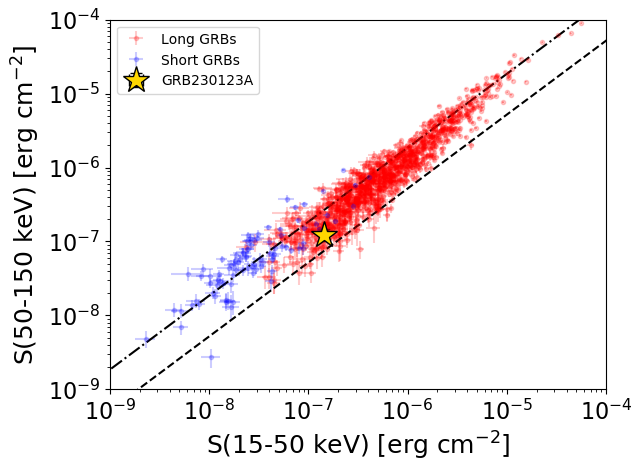
S(15-50 keV)  = 1.445725e-07
S(50-150 keV) = 1.2283939e-07
The dash-dotted line and the dashed line traces the fluences calculated from the Band function with Epeak = 15 and 150 keV, respectively. Both lines assume a canonical values of alpha = -1 and beta = -2.5.
Mask shadow pattern
IMX = -2.232059560038941E-01, IMY = -2.166296740017700E-01
Spacecraft aspect plot
Bright source in the pre-burst/pre-slew/post-slew images
Pre-burst image of 15-350 keV band
Time interval of the image:
-239.552000 -1.248000

# RAcent  DECcent POSerr Theta    Phi  PeakCts   SNR AngSep     Name
#  [deg]    [deg]    ['] [deg]  [deg]                   [']
228.4768 -79.0569    2.4  44.0 -173.2   3.4459   4.8 ------	UNKNOWN
357.7617   2.2809    2.1  58.8  -19.5  10.6714   5.6  191.7	UNKNOWN
354.3318  -1.6489    2.7  55.6  -24.4   7.3345   4.3  354.1	UNKNOWN
335.6887 -19.8616    2.3  44.8  -55.1   6.9167   5.0 ------	UNKNOWN
Pre-slew background subtracted image of 15-350 keV band
Time interval of the image:
-1.248000 4.748000

# RAcent  DECcent POSerr Theta    Phi  PeakCts   SNR AngSep     Name
#  [deg]    [deg]    ['] [deg]  [deg]                   [']
 40.9058 -65.6610    0.9  17.3  135.9   0.5368  13.4 ------	UNKNOWN
281.7572 -64.8916    2.3  42.1 -143.2   0.4316   5.0 ------	UNKNOWN
Post-slew image of 15-350 keV band
Time interval of the image:
71.348600 710.038000
720.448000 782.558200
840.448000 898.763700
900.448000 962.687700

# RAcent  DECcent POSerr Theta    Phi  PeakCts   SNR AngSep     Name
#  [deg]    [deg]    ['] [deg]  [deg]                   [']
170.5426 -60.6619  107.4  48.3  163.0  -0.7948  -0.1    7.1	Cen X-3
186.5091 -62.7488    7.2  49.1  173.3   8.5176   1.6    4.3	GX 301-2
108.4815 -62.4934    2.8  28.2  128.9   7.2817   4.1 ------	UNKNOWN
245.0632 -59.9352    2.5  53.1 -151.8  14.4455   4.6 ------	UNKNOWN
  0.6702 -23.2804    2.5  49.5  -37.9  17.7376   4.5 ------	UNKNOWN