Analysis Summary
Notes:
- 1) No attempt has been made to eliminate the non-significant decimal places.
- 2) This batgrbproduct analysis is done using the HEASARC data.
- 3) This batgrbproduct analysis is using the flight position for the mask-weighting calculation.
======================================================================
                  BAT GRB EVENT DATA PROCESSING REPORT
    Process Script Ver: batgrbproduct v2.48
    Process Start Time: Wed Jun 14 15:16:30 EDT 2023
             Host Name: batproc1
   Current Working Dir: /local/data/bat1/alien/Swift_3rdBATcatalog/event/batevent_reproc/trigger1152509
======================================================================

  Trigger: 01152509      Segment: 000

  BAT Trigger Time: 697172248   [s; MET]
      Trigger Stop: 697172312   [s; MET]
               UTC: 2023-02-04T02:56:57.304260    [includes UTCF correction]
       Where From?: TDRSS position message

  BAT
    RA: 238.16447566395   Dec: -50.8579554299044  [deg; J2000]

     Catalogged Source?: NO
     Point Source?:      YES
     GRB Indicated?:     YES    [ by BAT flight software ]
     Image S/N Ratio:    7.78
     Image Trigger?:     YES
     Rate S/N Ratio:     0  [ if not an image trigger ]
     Image S/N Ratio:    7.78

  Analysis Position:   [ source = BAT ]
    RA: 238.16447566395   Dec: -50.8579554299044  [deg; J2000]

  Refined Position:   [ source = BAT pre-slew burst ]
    RA: 238.146638473473   Dec: -50.8480355552668  [deg; J2000]
        { 15h 52m 35.2s , -50d 50' 52.9" }
         +/- 2.49560617367993 [arcmin] (estimated 90% radius based on SNR)
         +/- 1.31814913004341 [arcmin] (formal 1-sigma fit error)
    SNR: 8.23614570246709

  Angular difference between the analysis and refined position is 0.900421 arcmin

  Partial Coding Fraction: 0.4882812    [ including projection effects ]

  Duration
     T90: 186.192000031471 +/- 23.7577641833218
        Measured from: -5.19200003147125
                   to: 181     [s; relative to TRIGTIME]
     T50: 108.320000052452 +/- 22.3625113793964
        Measured from: 45.1280000209808
                   to: 153.448000073433     [s; relative to TRIGTIME]


  Fluence
     Peak Flux  (peak 1 second)
        Measured from: 148.108000040054
                   to: 149.108000040054     [s; relative to TRIGTIME]
     Total Fluence
        Measured from: -23.9119999408722
                   to: 195.592000007629     [s; relative to TRIGTIME]

             Band 1     Band 2     Band 3     Band 4
              15-25      25-50     50-100    100-350     keV
 Total     1.994299   2.546794   1.695147   0.322284
           0.180038   0.168897   0.142520   0.119340 [error]
 Peak      0.024123   0.047075   0.042050   0.019619
           0.010842   0.010094   0.008785   0.007409 [error]

     [ fluence units of on-axis counts / fully illuminated detector ]

======================================================================


====== Table of the duration information =============================

        Value   tstart    tstop
T100  219.504  -23.912  195.592
T90   186.192   -5.192  181.000
T50   108.320   45.128  153.448
Peak    1.000  148.108  149.108


====== Spectral Analysis Summary =====================================

Model      : spectral model: simple power-law (PL) and cutoff power-law (CPL)
Ph_index   : photon index: E^{Ph_index}
Ph_90err   : 90% error of the photon index
Epeak      : Epeak in keV
Epeak_90err: 90% error of Epeak
Norm       : normalization at 50 keV in both the PL model and CPL model
Nomr_90err : 90% error of the normalization
chi2       : Chi-Squared
dof        : degree of freedo

=== Time-averaged spectral analysis ===
(Best model with acceptable fit: PL)

Model Ph_index Ph_90err_low Ph_90err_hi  Epeak  Epeak_90err_low  Epeak_90err_hi  Norm       Nomr_90err_low    Norm_90err_hi    chi2    dof
PL      -1.698    -0.136      0.134       -           -               -         1.86e-03     -1.52e-04          1.50e-04      40.160   57
CPL     -1.220    -0.520      0.598       75.934     -20.927       -75.934      3.35e-03     -1.53e-03          3.53e-03      37.720   56


=== 1-s peak spectral analysis ===
(Best model with acceptable fit: PL)

Model Ph_index Ph_90err_low Ph_90err_hi  Epeak  Epeak_90err_low  Epeak_90err_hi  Norm       Nomr_90err_low    Norm_90err_hi    chi2    dof
PL      -0.990     -0.464     0.535       -           -               -         7.71e-03     -1.99e-03          1.88e-03      49.310   57
CPL     -1.009     -0.444     0.565     9999.360    -9999.360      -9999.360      7.79e-03     -2.02e-03          1.06e-02      49.330   56


=== Fluence/Peak Flux Summary ===

              Model    Band1     Band2     Band3     Band4     Band5     Total
                       15-25     25-50    50-100    100-350    15-150    15-350    keV
Fluence         PL   6.29e-07  1.02e-06  1.26e-06  3.07e-06  3.79e-06  5.99e-06   erg/cm2
      90%_error_low -7.59e-08 -7.84e-08 -1.37e-07 -6.44e-07 -3.23e-07 -7.76e-07   erg/cm2
      90%_error_hi   7.82e-08  7.84e-08  1.38e-07  7.53e-07  3.26e-07  8.60e-07   erg/cm2
Peak flux       PL   1.95e-01  2.66e-01  2.68e-01  4.89e-01  8.87e-01  1.22e+00   ph/cm2/s
      90%_error_low -1.02e-01 -9.44e-02 -6.77e-02 -2.36e-01 -2.26e-01 -3.00e-01   ph/cm2/s
      90%_error_hi   1.25e-01  8.79e-02  6.58e-02  3.79e-01  2.28e-01  3.27e-01   ph/cm2/s

Fluence        CPL   5.89e-07  1.08e-06  1.28e-06  1.46e-06  3.62e-06  4.40e-06   erg/cm2
      90%_error_low -8.84e-08 -9.82e-08 -1.48e-07 -7.67e-07 -3.67e-07 -8.58e-07   erg/cm2
      90%_error_hi   8.93e-08  1.01e-07  1.48e-07  1.81e-06  3.71e-07  1.85e-06   erg/cm2
Peak flux      CPL   1.95e-01  2.69e-01  2.65e-01  5.01e-01  9.07e-01  1.22e+00   ph/cm2/s
      90%_error_low     N/A   -9.81e-02     N/A       N/A   -2.46e-01 -3.70e-01   ph/cm2/s
      90%_error_hi      N/A    8.68e-02     N/A       N/A    2.08e-01  3.22e-01   ph/cm2/s

======================================================================
Image
Pre-slew 15.0-350.0 keV image (Event data)
#   RAcent    DECcent   POSerr    Theta     Phi              Peak Cts       SNR   Name
  238.1466   -50.8480   0.0232    26.1096   -67.7966         2.3545221      8.236 TRIG_01152509

Foreground time interval of the image:
-23.912  72.301 (delta_t =  96.213 [sec])
Background time interval of the image:
-239.000 -23.912 (delta_t = 215.088 [sec])
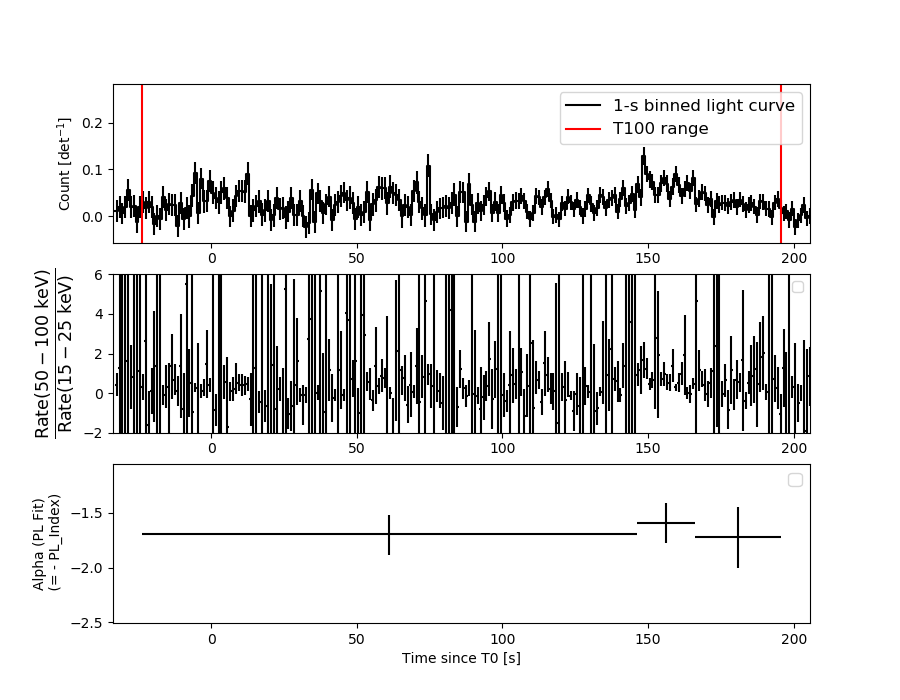
Light Curves
Note: The mask-weighted lightcurves have units of either count/det or counts/sec/det, where a det is 0.4 x 0.4 = 0.16 sq cm.
Full-time range; 1 s binning
Other quick-look light curves:
- 64 ms binning (zoomed)
- 16 ms binning (zoomed)
- 8 ms binning (zoomed)
- 2 ms binning (zoomed)
- SN=5 or 10 s binning (full-time range)
- Raw light curve
Spectra
- 64 ms binning (zoomed)
- 16 ms binning (zoomed)
- 8 ms binning (zoomed)
- 2 ms binning (zoomed)
- SN=5 or 10 s binning (full-time range)
- Raw light curve
Spectra
Notes:
- 1) The fitting includes the systematic errors.
- 2) When the burst includes telescope slew time periods, the fitting uses an average response file made from multiple 5-s response files through out the slew time plus single time preiod for the non-slew times, and weighted by the total counts in the corresponding time period using addrmf. An average response file is needed becuase a spectral fit using the pre-slew DRM will introduce some errors in both a spectral shape and a normalization if the PHA file contains a lot of the slew/post-slew time interval.
- 3) For fits to more complicated models (e.g. a power-law over a cutoff power-law), the BAT team has decided to require a chi-square improvement of more than 6 for each extra dof.
Time averaged spectrum fit using the average DRM
Power-law model
Time interval is from  -23.912 sec. to  195.592 sec.

Spectral model in power-law:
------------------------------------------------------------
Parameters  : value       lower 90%   higher 90%
Photon index: -1.69844     ( -0.136454   0.134436 )
Norm@50keV  : 1.86314E-03    ( -0.000151776   0.000150462 )
------------------------------------------------------------
#Fit statistic  : Chi-Squared                   40.16     using 59 bins.
 Reduced chi-squared = 0.704561
# Null hypothesis probability of 9.56e-01 with 57 degrees of freedom

Photon flux (15-150 keV)    in 219.5 sec: 0.247322 ( -0.019022  0.019048 ) ph/cm2/s
Energy fluence (15-150 keV)             : 3.78752e-06 ( -3.22507e-07  3.25918e-07 ) ergs/cm2
Cutoff power-law model
Time interval is from  -23.912 sec. to  195.592 sec.
Spectral model in the cutoff power-law:
------------------------------------------------------------
Parameters  : value       lower 90%   higher 90%
Photon index: -1.21963     ( -0.520033   0.597772 )
Epeak [keV] : 75.9345      ( -20.927 -75.9345 )
Norm@50keV  : 3.35086E-03    ( -0.00153343   0.00352515 )
------------------------------------------------------------
#Fit statistic  : Chi-Squared                   37.72     using 59 bins.
 Reduced chi-squared = 0.673571
# Null hypothesis probability of 9.71e-01 with 56 degrees of freedom

Photon flux (15-150 keV)    in 219.5 sec: 0.241619 ( -0.020038  0.020021 ) ph/cm2/s
Energy fluence (15-150 keV)             : 3.62146e-06 ( -3.67114e-07  3.71032e-07 ) ergs/cm2
1-s peak spectrum fit
Power-law model
Time interval is from  148.108 sec. to  149.108 sec.

Spectral model in power-law:
------------------------------------------------------------
Parameters  : value       lower 90%   higher 90%
Photon index: -0.990223     ( -0.464219   0.535143 )
Norm@50keV  : 7.70987E-03    ( -0.00198826   0.00188446 )
------------------------------------------------------------
#Fit statistic  : Chi-Squared                   49.31     using 59 bins.
 Reduced chi-squared = 0.865088
# Null hypothesis probability of 7.56e-01 with 57 degrees of freedom

Photon flux (15-150 keV)    in 1 sec: 0.887176 ( -0.22611  0.228324 ) ph/cm2/s
Energy fluence (15-150 keV)             : 8.367e-08 ( -2.08005e-08  2.0932e-08 ) ergs/cm2
Cutoff power-law model
Time interval is from  148.108 sec. to  149.108 sec.
Spectral model in the cutoff power-law:
------------------------------------------------------------
Parameters  : value       lower 90%   higher 90%
Photon index: -1.0092     ( -0.445249   0.563065 )
Epeak [keV] : 9999.36      ( -9999.36 -9999.36 )
Norm@50keV  : 7.78540E-03    ( -0.00201453   0.0105792 )
------------------------------------------------------------
#Fit statistic  : Chi-Squared                   49.33     using 59 bins.
 Reduced chi-squared = 0.880893
# Null hypothesis probability of 7.24e-01 with 56 degrees of freedom

Photon flux (15-150 keV)    in 1 sec: 0.907019 ( -0.246117  0.208321 ) ph/cm2/s
Energy fluence (15-150 keV)             : 8.37009e-08 ( -2.08748e-08  2.0877e-08 ) ergs/cm2
Time-resolved spectra
Distribution
T90 vs. Hardness ratio plot
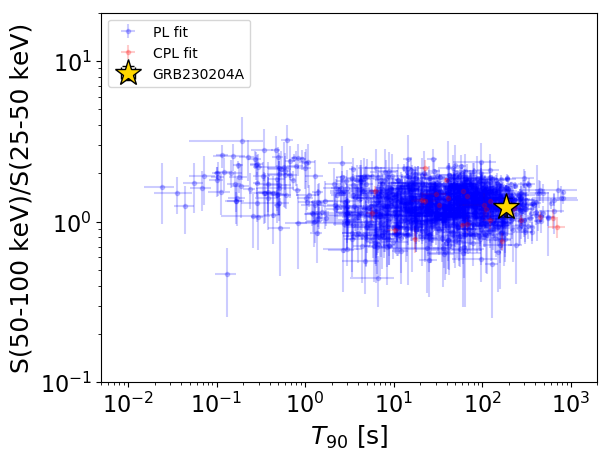
T90                                   = 186.192 sec.
Hardness ratio (energy fluence ratio) = 1.23250870563
S(15-50 keV) vs. S(50-150 keV) plot
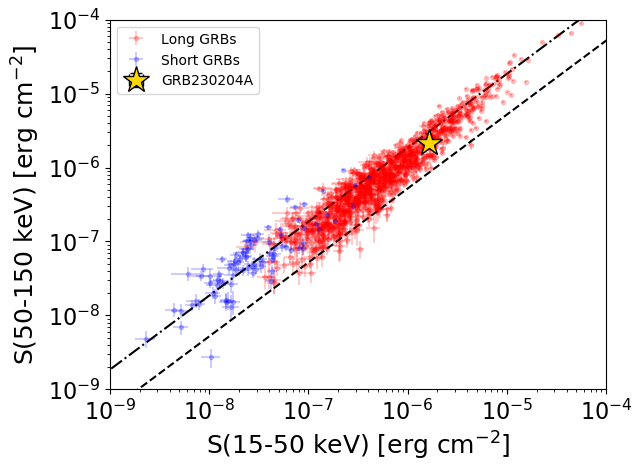
S(15-50 keV)  = 1.6539048e-06
S(50-150 keV) = 2.1336101e-06
The dash-dotted line and the dashed line traces the fluences calculated from the Band function with Epeak = 15 and 150 keV, respectively. Both lines assume a canonical values of alpha = -1 and beta = -2.5.
Mask shadow pattern
IMX = 1.852074809784956E-01, IMY = 4.537608147384308E-01
Spacecraft aspect plot
Bright source in the pre-burst/pre-slew/post-slew images
Pre-burst image of 15-350 keV band
Time interval of the image:
-239.000000 -23.912000

# RAcent  DECcent POSerr Theta    Phi  PeakCts   SNR AngSep     Name
#  [deg]    [deg]    ['] [deg]  [deg]                   [']
170.1768 -60.7970    7.6  37.0    5.6  -0.8319  -1.5   11.2	Cen X-3
187.0876 -62.7515  273.1  32.1   -6.0   0.0197   0.0   11.9	GX 301-2
244.9990 -15.6635    0.9  36.1 -138.1   7.4510  13.0    1.8	Sco X-1
256.0270 -37.7962    4.4  36.7  -96.8   2.7646   2.6    3.5	4U 1700-377
256.5214 -36.3542    6.6  37.3  -99.0   1.9990   1.7    5.9	GX 349+2
180.1912  -4.3033    3.3  41.0  104.0   4.3804   3.5 ------	UNKNOWN
176.5046 -17.0824    3.4  34.8   84.8   3.1394   3.4 ------	UNKNOWN
227.2085 -85.9290    1.9  52.0  -27.5   9.2104   6.1 ------	UNKNOWN
Pre-slew background subtracted image of 15-350 keV band
Time interval of the image:
-23.912000 72.300580

# RAcent  DECcent POSerr Theta    Phi  PeakCts   SNR AngSep     Name
#  [deg]    [deg]    ['] [deg]  [deg]                   [']
170.2537 -60.6242    2.8  36.9    5.8   1.0707   4.2    1.8	Cen X-3
186.4569 -62.6820    4.1  32.2   -5.5   0.6043   2.8    7.6	GX 301-2
244.9289 -15.6266    4.2  36.1 -138.2   0.9219   2.8    3.0	Sco X-1
256.0616 -37.7233   15.9  36.7  -96.9  -0.4751  -0.7    8.1	4U 1700-377
256.2415 -36.3093    4.9  37.1  -99.1   1.6083   2.4   11.6	GX 349+2
193.5567 -24.5071    2.2  17.6   92.9   1.1061   5.2 ------	UNKNOWN
219.8678 -71.6818    2.6  37.9  -30.8   1.2617   4.5 ------	UNKNOWN
238.1466 -50.8480    1.4  26.1  -67.8   2.3533   8.2 ------	UNKNOWN
258.5702 -40.0039    2.3  38.4  -92.7   3.8390   5.0 ------	UNKNOWN
256.0111  -5.4309    2.2  51.0 -139.7   4.5134   5.2 ------	UNKNOWN
Post-slew image of 15-350 keV band
Time interval of the image:
134.700610 963.182900

# RAcent  DECcent POSerr Theta    Phi  PeakCts   SNR AngSep     Name
#  [deg]    [deg]    ['] [deg]  [deg]                   [']
170.4414 -60.4834    6.8  37.6   46.3   4.5266   1.7    9.2	Cen X-3
186.3894 -62.8434    2.7  29.7   44.1   8.1333   4.2    8.5	GX 301-2
244.9862 -15.6405    1.0  35.6 -170.9  22.5541  11.5    0.4	Sco X-1
255.9997 -37.8662    6.0  18.1 -131.2   3.0249   1.9    1.5	4U 1700-377
256.5754 -36.3251    3.1  19.6 -132.9   5.5814   3.7    9.0	GX 349+2
262.8909 -24.8614    6.3  32.2 -136.8   3.4533   1.8    9.5	GX 1+4
264.9988 -44.5249   16.8  19.0 -101.2   1.1195   0.7   11.8	4U 1735-44
270.3500 -25.1306    6.0  35.6 -126.3   4.7078   1.9    4.7	GX 5-1
270.3315 -25.6009    4.2  35.2 -125.8   6.4883   2.7    8.7	GRS 1758-258
274.1705 -14.1138    4.0  46.8 -130.8  15.0537   2.9   10.7	GX 17+2
275.7545 -30.4001   11.3  34.5 -114.0  -2.5781  -1.0    9.0	H1820-303
262.7984 -33.8152    6.1  24.7 -126.3   2.7872   1.9    9.6	GX 354-0
189.0730 -41.0398    3.7  34.8   84.7  11.0183   3.1 ------	UNKNOWN
 38.2195 -72.7541    2.7  55.6   -9.2  12.7141   4.3 ------	UNKNOWN