Analysis Summary
Notes:
- 1) No attempt has been made to eliminate the non-significant decimal places.
- 2) This batgrbproduct analysis is done using the HEASARC data.
- 3) This batgrbproduct analysis is using the flight position for the mask-weighting calculation.
======================================================================
                  BAT GRB EVENT DATA PROCESSING REPORT
    Process Script Ver: batgrbproduct v2.48
    Process Start Time: Wed Jun 14 15:15:18 EDT 2023
             Host Name: batproc1
   Current Working Dir: /local/data/bat1/alien/Swift_3rdBATcatalog/event/batevent_reproc/trigger1152764
======================================================================

  Trigger: 01152764      Segment: 000

  BAT Trigger Time: 697285821.888   [s; MET]
      Trigger Stop: 697285824.96   [s; MET]
               UTC: 2023-02-05T10:29:51.184520    [includes UTCF correction]
       Where From?: TDRSS position message

  BAT
    RA: 202.072208101792   Dec: 46.6836265763065  [deg; J2000]

     Catalogged Source?: NO
     Point Source?:      YES
     GRB Indicated?:     YES    [ by BAT flight software ]
     Image S/N Ratio:    6.58
     Image Trigger?:     NO
     Rate S/N Ratio:     15.1657508881031  [ if not an image trigger ]
     Image S/N Ratio:    6.58

  Analysis Position:   [ source = BAT ]
    RA: 202.072208101792   Dec: 46.6836265763065  [deg; J2000]

  Refined Position:   [ source = BAT pre-slew burst ]
    RA: 202.057051780186   Dec: 46.6855823698498  [deg; J2000]
        { 13h 28m 13.7s , +46d 41' 08.1" }
         +/- 2.32910945096139 [arcmin] (estimated 90% radius based on SNR)
         +/- 1.25094237053151 [arcmin] (formal 1-sigma fit error)
    SNR: 9.08994767642737

  Angular difference between the analysis and refined position is 0.634788 arcmin

  Partial Coding Fraction: 1.015625    [ including projection effects ]

  Duration
     T90: 2.29999995231628 +/- 0.355105682948718
        Measured from: 0.455999970436096
                   to: 2.75599992275238     [s; relative to TRIGTIME]
     T50: 1.32799994945526 +/- 0.424867052812541
        Measured from: 0.983999967575073
                   to: 2.31199991703033     [s; relative to TRIGTIME]


  Fluence
     Peak Flux  (peak 1 second)
        Measured from: 1.74399995803833
                   to: 2.74399995803833     [s; relative to TRIGTIME]
     Total Fluence
        Measured from: 0.315999984741211
                   to: 2.87199997901917     [s; relative to TRIGTIME]

             Band 1     Band 2     Band 3     Band 4
              15-25      25-50     50-100    100-350     keV
 Total     0.073330   0.094789   0.072597   0.028195
           0.014746   0.015528   0.013945   0.011427 [error]
 Peak      0.046928   0.039507   0.032705   0.007689
           0.009455   0.010307   0.008960   0.007189 [error]

     [ fluence units of on-axis counts / fully illuminated detector ]

======================================================================


====== Table of the duration information =============================

        Value   tstart    tstop
T100    2.556    0.316    2.872
T90     2.300    0.456    2.756
T50     1.328    0.984    2.312
Peak    1.000    1.744    2.744


====== Spectral Analysis Summary =====================================

Model      : spectral model: simple power-law (PL) and cutoff power-law (CPL)
Ph_index   : photon index: E^{Ph_index}
Ph_90err   : 90% error of the photon index
Epeak      : Epeak in keV
Epeak_90err: 90% error of Epeak
Norm       : normalization at 50 keV in both the PL model and CPL model
Nomr_90err : 90% error of the normalization
chi2       : Chi-Squared
dof        : degree of freedo

=== Time-averaged spectral analysis ===
(Best model with acceptable fit: PL)

Model Ph_index Ph_90err_low Ph_90err_hi  Epeak  Epeak_90err_low  Epeak_90err_hi  Norm       Nomr_90err_low    Norm_90err_hi    chi2    dof
PL      -1.439    -0.298      0.290       -           -               -         6.52e-03     -1.16e-03          1.15e-03      37.790   57
CPL     -1.001    -0.711      1.512      112.848    -112.848      -112.848      1.09e-02     -5.49e-03          5.16e-02      37.380   56


=== 1-s peak spectral analysis ===
(Best model with acceptable fit: PL)

Model Ph_index Ph_90err_low Ph_90err_hi  Epeak  Epeak_90err_low  Epeak_90err_hi  Norm       Nomr_90err_low    Norm_90err_hi    chi2    dof
PL      -1.776     -0.487     0.418       -           -               -         6.92e-03     -2.11e-03          1.96e-03      44.170   57
CPL     -1.746     -1.884     1.709      402.204    -402.194      -402.204      7.18e-03     -7.18e-03          4.93e-02      44.170   56


=== Fluence/Peak Flux Summary ===

              Model    Band1     Band2     Band3     Band4     Band5     Total
                       15-25     25-50    50-100    100-350    15-150    15-350    keV
Fluence         PL   2.01e-08  3.83e-08  5.65e-08  1.79e-07  1.60e-07  2.94e-07   erg/cm2
      90%_error_low -5.34e-09 -6.67e-09 -1.32e-08 -7.41e-08 -3.16e-08 -8.75e-08   erg/cm2
      90%_error_hi   5.66e-09  6.61e-09  1.31e-08  1.02e-07  3.23e-08  1.11e-07   erg/cm2
Peak flux       PL   3.71e-01  3.18e-01  1.86e-01  1.62e-01  9.45e-01  1.04e+00   ph/cm2/s
      90%_error_low -1.24e-01 -7.55e-02 -7.17e-02 -9.57e-02 -2.25e-01 -2.56e-01   ph/cm2/s
      90%_error_hi   1.32e-01  7.55e-02  7.08e-02  1.46e-01  2.25e-01  2.60e-01   ph/cm2/s

Fluence        CPL   1.88e-08  4.03e-08  5.81e-08  9.29e-08  1.55e-07  2.10e-07   erg/cm2
      90%_error_low -6.56e-09 -8.09e-09 -1.41e-08 -7.37e-08 -3.43e-08 -8.30e-08   erg/cm2
      90%_error_hi   6.50e-09  8.89e-09  1.47e-08  2.03e-07  3.49e-08  1.17e-07   erg/cm2
Peak flux      CPL   3.70e-01  3.19e-01  1.86e-01  1.56e-01  9.44e-01  1.03e+00   ph/cm2/s
      90%_error_low -1.45e-01 -7.67e-02 -7.59e-02 -1.56e-01 -2.26e-01 -2.86e-01   ph/cm2/s
      90%_error_hi   1.36e-01  9.77e-02  7.88e-02  9.02e-02  2.25e-01  2.62e-01   ph/cm2/s

======================================================================
Image
Pre-slew 15.0-350.0 keV image (Event data)
#   RAcent    DECcent   POSerr    Theta     Phi              Peak Cts       SNR   Name
  202.0571    46.6856   0.0213    11.3250   174.1393         0.2508746      9.090 TRIG_01152764

Foreground time interval of the image:
  0.316   2.872 (delta_t =   2.556 [sec])
Background time interval of the image:
-239.888   0.316 (delta_t = 240.204 [sec])
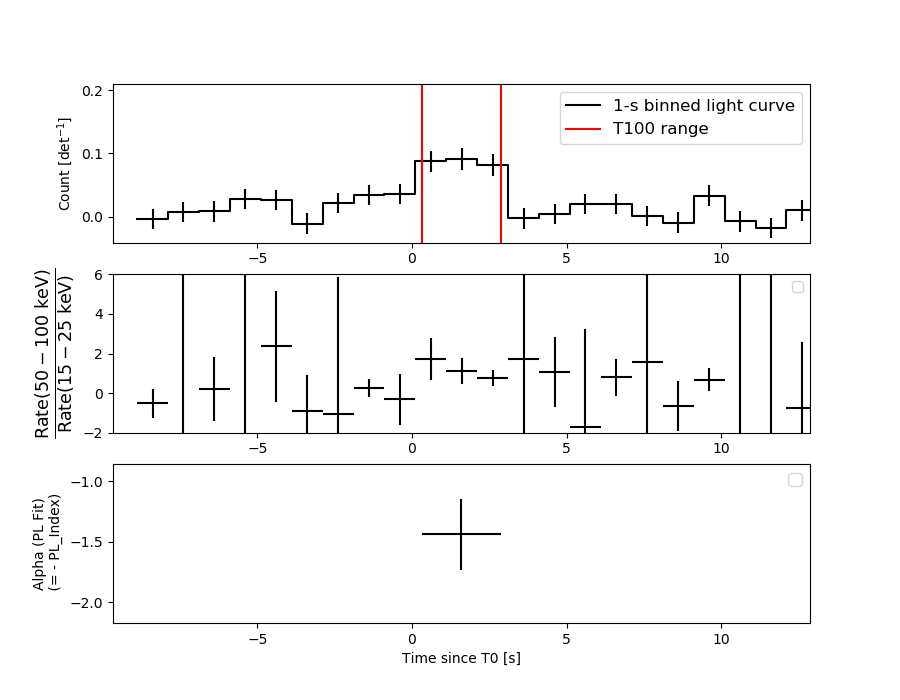
Light Curves
Note: The mask-weighted lightcurves have units of either count/det or counts/sec/det, where a det is 0.4 x 0.4 = 0.16 sq cm.
Full-time range; 1 s binning
Other quick-look light curves:
- 64 ms binning (zoomed)
- 16 ms binning (zoomed)
- 8 ms binning (zoomed)
- 2 ms binning (zoomed)
- SN=5 or 10 s binning (full-time range)
- Raw light curve
Spectra
- 64 ms binning (zoomed)
- 16 ms binning (zoomed)
- 8 ms binning (zoomed)
- 2 ms binning (zoomed)
- SN=5 or 10 s binning (full-time range)
- Raw light curve
Spectra
Notes:
- 1) The fitting includes the systematic errors.
- 2) When the burst includes telescope slew time periods, the fitting uses an average response file made from multiple 5-s response files through out the slew time plus single time preiod for the non-slew times, and weighted by the total counts in the corresponding time period using addrmf. An average response file is needed becuase a spectral fit using the pre-slew DRM will introduce some errors in both a spectral shape and a normalization if the PHA file contains a lot of the slew/post-slew time interval.
- 3) For fits to more complicated models (e.g. a power-law over a cutoff power-law), the BAT team has decided to require a chi-square improvement of more than 6 for each extra dof.
Time averaged spectrum fit using the average DRM
Power-law model
Time interval is from    0.316 sec. to    2.872 sec.

Spectral model in power-law:
------------------------------------------------------------
Parameters  : value       lower 90%   higher 90%
Photon index: -1.43876     ( -0.298135   0.289614 )
Norm@50keV  : 6.51527E-03    ( -0.00116319   0.00114577 )
------------------------------------------------------------
#Fit statistic  : Chi-Squared                   37.79     using 59 bins.
 Reduced chi-squared = 0.662982
# Null hypothesis probability of 9.77e-01 with 57 degrees of freedom

Photon flux (15-150 keV)    in 2.556 sec: 0.800720 ( -0.135542  0.135599 ) ph/cm2/s
Energy fluence (15-150 keV)             : 1.59713e-07 ( -3.16274e-08  3.22514e-08 ) ergs/cm2
Cutoff power-law model
Time interval is from    0.316 sec. to    2.872 sec.
Spectral model in the cutoff power-law:
------------------------------------------------------------
Parameters  : value       lower 90%   higher 90%
Photon index: -1.00091     ( -0.71085   1.51206 )
Epeak [keV] : 112.848      ( -112.844 -112.844 )
Norm@50keV  : 1.09426E-02    ( -0.00548681   0.051557 )
------------------------------------------------------------
#Fit statistic  : Chi-Squared                   37.38     using 59 bins.
 Reduced chi-squared = 0.6675
# Null hypothesis probability of 9.74e-01 with 56 degrees of freedom

Photon flux (15-150 keV)    in 2.556 sec: 0.788264 ( -0.140834  0.139664 ) ph/cm2/s
Energy fluence (15-150 keV)             : 1.54504e-07 ( -3.43163e-08  3.49178e-08 ) ergs/cm2
1-s peak spectrum fit
Power-law model
Time interval is from    1.744 sec. to    2.744 sec.

Spectral model in power-law:
------------------------------------------------------------
Parameters  : value       lower 90%   higher 90%
Photon index: -1.77574     ( -0.487266   0.418079 )
Norm@50keV  : 6.92121E-03    ( -0.00210856   0.00195745 )
------------------------------------------------------------
#Fit statistic  : Chi-Squared                   44.17     using 59 bins.
 Reduced chi-squared = 0.774912
# Null hypothesis probability of 8.93e-01 with 57 degrees of freedom

Photon flux (15-150 keV)    in 1 sec: 0.944954 ( -0.224618  0.224616 ) ph/cm2/s
Energy fluence (15-150 keV)             : 6.37911e-08 ( -1.89372e-08  1.95386e-08 ) ergs/cm2
Cutoff power-law model

Time interval is from    1.744 sec. to    2.744 sec.
Spectral model in the cutoff power-law:
------------------------------------------------------------
Parameters  : value       lower 90%   higher 90%
Photon index: -1.7461     ( -1.88421   1.70918 )
Epeak [keV] : 402.204      ( -404.416 -404.426 )
Norm@50keV  : 7.18276E-03    ( -0.00718372   0.0493428 )
------------------------------------------------------------
#Fit statistic  : Chi-Squared                   44.17     using 59 bins.
 Reduced chi-squared = 0.78875
# Null hypothesis probability of 8.74e-01 with 56 degrees of freedom

Photon flux (15-150 keV)    in 1 sec: 0.944409 ( -0.226002  0.224611 ) ph/cm2/s
Energy fluence (15-150 keV)             : 5.083e-08 ( -2.36637e-08  2.02112e-08 ) ergs/cm2
Time-resolved spectra
Distribution
T90 vs. Hardness ratio plot
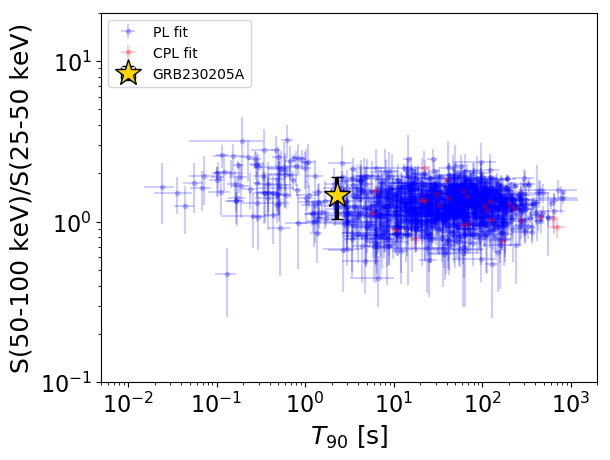
T90                                   = 2.3 sec.
Hardness ratio (energy fluence ratio) = 1.47557021881
S(15-50 keV) vs. S(50-150 keV) plot
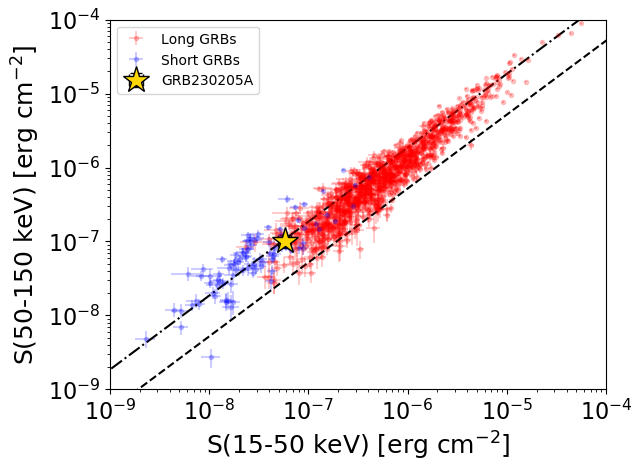
S(15-50 keV)  = 5.838132e-08
S(50-150 keV) = 1.0133119e-07
The dash-dotted line and the dashed line traces the fluences calculated from the Band function with Epeak = 15 and 150 keV, respectively. Both lines assume a canonical values of alpha = -1 and beta = -2.5.
Mask shadow pattern
IMX = -1.992266900346516E-01, IMY = -2.045001260735579E-02
Spacecraft aspect plot
Bright source in the pre-burst/pre-slew/post-slew images
Pre-burst image of 15-350 keV band
Time interval of the image:
-239.888000 0.316000

# RAcent  DECcent POSerr Theta    Phi  PeakCts   SNR AngSep     Name
#  [deg]    [deg]    ['] [deg]  [deg]                   [']
254.3488  35.2554   12.7  39.3  -97.8   1.5491   0.9    7.5	Her X-1
184.3494  88.5749    2.8  53.0 -174.3   7.8484   4.2 ------	UNKNOWN
215.3942  38.9156    2.5   8.5 -109.1   2.0900   4.7 ------	UNKNOWN
249.7256  19.7552    2.7  41.8  -73.3   6.2860   4.3 ------	UNKNOWN
Pre-slew background subtracted image of 15-350 keV band
Time interval of the image:
0.316000 2.872000

# RAcent  DECcent POSerr Theta    Phi  PeakCts   SNR AngSep     Name
#  [deg]    [deg]    ['] [deg]  [deg]                   [']
254.4918  35.2705    5.7  39.4  -97.9  -0.2484  -2.0    4.6	Her X-1
205.2538 -17.8457    2.5  53.5    6.7   0.4124   4.6 ------	UNKNOWN
202.0570  46.6856    1.3  11.3  174.1   0.2508   9.1 ------	UNKNOWN
234.8250  50.2787    2.2  25.7 -127.4   0.1797   5.2 ------	UNKNOWN
Post-slew image of 15-350 keV band
Time interval of the image:
80.412640 962.198600

# RAcent  DECcent POSerr Theta    Phi  PeakCts   SNR AngSep     Name
#  [deg]    [deg]    ['] [deg]  [deg]                   [']
254.4970  35.3706    9.3  40.3  -84.6   6.2911   1.2    2.6	Her X-1
147.9890  36.2684    2.5  41.0  104.0  19.8063   4.7 ------	UNKNOWN
173.7769  60.2035    2.4  21.3  148.2   8.3633   4.8 ------	UNKNOWN