Analysis Summary
Notes:
- 1) No attempt has been made to eliminate the non-significant decimal places.
- 2) This batgrbproduct analysis is done using the HEASARC data.
- 3) This batgrbproduct analysis is using the flight position for the mask-weighting calculation.
======================================================================
BAT GRB EVENT DATA PROCESSING REPORT
Process Script Ver: batgrbproduct v2.48
Process Start Time: Wed Jun 14 15:14:02 EDT 2023
Host Name: batproc1
Current Working Dir: /local/data/bat1/alien/Swift_3rdBATcatalog/event/batevent_reproc/trigger1154815
======================================================================
Trigger: 01154815 Segment: 000
BAT Trigger Time: 698251745.6 [s; MET]
Trigger Stop: 698251747.648 [s; MET]
UTC: 2023-02-16T14:48:34.830740 [includes UTCF correction]
Where From?: TDRSS position message
BAT
RA: 113.966019310163 Dec: -8.01514618542377 [deg; J2000]
Catalogged Source?: NO
Point Source?: YES
GRB Indicated?: YES [ by BAT flight software ]
Image S/N Ratio: 7.91
Image Trigger?: NO
Rate S/N Ratio: 8.83176086632785 [ if not an image trigger ]
Image S/N Ratio: 7.91
Analysis Position: [ source = BAT ]
RA: 113.966019310163 Dec: -8.01514618542377 [deg; J2000]
Refined Position: [ source = BAT pre-slew burst ]
RA: 113.96596489547 Dec: -7.99355296059845 [deg; J2000]
{ 07h 35m 51.8s , -07d 59' 36.8" }
+/- 2.13159207191573 [arcmin] (estimated 90% radius based on SNR)
+/- 1.01772383349777 [arcmin] (formal 1-sigma fit error)
SNR: 10.3167070725021
Angular difference between the analysis and refined position is 1.295598 arcmin
Partial Coding Fraction: 0.8515625 [ including projection effects ]
Duration
T90: 91.1999999284744 +/- 7.53924343521546
Measured from: -78.8960000276566
to: 12.3039999008179 [s; relative to TRIGTIME]
T50: 55.6159999370575 +/- 28.9156788765114
Measured from: -55.0240000486374
to: 0.591999888420105 [s; relative to TRIGTIME]
Fluence
Peak Flux (peak 1 second)
Measured from: -0.131999969482422
to: 0.868000030517578 [s; relative to TRIGTIME]
Total Fluence
Measured from: -81.0720000267029
to: 16.7839999198914 [s; relative to TRIGTIME]
Band 1 Band 2 Band 3 Band 4
15-25 25-50 50-100 100-350 keV
Total 0.937724 0.896558 0.437592 0.037500
0.099752 0.102789 0.089962 0.085937 [error]
Peak 0.049420 0.073928 0.028941 0.000367
0.011288 0.011900 0.010031 0.009239 [error]
[ fluence units of on-axis counts / fully illuminated detector ]
======================================================================
====== Table of the duration information =============================
Value tstart tstop
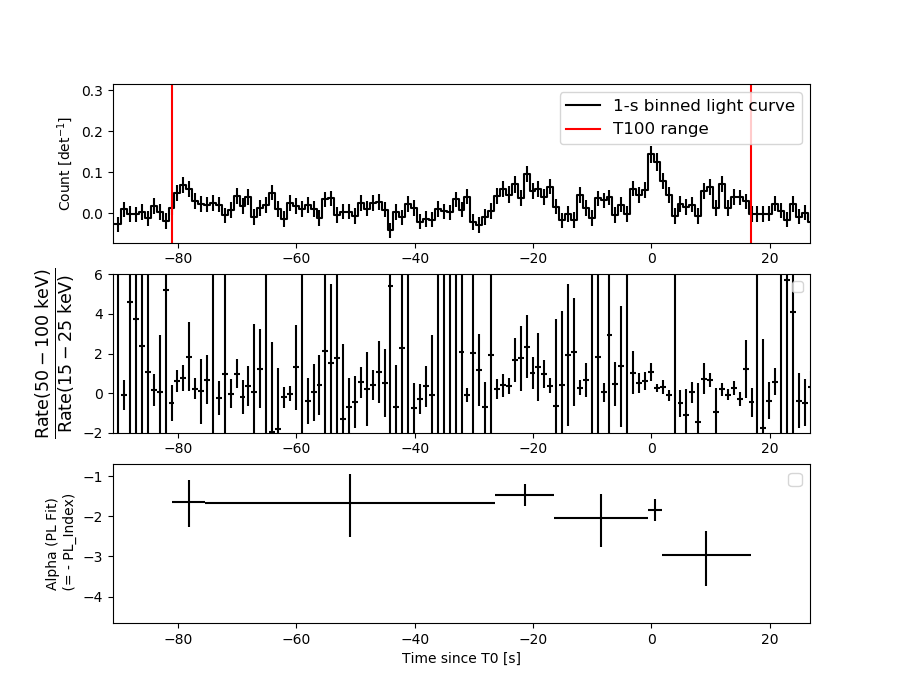
T100 97.856 -81.072 16.784
T90 91.200 -78.896 12.304
T50 55.616 -55.024 0.592
Peak 1.000 -0.132 0.868
====== Spectral Analysis Summary =====================================
Model : spectral model: simple power-law (PL) and cutoff power-law (CPL)
Ph_index : photon index: E^{Ph_index}
Ph_90err : 90% error of the photon index
Epeak : Epeak in keV
Epeak_90err: 90% error of Epeak
Norm : normalization at 50 keV in both the PL model and CPL model
Nomr_90err : 90% error of the normalization
chi2 : Chi-Squared
dof : degree of freedo
=== Time-averaged spectral analysis ===
(Best model with acceptable fit: PL)
Model Ph_index Ph_90err_low Ph_90err_hi Epeak Epeak_90err_low Epeak_90err_hi Norm Nomr_90err_low Norm_90err_hi chi2 dof
PL -1.918 -0.240 0.225 - - - 1.39e-03 -2.23e-04 2.18e-04 46.520 57
CPL -1.334 -0.779 1.071 47.229 -45.854 -47.229 3.05e-03 -3.05e-03 9.68e-03 45.260 56
=== 1-s peak spectral analysis ===
(Best model with acceptable fit: PL)
Model Ph_index Ph_90err_low Ph_90err_hi Epeak Epeak_90err_low Epeak_90err_hi Norm Nomr_90err_low Norm_90err_hi chi2 dof
PL -1.911 -0.389 0.354 - - - 8.51e-03 -2.32e-03 2.25e-03 63.140 57
CPL -0.550 -1.539 2.909 41.953 -41.953 78.477 5.64e-02 -5.64e-02 4.20e+00 60.950 56
=== Fluence/Peak Flux Summary ===
Model Band1 Band2 Band3 Band4 Band5 Total
15-25 25-50 50-100 100-350 15-150 15-350 keV
Fluence PL 2.58e-07 3.68e-07 3.90e-07 7.63e-07 1.25e-06 1.78e-06 erg/cm2
90%_error_low -4.37e-08 -4.60e-08 -8.34e-08 -2.80e-07 -1.92e-07 -3.83e-07 erg/cm2
90%_error_hi 4.47e-08 4.59e-08 8.58e-08 3.73e-07 1.98e-07 4.58e-07 erg/cm2
Peak flux PL 5.21e-01 4.11e-01 2.19e-01 1.69e-01 1.23e+00 1.32e+00 ph/cm2/s
90%_error_low -1.47e-01 -8.92e-02 -7.40e-02 -8.75e-02 -2.65e-01 -2.91e-01 ph/cm2/s
90%_error_hi 1.53e-01 8.91e-02 7.68e-02 1.30e-01 2.65e-01 2.94e-01 ph/cm2/s
Fluence CPL 2.47e-07 3.96e-07 3.78e-07 2.77e-07 1.18e-06 1.30e-06 erg/cm2
90%_error_low -4.90e-08 -7.10e-08 -9.80e-08 -2.10e-07 -2.08e-07 -3.09e-07 erg/cm2
90%_error_hi 4.84e-08 6.37e-08 9.37e-08 6.72e-07 2.27e-07 6.72e-07 erg/cm2
Peak flux CPL 4.78e-01 4.87e-01 2.04e-01 3.11e-02 1.20e+00 1.20e+00 ph/cm2/s
90%_error_low -1.65e-01 -1.22e-01 -1.15e-01 -3.11e-02 -2.64e-01 -2.68e-01 ph/cm2/s
90%_error_hi 1.66e-01 1.40e-01 9.41e-02 1.78e-01 2.66e-01 2.82e-01 ph/cm2/s
======================================================================
Image
Pre-slew 15.0-350.0 keV image (Event data)
#   RAcent    DECcent   POSerr    Theta     Phi              Peak Cts       SNR   Name
  113.9660    -7.9936   0.0187    15.9063    89.7704         2.4961010     10.317 TRIG_01154815

Foreground time interval of the image:
-81.072  16.784 (delta_t =  97.856 [sec])
Background time interval of the image:
-239.600 -81.072 (delta_t = 158.528 [sec])
Light Curves
Note: The mask-weighted lightcurves have units of either count/det or counts/sec/det, where a det is 0.4 x 0.4 = 0.16 sq cm.
Full-time range; 1 s binning
Other quick-look light curves:
- 64 ms binning (zoomed)
- 16 ms binning (zoomed)
- 8 ms binning (zoomed)
- 2 ms binning (zoomed)
- SN=5 or 10 s binning (full-time range)
- Raw light curve
Spectra
- 64 ms binning (zoomed)
- 16 ms binning (zoomed)
- 8 ms binning (zoomed)
- 2 ms binning (zoomed)
- SN=5 or 10 s binning (full-time range)
- Raw light curve
Spectra
Notes:
- 1) The fitting includes the systematic errors.
- 2) When the burst includes telescope slew time periods, the fitting uses an average response file made from multiple 5-s response files through out the slew time plus single time preiod for the non-slew times, and weighted by the total counts in the corresponding time period using addrmf. An average response file is needed becuase a spectral fit using the pre-slew DRM will introduce some errors in both a spectral shape and a normalization if the PHA file contains a lot of the slew/post-slew time interval.
- 3) For fits to more complicated models (e.g. a power-law over a cutoff power-law), the BAT team has decided to require a chi-square improvement of more than 6 for each extra dof.
Time averaged spectrum fit using the average DRM
Power-law model
Time interval is from  -81.072 sec. to   16.784 sec.

Spectral model in power-law:
------------------------------------------------------------
Parameters  : value       lower 90%   higher 90%
Photon index: -1.91784     ( -0.239715   0.225357 )
Norm@50keV  : 1.39331E-03    ( -0.000223385   0.000217549 )
------------------------------------------------------------
#Fit statistic  : Chi-Squared                   46.52     using 59 bins.
 Reduced chi-squared = 0.81614
# Null hypothesis probability of 8.38e-01 with 57 degrees of freedom

Photon flux (15-150 keV)    in 97.86 sec: 0.201498 ( -0.024838  0.024838 ) ph/cm2/s
Energy fluence (15-150 keV)             : 1.25405e-06 ( -1.9224e-07  1.97983e-07 ) ergs/cm2
Cutoff power-law model
Time interval is from  -81.072 sec. to   16.784 sec.
Spectral model in the cutoff power-law:
------------------------------------------------------------
Parameters  : value       lower 90%   higher 90%
Photon index: -1.33441     ( -0.778934   1.071 )
Epeak [keV] : 47.2292      ( -45.8543 -47.2292 )
Norm@50keV  : 3.04777E-03    ( -0.0030478   0.00968434 )
------------------------------------------------------------
#Fit statistic  : Chi-Squared                   45.26     using 59 bins.
 Reduced chi-squared = 0.808214
# Null hypothesis probability of 8.47e-01 with 56 degrees of freedom

Photon flux (15-150 keV)    in 97.86 sec: 0.197352 ( -0.025479  0.025551 ) ph/cm2/s
Energy fluence (15-150 keV)             : 1.17656e-06 ( -2.08026e-07  2.2698e-07 ) ergs/cm2
1-s peak spectrum fit
Power-law model
Time interval is from   -0.132 sec. to    0.868 sec.

Spectral model in power-law:
------------------------------------------------------------
Parameters  : value       lower 90%   higher 90%
Photon index: -1.91109     ( -0.389502   0.353413 )
Norm@50keV  : 8.51229E-03    ( -0.00232082   0.0022499 )
------------------------------------------------------------
#Fit statistic  : Chi-Squared                   63.14     using 59 bins.
 Reduced chi-squared = 1.10772
# Null hypothesis probability of 2.68e-01 with 57 degrees of freedom

Photon flux (15-150 keV)    in 1 sec: 1.22747 ( -0.264896  0.26491 ) ph/cm2/s
Energy fluence (15-150 keV)             : 7.82871e-08 ( -2.02641e-08  2.11595e-08 ) ergs/cm2
Cutoff power-law model
Time interval is from   -0.132 sec. to    0.868 sec.
Spectral model in the cutoff power-law:
------------------------------------------------------------
Parameters  : value       lower 90%   higher 90%
Photon index: -0.550152     ( -1.5399   2.90733 )
Epeak [keV] : 41.9529      ( -41.9417 78.488 )
Norm@50keV  : 5.64273E-02    ( -0.0565738   4.20011 )
------------------------------------------------------------
#Fit statistic  : Chi-Squared                   60.95     using 59 bins.
 Reduced chi-squared = 1.08839
# Null hypothesis probability of 3.02e-01 with 56 degrees of freedom

Photon flux (15-150 keV)    in 1 sec: 1.19643 ( -0.264396  0.26582 ) ph/cm2/s
Energy fluence (15-150 keV)             : 6.90542e-08 ( -1.99193e-08  2.32093e-08 ) ergs/cm2
Time-resolved spectra
Distribution
T90 vs. Hardness ratio plot
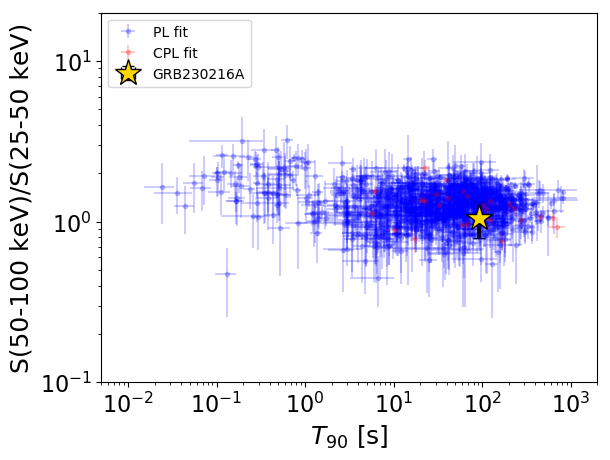
T90                                   = 91.2 sec.
Hardness ratio (energy fluence ratio) = 1.05864409645
S(15-50 keV) vs. S(50-150 keV) plot
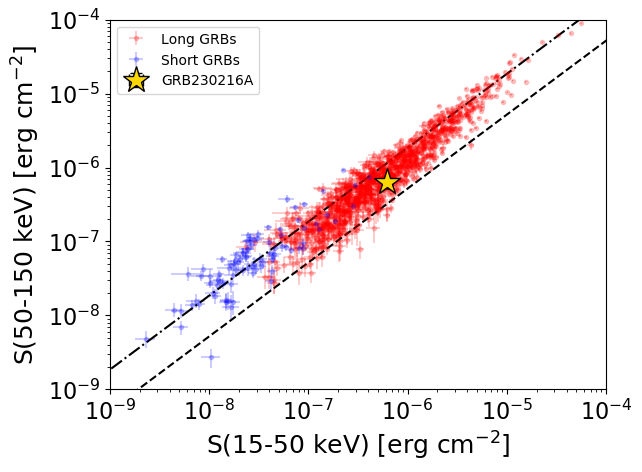
S(15-50 keV)  = 6.261054e-07
S(50-150 keV) = 6.279472e-07
The dash-dotted line and the dashed line traces the fluences calculated from the Band function with Epeak = 15 and 150 keV, respectively. Both lines assume a canonical values of alpha = -1 and beta = -2.5.
Mask shadow pattern
IMX = 1.141749730817181E-03, IMY = -2.849734827103940E-01
Spacecraft aspect plot
Bright source in the pre-burst/pre-slew/post-slew images
Pre-burst image of 15-350 keV band
Time interval of the image:
-239.600000 -81.072000

# RAcent  DECcent POSerr Theta    Phi  PeakCts   SNR AngSep     Name
#  [deg]    [deg]    ['] [deg]  [deg]                   [']
 83.6254  22.0298    0.9  43.9   14.0   6.2416  13.3    1.0	Crab
135.4708 -40.6720    4.1  36.8  173.0   1.4016   2.8    7.5	Vela X-1
138.2138   1.0800    2.0  41.0  104.0   6.4128   5.7 ------	UNKNOWN
124.0647 -69.1731    2.3  52.9 -151.8   4.7692   5.0 ------	UNKNOWN
Pre-slew background subtracted image of 15-350 keV band
Time interval of the image:
-81.072000 16.784000

# RAcent  DECcent POSerr Theta    Phi  PeakCts   SNR AngSep     Name
#  [deg]    [deg]    ['] [deg]  [deg]                   [']
 83.6275  22.1202    5.5  43.9   14.0   0.8718   2.1    6.4	Crab
135.6180 -40.5044    7.3  36.8  172.7   0.4676   1.6    5.1	Vela X-1
113.9659  -7.9936    1.1  15.9   89.8   2.4963  10.3 ------	UNKNOWN
 93.4855  10.3446    2.5  29.6   22.2   1.2078   4.6 ------	UNKNOWN
148.0983 -55.0577    2.5  51.0 -174.3   2.4570   4.5 ------	UNKNOWN
 84.2404 -11.2161    2.8  18.0  -31.4   0.9204   4.1 ------	UNKNOWN
136.4612 -57.0511    2.5  46.7 -167.3   1.8101   4.6 ------	UNKNOWN
Post-slew image of 15-350 keV band
Time interval of the image:
82.900590 962.526800

# RAcent  DECcent POSerr Theta    Phi  PeakCts   SNR AngSep     Name
#  [deg]    [deg]    ['] [deg]  [deg]                   [']
 83.6239  22.0147    0.8  42.3  -14.7  34.8150  14.2    0.5	Crab
135.5968 -40.5753    3.4  37.8 -177.7   8.3506   3.4    3.3	Vela X-1
163.5885 -29.9427    2.5  51.3  151.7  46.2118   4.6 ------	UNKNOWN