Analysis Summary
Notes:
- 1) No attempt has been made to eliminate the non-significant decimal places.
- 2) This batgrbproduct analysis is done using the HEASARC data.
- 3) This batgrbproduct analysis is using the flight position for the mask-weighting calculation.
======================================================================
BAT GRB EVENT DATA PROCESSING REPORT
Process Script Ver: batgrbproduct v2.48
Process Start Time: Wed Jun 14 15:11:02 EDT 2023
Host Name: batproc1
Current Working Dir: /local/data/bat1/alien/Swift_3rdBATcatalog/event/batevent_reproc/trigger1156572
======================================================================
Trigger: 01156572 Segment: 000
BAT Trigger Time: 699256281.088 [s; MET]
Trigger Stop: 699256282.112 [s; MET]
UTC: 2023-02-28T05:50:50.250320 [includes UTCF correction]
Where From?: TDRSS position message
BAT
RA: 18.4033334147616 Dec: 44.4885974077295 [deg; J2000]
Catalogged Source?: NO
Point Source?: YES
GRB Indicated?: YES [ by BAT flight software ]
Image S/N Ratio: 11.96
Image Trigger?: NO
Rate S/N Ratio: 25.0399680510978 [ if not an image trigger ]
Image S/N Ratio: 11.96
Analysis Position: [ source = BAT ]
RA: 18.4033334147616 Dec: 44.4885974077295 [deg; J2000]
Refined Position: [ source = BAT pre-slew burst ]
RA: 18.3972021614032 Dec: 44.4951400827483 [deg; J2000]
{ 01h 13m 35.3s , +44d 29' 42.5" }
+/- 1.52845401109954 [arcmin] (estimated 90% radius based on SNR)
+/- 0.539801363901666 [arcmin] (formal 1-sigma fit error)
SNR: 16.5920749177262
Angular difference between the analysis and refined position is 0.472197 arcmin
Partial Coding Fraction: 0.7890625 [ including projection effects ]
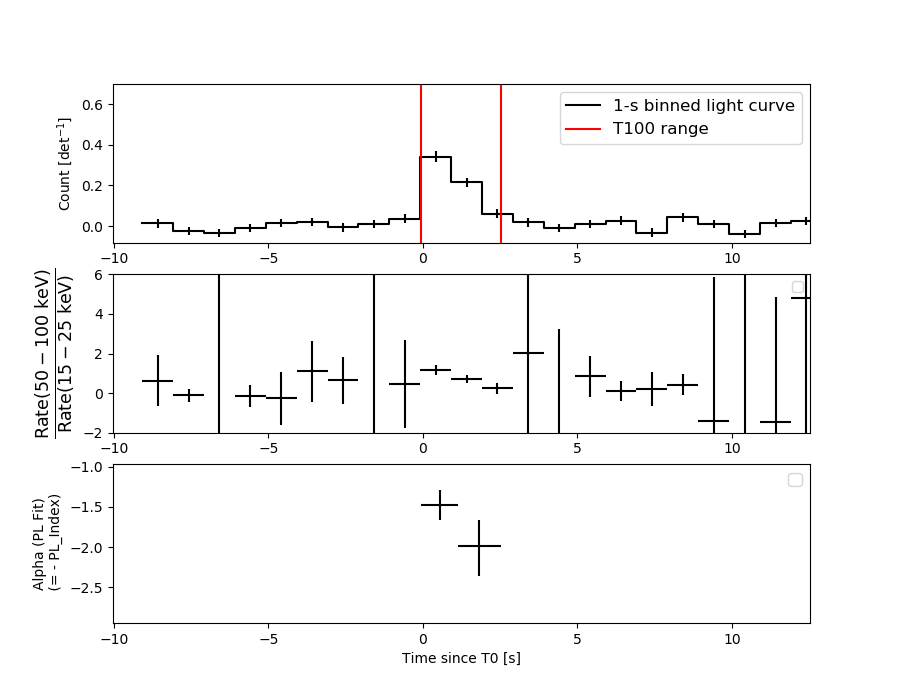
Duration
T90: 2.1839998960495 +/- 0.396080751971004
Measured from: 0.0759999752044678
to: 2.25999987125397 [s; relative to TRIGTIME]
T50: 0.935999989509583 +/- 0.274167776963183
Measured from: 0.48799991607666
to: 1.42399990558624 [s; relative to TRIGTIME]
Fluence
Peak Flux (peak 1 second)
Measured from: 0.175999999046326
to: 1.17599999904633 [s; relative to TRIGTIME]
Total Fluence
Measured from: -0.0480000972747803
to: 2.52799999713898 [s; relative to TRIGTIME]
Band 1 Band 2 Band 3 Band 4
15-25 25-50 50-100 100-350 keV
Total 0.185227 0.243741 0.163161 0.034179
0.020787 0.022164 0.019679 0.015222 [error]
Peak 0.088646 0.145998 0.120238 0.021618
0.013194 0.015200 0.014097 0.010303 [error]
[ fluence units of on-axis counts / fully illuminated detector ]
======================================================================
====== Table of the duration information =============================
Value tstart tstop
T100 2.576 -0.048 2.528
T90 2.184 0.076 2.260
T50 0.936 0.488 1.424
Peak 1.000 0.176 1.176
====== Spectral Analysis Summary =====================================
Model : spectral model: simple power-law (PL) and cutoff power-law (CPL)
Ph_index : photon index: E^{Ph_index}
Ph_90err : 90% error of the photon index
Epeak : Epeak in keV
Epeak_90err: 90% error of Epeak
Norm : normalization at 50 keV in both the PL model and CPL model
Nomr_90err : 90% error of the normalization
chi2 : Chi-Squared
dof : degree of freedo
=== Time-averaged spectral analysis ===
(Best model with acceptable fit: PL)
Model Ph_index Ph_90err_low Ph_90err_hi Epeak Epeak_90err_low Epeak_90err_hi Norm Nomr_90err_low Norm_90err_hi chi2 dof
PL -1.654 -0.173 0.168 - - - 1.55e-02 -1.73e-03 1.71e-03 52.760 57
CPL -0.868 -0.692 0.832 66.674 -15.865 125.302 4.13e-02 -2.35e-02 7.40e-02 48.910 56
=== 1-s peak spectral analysis ===
(Best model with acceptable fit: PL)
Model Ph_index Ph_90err_low Ph_90err_hi Epeak Epeak_90err_low Epeak_90err_hi Norm Nomr_90err_low Norm_90err_hi chi2 dof
PL -1.470 -0.188 0.183 - - - 2.49e-02 -2.99e-03 2.97e-03 49.840 57
CPL -0.483 -0.788 0.954 78.316 -18.345 101.485 7.79e-02 -4.60e-02 1.51e-01 45.100 56
=== Fluence/Peak Flux Summary ===
Model Band1 Band2 Band3 Band4 Band5 Total
15-25 25-50 50-100 100-350 15-150 15-350 keV
Fluence PL 5.89e-08 9.85e-08 1.25e-07 3.19e-07 3.71e-07 6.01e-07 erg/cm2
90%_error_low -9.01e-09 -1.02e-08 -1.82e-08 -8.47e-08 -4.36e-08 -1.04e-07 erg/cm2
90%_error_hi 9.29e-09 1.02e-08 1.82e-08 1.02e-07 4.40e-08 1.18e-07 erg/cm2
Peak flux PL 9.94e-01 1.02e+00 7.35e-01 8.50e-01 3.08e+00 3.60e+00 ph/cm2/s
90%_error_low -1.79e-01 -1.23e-01 -1.09e-01 -2.25e-01 -3.58e-01 -4.28e-01 ph/cm2/s
90%_error_hi 1.88e-01 1.23e-01 1.08e-01 2.65e-01 3.59e-01 4.32e-01 ph/cm2/s
Fluence CPL 5.36e-08 1.09e-07 1.28e-07 1.04e-07 3.50e-07 3.95e-07 erg/cm2
90%_error_low -1.03e-08 -1.35e-08 -2.08e-08 N/A -4.72e-08 -7.91e-08 erg/cm2
90%_error_hi 1.04e-08 1.41e-08 2.06e-08 N/A 4.80e-08 1.69e-07 erg/cm2
Peak flux CPL 8.34e-01 1.12e+00 8.11e-01 3.48e-01 3.00e+00 3.12e+00 ph/cm2/s
90%_error_low -2.15e-01 -1.52e-01 -1.30e-01 -1.81e-01 -3.64e-01 -4.15e-01 ph/cm2/s
90%_error_hi 2.24e-01 1.58e-01 1.34e-01 3.60e-01 3.64e-01 4.74e-01 ph/cm2/s
======================================================================
Image
Pre-slew 15.0-350.0 keV image (Event data)
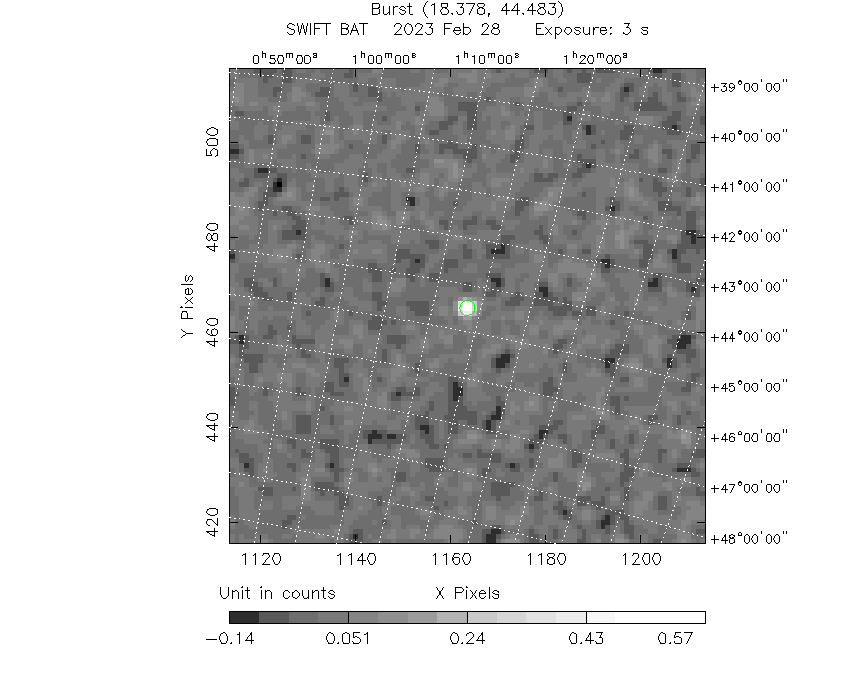
#   RAcent    DECcent   POSerr    Theta     Phi              Peak Cts       SNR   Name
   18.3972    44.4951   0.0116    30.8274   177.6719         0.6510766     16.592 TRIG_01156572

Foreground time interval of the image:
 -0.048   2.528 (delta_t =   2.576 [sec])
Background time interval of the image:
-214.187  -0.048 (delta_t = 214.139 [sec])
Light Curves
Note: The mask-weighted lightcurves have units of either count/det or counts/sec/det, where a det is 0.4 x 0.4 = 0.16 sq cm.
Full-time range; 1 s binning
Other quick-look light curves:
- 64 ms binning (zoomed)
- 16 ms binning (zoomed)
- 8 ms binning (zoomed)
- 2 ms binning (zoomed)
- SN=5 or 10 s binning (full-time range)
- Raw light curve
Spectra
- 64 ms binning (zoomed)
- 16 ms binning (zoomed)
- 8 ms binning (zoomed)
- 2 ms binning (zoomed)
- SN=5 or 10 s binning (full-time range)
- Raw light curve
Spectra
Notes:
- 1) The fitting includes the systematic errors.
- 2) When the burst includes telescope slew time periods, the fitting uses an average response file made from multiple 5-s response files through out the slew time plus single time preiod for the non-slew times, and weighted by the total counts in the corresponding time period using addrmf. An average response file is needed becuase a spectral fit using the pre-slew DRM will introduce some errors in both a spectral shape and a normalization if the PHA file contains a lot of the slew/post-slew time interval.
- 3) For fits to more complicated models (e.g. a power-law over a cutoff power-law), the BAT team has decided to require a chi-square improvement of more than 6 for each extra dof.
Time averaged spectrum fit using the average DRM
Power-law model
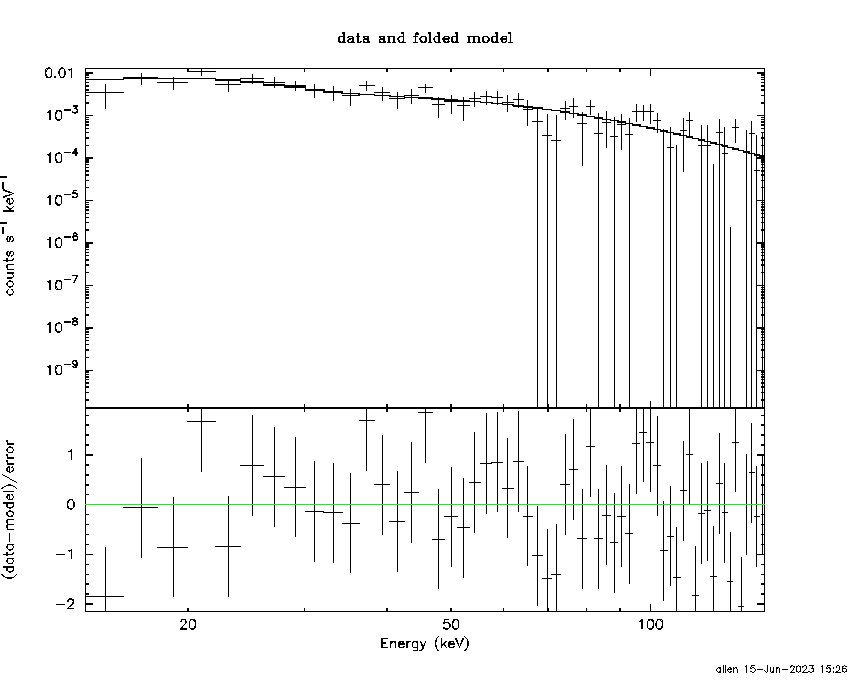
Time interval is from   -0.048 sec. to    2.528 sec.

Spectral model in power-law:
------------------------------------------------------------
Parameters  : value       lower 90%   higher 90%
Photon index: -1.65393     ( -0.172721   0.168114 )
Norm@50keV  : 1.54891E-02    ( -0.00172643   0.00170713 )
------------------------------------------------------------
#Fit statistic  : Chi-Squared                   52.76     using 59 bins.
 Reduced chi-squared = 0.925614
# Null hypothesis probability of 6.35e-01 with 57 degrees of freedom

Photon flux (15-150 keV)    in 2.576 sec: 2.02520 ( -0.20911  0.20921 ) ph/cm2/s
Energy fluence (15-150 keV)             : 3.70993e-07 ( -4.35725e-08  4.40432e-08 ) ergs/cm2
Cutoff power-law model
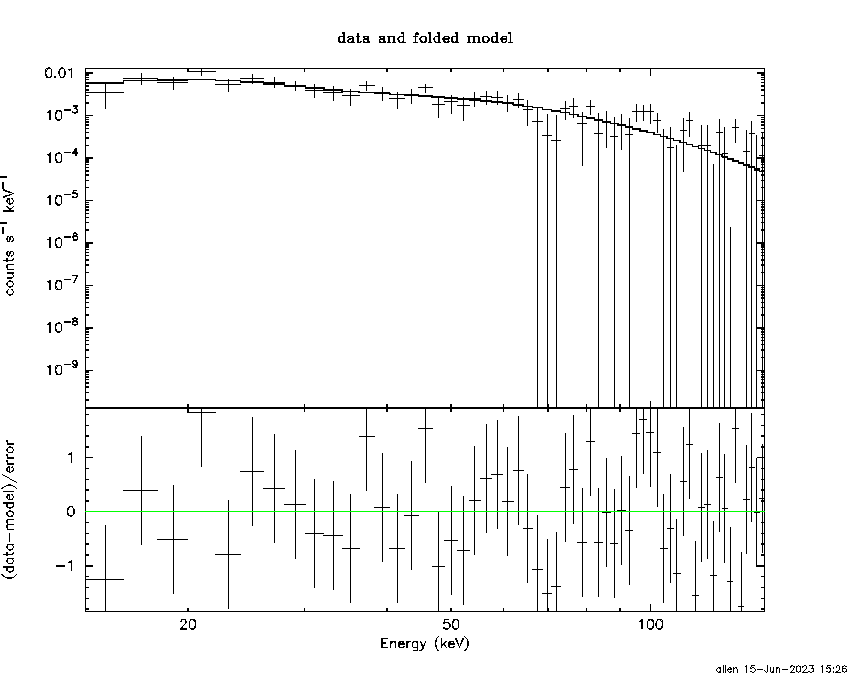
Time interval is from   -0.048 sec. to    2.528 sec.
Spectral model in the cutoff power-law:
------------------------------------------------------------
Parameters  : value       lower 90%   higher 90%
Photon index: -0.867736     ( -0.691617   0.831939 )
Epeak [keV] : 66.6738      ( -15.8647 125.303 )
Norm@50keV  : 4.12526E-02    ( -0.0234598   0.0740318 )
------------------------------------------------------------
#Fit statistic  : Chi-Squared                   48.91     using 59 bins.
 Reduced chi-squared = 0.873393
# Null hypothesis probability of 7.38e-01 with 56 degrees of freedom

Photon flux (15-150 keV)    in 2.576 sec: 1.97928 ( -0.21333  0.21326 ) ph/cm2/s
Energy fluence (15-150 keV)             : 3.49579e-07 ( -4.72037e-08  4.79752e-08 ) ergs/cm2
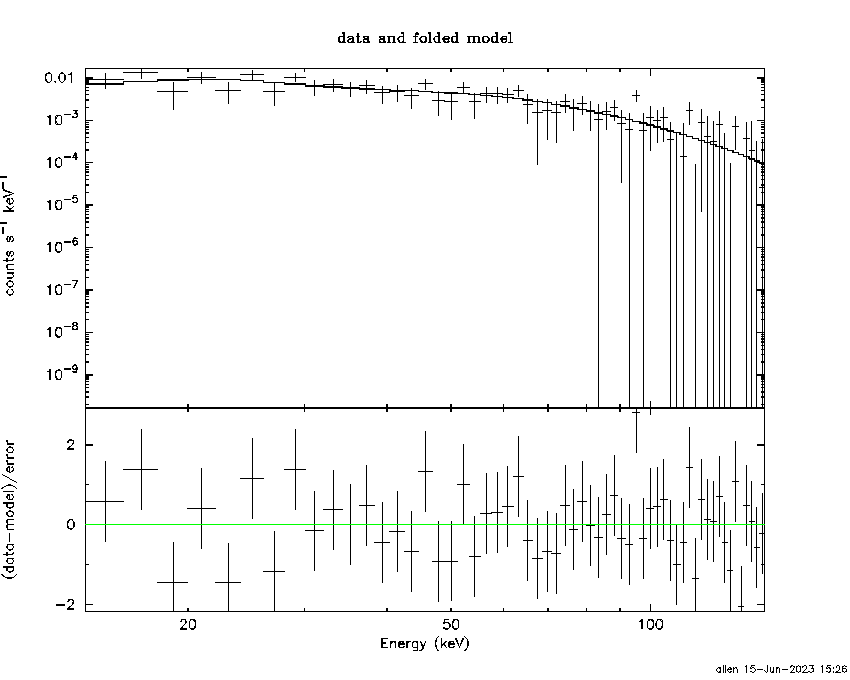
1-s peak spectrum fit
Power-law model

Time interval is from    0.176 sec. to    1.176 sec.

Spectral model in power-law:
------------------------------------------------------------
Parameters  : value       lower 90%   higher 90%
Photon index: -1.47     ( -0.188163   0.182999 )
Norm@50keV  : 2.48570E-02    ( -0.00298944   0.00296857 )
------------------------------------------------------------
#Fit statistic  : Chi-Squared                   49.84     using 59 bins.
 Reduced chi-squared = 0.874386
# Null hypothesis probability of 7.38e-01 with 57 degrees of freedom

Photon flux (15-150 keV)    in 1 sec: 3.07884 ( -0.35834  0.35851 ) ph/cm2/s
Energy fluence (15-150 keV)             : 2.37039e-07 ( -3.11705e-08  3.1446e-08 ) ergs/cm2
Cutoff power-law model
Time interval is from    0.176 sec. to    1.176 sec.
Spectral model in the cutoff power-law:
------------------------------------------------------------
Parameters  : value       lower 90%   higher 90%
Photon index: -0.483109     ( -0.787821   0.953529 )
Epeak [keV] : 78.3164      ( -18.3445 101.485 )
Norm@50keV  : 7.79032E-02    ( -0.0459525   0.151225 )
------------------------------------------------------------
#Fit statistic  : Chi-Squared                   45.10     using 59 bins.
 Reduced chi-squared = 0.805357
# Null hypothesis probability of 8.51e-01 with 56 degrees of freedom

Photon flux (15-150 keV)    in 1 sec: 3.00387 ( -0.36417  0.36407 ) ph/cm2/s
Energy fluence (15-150 keV)             : 2.26642e-07 ( -3.25311e-08  3.28895e-08 ) ergs/cm2
Time-resolved spectra
Distribution
T90 vs. Hardness ratio plot
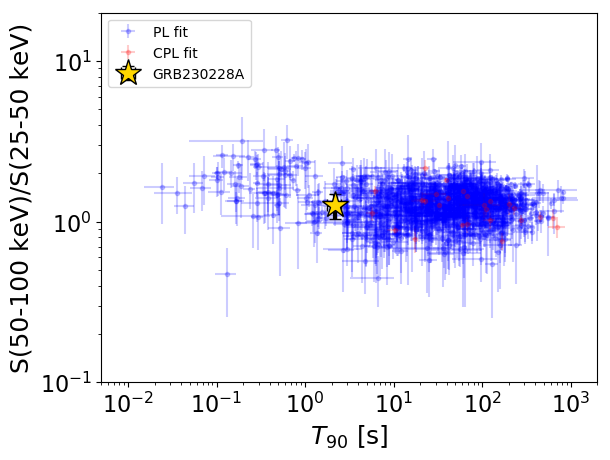
T90                                   = 2.184 sec.
Hardness ratio (energy fluence ratio) = 1.27113066804
S(15-50 keV) vs. S(50-150 keV) plot
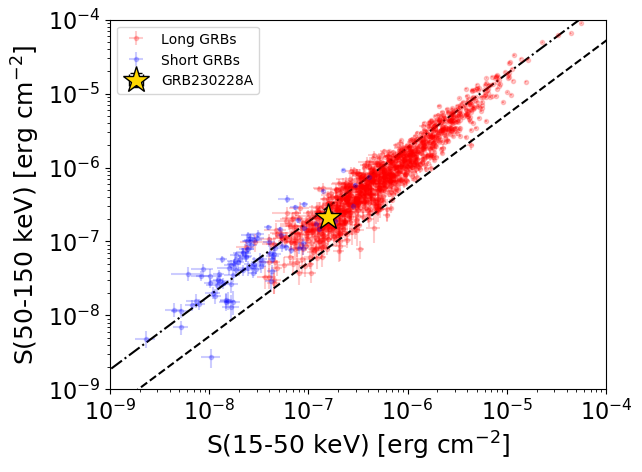
S(15-50 keV)  = 1.5736876e-07
S(50-150 keV) = 2.136248e-07
The dash-dotted line and the dashed line traces the fluences calculated from the Band function with Epeak = 15 and 150 keV, respectively. Both lines assume a canonical values of alpha = -1 and beta = -2.5.
Mask shadow pattern
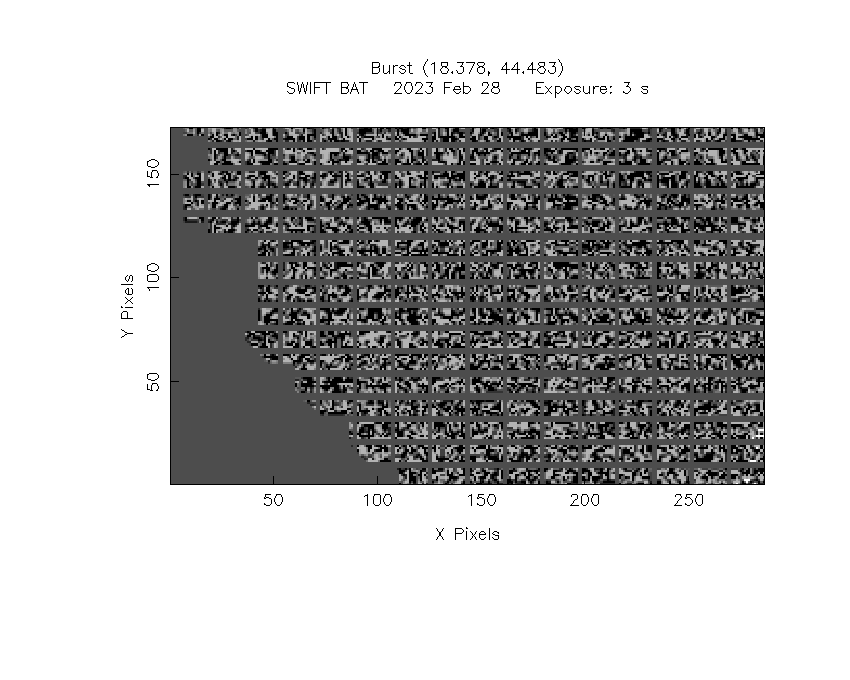
IMX = -5.962746286243424E-01, IMY = -2.424163367299306E-02
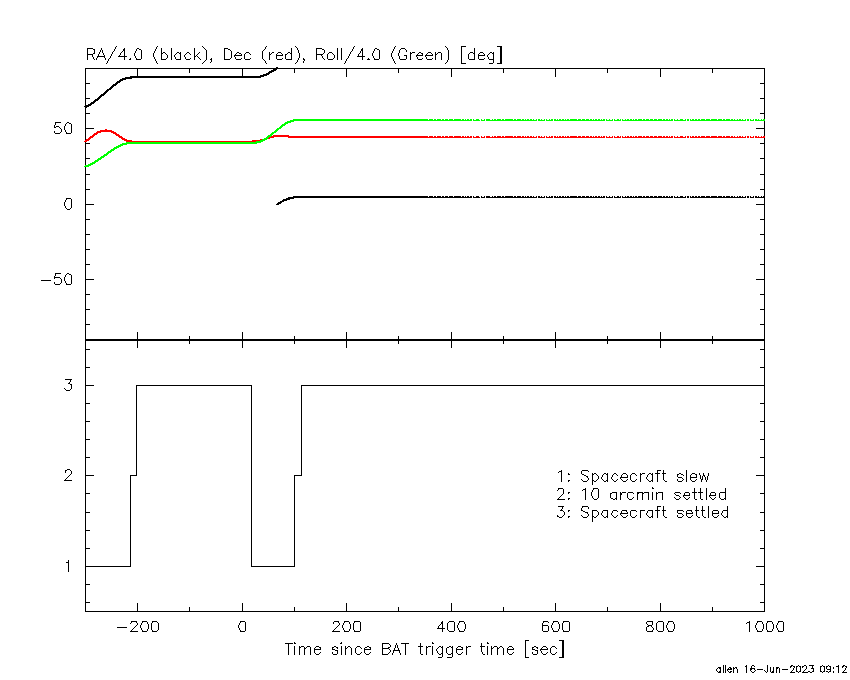
Spacecraft aspect plot
Bright source in the pre-burst/pre-slew/post-slew images
Pre-burst image of 15-350 keV band
Time interval of the image:
-214.187400 -0.048000

# RAcent  DECcent POSerr Theta    Phi  PeakCts   SNR AngSep     Name
#  [deg]    [deg]    ['] [deg]  [deg]                   [']
288.7174  11.0035    5.7  51.3   -4.8   1.5448   2.0    5.9	GRS 1915+105
299.5871  35.1973    1.2  29.0   17.2   5.2247   9.8    0.3	Cyg X-1
308.0886  40.9071    2.2  20.9   25.4   2.5386   5.3    2.9	Cyg X-3
326.2883  38.4052    6.7   8.0   -1.9   0.7682   1.7    7.4	Cyg X-2
 20.7909  80.2495    2.6  42.0  118.0  10.5999   4.4 ------	UNKNOWN
 45.6332  42.5021    2.5  50.2  171.8   9.2835   4.6 ------	UNKNOWN
Pre-slew background subtracted image of 15-350 keV band
Time interval of the image:
-0.048000 2.528000

# RAcent  DECcent POSerr Theta    Phi  PeakCts   SNR AngSep     Name
#  [deg]    [deg]    ['] [deg]  [deg]                   [']
288.8718  10.8819    5.0  51.3   -5.0   0.1682   2.3    5.8	GRS 1915+105
299.6616  35.2549    6.5  28.9   17.3  -0.0661  -1.8    4.7	Cyg X-1
308.0131  40.8044    4.0  21.0   25.1   0.0964   2.9    9.9	Cyg X-3
326.2410  38.3085   55.4   8.1   -2.4  -0.0065  -0.2    3.4	Cyg X-2
282.4632  62.9132    2.7  37.5   70.8   0.3287   4.2 ------	UNKNOWN
 23.5939  65.7652    2.1  35.8  139.0   0.2809   5.6 ------	UNKNOWN
 18.3972  44.4951    0.7  30.8  177.7   0.6511  16.6 ------	UNKNOWN
 28.9192  23.1839    1.8  47.5 -156.6   0.4692   6.3 ------	UNKNOWN
Post-slew image of 15-350 keV band
Time interval of the image:
101.012600 718.025300
720.912000 963.092000

# RAcent  DECcent POSerr Theta    Phi  PeakCts   SNR AngSep     Name
#  [deg]    [deg]    ['] [deg]  [deg]                   [']
299.6386  35.1960    3.0  58.8  -22.1  24.6103   3.9    2.4	Cyg X-1
308.0929  40.9751    4.6  50.1  -20.4   8.5108   2.5    1.6	Cyg X-3
326.0281  38.2912    3.6  39.1  -32.9  -6.5717  -3.2    7.0	Cyg X-2
259.9392  78.6988    5.4  51.6   34.7  11.6780   2.2 ------	UNKNOWN
 70.2844  44.5398    1.3  36.3  118.5  33.8950   8.7 ------	UNKNOWN
 63.6954  63.5508    2.8  31.7   84.5  11.8263   4.2 ------	UNKNOWN
298.0442  41.6223    2.7  56.3  -15.0  18.1296   4.3 ------	UNKNOWN
 28.6123   3.3947    5.5  42.1 -147.9   5.0967   2.1 ------	UNKNOWN
 25.2331  -1.6733    2.2  46.6 -142.0  16.5527   5.2 ------	UNKNOWN