Analysis Summary
Notes:
- 1) No attempt has been made to eliminate the non-significant decimal places.
- 2) This batgrbproduct analysis is done using the HEASARC data.
- 3) This batgrbproduct analysis is using the flight position for the mask-weighting calculation.
======================================================================
                  BAT GRB EVENT DATA PROCESSING REPORT
    Process Script Ver: batgrbproduct v2.48
    Process Start Time: Wed Jun 14 15:09:44 EDT 2023
             Host Name: batproc1
   Current Working Dir: /local/data/bat1/alien/Swift_3rdBATcatalog/event/batevent_reproc/trigger1161127
======================================================================

  Trigger: 01161127      Segment: 000

  BAT Trigger Time: 701212268.864   [s; MET]
      Trigger Stop: 701212269.888   [s; MET]
               UTC: 2023-03-22T21:10:37.893100    [includes UTCF correction]
       Where From?: TDRSS position message

  BAT
    RA: 16.5654750906929   Dec: -47.7287211073544  [deg; J2000]

     Catalogged Source?: NO
     Point Source?:      YES
     GRB Indicated?:     YES    [ by BAT flight software ]
     Image S/N Ratio:    9
     Image Trigger?:     NO
     Rate S/N Ratio:     11.6189500386223  [ if not an image trigger ]
     Image S/N Ratio:    9

  Analysis Position:   [ source = BAT ]
    RA: 16.5654750906929   Dec: -47.7287211073544  [deg; J2000]

  Refined Position:   [ source = BAT pre-slew burst ]
    RA: 16.5534535346927   Dec: -47.7114460390152  [deg; J2000]
        { 01h 06m 12.8s , -47d 42' 41.2" }
         +/- 1.70920067666722 [arcmin] (estimated 90% radius based on SNR)
         +/- 0.592656105743296 [arcmin] (formal 1-sigma fit error)
    SNR: 14.1434992348981

  Angular difference between the analysis and refined position is 1.144470 arcmin

  Partial Coding Fraction: 0.921875    [ including projection effects ]

  Duration
     T90: 11.7999999523163 +/- 2.29129222285299
        Measured from: -2.25199997425079
                   to: 9.54799997806549     [s; relative to TRIGTIME]
     T50: 5.23599994182587 +/- 1.7227792020921
        Measured from: -0.851999998092651
                   to: 4.38399994373322     [s; relative to TRIGTIME]


  Fluence
     Peak Flux  (peak 1 second)
        Measured from: 0.0199999809265137
                   to: 1.01999998092651     [s; relative to TRIGTIME]
     Total Fluence
        Measured from: -3.07199990749359
                   to: 11.3200000524521     [s; relative to TRIGTIME]

             Band 1     Band 2     Band 3     Band 4
              15-25      25-50     50-100    100-350     keV
 Total     0.309115   0.275266   0.136267   0.034166
           0.030832   0.031452   0.026602   0.023834 [error]
 Peak      0.052799   0.051388   0.019281   0.003892
           0.008651   0.008876   0.007411   0.006022 [error]

     [ fluence units of on-axis counts / fully illuminated detector ]

======================================================================


====== Table of the duration information =============================

        Value   tstart    tstop
T100   14.392   -3.072   11.320
T90    11.800   -2.252    9.548
T50     5.236   -0.852    4.384
Peak    1.000    0.020    1.020


====== Spectral Analysis Summary =====================================

Model      : spectral model: simple power-law (PL) and cutoff power-law (CPL)
Ph_index   : photon index: E^{Ph_index}
Ph_90err   : 90% error of the photon index
Epeak      : Epeak in keV
Epeak_90err: 90% error of Epeak
Norm       : normalization at 50 keV in both the PL model and CPL model
Nomr_90err : 90% error of the normalization
chi2       : Chi-Squared
dof        : degree of freedo

=== Time-averaged spectral analysis ===
(Best model with acceptable fit: PL)

Model Ph_index Ph_90err_low Ph_90err_hi  Epeak  Epeak_90err_low  Epeak_90err_hi  Norm       Nomr_90err_low    Norm_90err_hi    chi2    dof
PL      -2.103    -0.273      0.251       -           -               -         2.83e-03     -4.95e-04          4.75e-04      49.320   57
CPL     -1.994    -0.026      0.513        4.849      N/A           N/A         3.11e-03        N/A               N/A         49.670   56


=== 1-s peak spectral analysis ===
(Best model with acceptable fit: N/A)

Model Ph_index Ph_90err_low Ph_90err_hi  Epeak  Epeak_90err_low  Epeak_90err_hi  Norm       Nomr_90err_low    Norm_90err_hi    chi2    dof
PL      -2.144     -0.389     0.340       -           -               -         6.64e-03     -1.80e-03          1.74e-03      73.460   57
CPL     -0.458     -1.547     2.248       36.759     -32.458        16.325      6.59e-02     -6.59e-02          1.32e+00      70.380   56


=== Fluence/Peak Flux Summary ===

              Model    Band1     Band2     Band3     Band4     Band5     Total
                       15-25     25-50    50-100    100-350    15-150    15-350    keV
Fluence         PL   9.19e-08  1.17e-07  1.09e-07  1.78e-07  3.78e-07  4.96e-07   erg/cm2
      90%_error_low -1.58e-08 -1.47e-08 -2.59e-08 -7.20e-08 -5.75e-08 -1.04e-07   erg/cm2
      90%_error_hi   1.62e-08  1.46e-08  2.68e-08  9.94e-08  5.92e-08  1.25e-07   erg/cm2
Peak flux       PL   5.09e-01  3.51e-01  1.59e-01  1.00e-01  1.07e+00  1.12e+00   ph/cm2/s
      90%_error_low -1.27e-01 -7.03e-02 -5.37e-02 -5.16e-02 -2.08e-01 -2.21e-01   ph/cm2/s
      90%_error_hi   1.32e-01  6.98e-02  5.63e-02  7.60e-02  2.08e-01  2.22e-01   ph/cm2/s

Fluence        CPL   8.92e-08  9.76e-08  1.06e-07  1.16e-07  3.83e-07  4.95e-07   erg/cm2
      90%_error_low -1.76e-08 -4.40e-08 -1.62e-08 -3.33e-08 -6.19e-08 -3.15e-07   erg/cm2
      90%_error_hi   1.75e-08  3.07e-08  2.97e-08  1.83e-07  6.40e-08  1.43e-07   erg/cm2
Peak flux      CPL   4.43e-01  4.24e-01  1.50e-01  1.58e-02  1.03e+00  1.03e+00   ph/cm2/s
      90%_error_low -1.54e-01 -9.92e-02 -6.66e-02 -1.58e-02 -2.08e-01 -2.09e-01   ph/cm2/s
      90%_error_hi   1.52e-01  1.03e-01  6.76e-02  8.11e-02  2.09e-01  2.13e-01   ph/cm2/s

======================================================================
Image
Pre-slew 15.0-350.0 keV image (Event data)
#   RAcent    DECcent   POSerr    Theta     Phi              Peak Cts       SNR   Name
   16.5535   -47.7114   0.0136    25.1025   -17.1819         0.8424297     14.143 TRIG_01161127

Foreground time interval of the image:
 -3.072  11.320 (delta_t =  14.392 [sec])
Background time interval of the image:
-239.864  -3.072 (delta_t = 236.792 [sec])
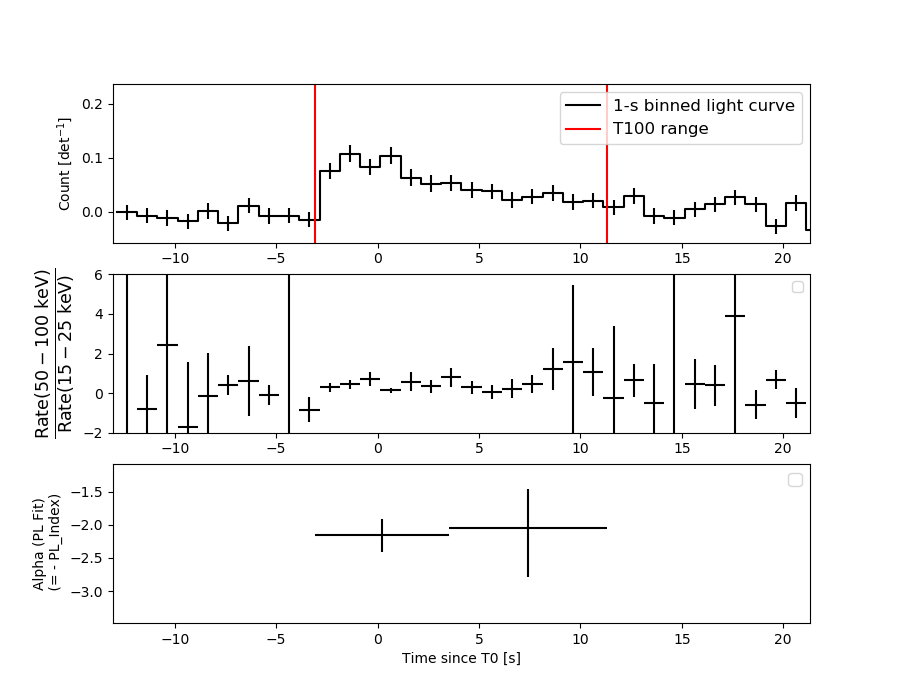
Light Curves
Note: The mask-weighted lightcurves have units of either count/det or counts/sec/det, where a det is 0.4 x 0.4 = 0.16 sq cm.
Full-time range; 1 s binning
Other quick-look light curves:
- 64 ms binning (zoomed)
- 16 ms binning (zoomed)
- 8 ms binning (zoomed)
- 2 ms binning (zoomed)
- SN=5 or 10 s binning (full-time range)
- Raw light curve
Spectra
- 64 ms binning (zoomed)
- 16 ms binning (zoomed)
- 8 ms binning (zoomed)
- 2 ms binning (zoomed)
- SN=5 or 10 s binning (full-time range)
- Raw light curve
Spectra
Notes:
- 1) The fitting includes the systematic errors.
- 2) When the burst includes telescope slew time periods, the fitting uses an average response file made from multiple 5-s response files through out the slew time plus single time preiod for the non-slew times, and weighted by the total counts in the corresponding time period using addrmf. An average response file is needed becuase a spectral fit using the pre-slew DRM will introduce some errors in both a spectral shape and a normalization if the PHA file contains a lot of the slew/post-slew time interval.
- 3) For fits to more complicated models (e.g. a power-law over a cutoff power-law), the BAT team has decided to require a chi-square improvement of more than 6 for each extra dof.
Time averaged spectrum fit using the average DRM
Power-law model
Time interval is from   -3.072 sec. to   11.320 sec.

Spectral model in power-law:
------------------------------------------------------------
Parameters  : value       lower 90%   higher 90%
Photon index: -2.10335     ( -0.272778   0.251012 )
Norm@50keV  : 2.82832E-03    ( -0.000495423   0.000475503 )
------------------------------------------------------------
#Fit statistic  : Chi-Squared                   49.32     using 59 bins.
 Reduced chi-squared = 0.865263
# Null hypothesis probability of 7.55e-01 with 57 degrees of freedom

Photon flux (15-150 keV)    in 14.39 sec: 0.445744 ( -0.054118  0.054129 ) ph/cm2/s
Energy fluence (15-150 keV)             : 3.7833e-07 ( -5.75256e-08  5.92429e-08 ) ergs/cm2
Cutoff power-law model
Time interval is from   -3.072 sec. to   11.320 sec.
Spectral model in the cutoff power-law:
------------------------------------------------------------
Parameters  : value       lower 90%   higher 90%
Photon index: -2.2217     ( -0.0260408   0.512639 )
Epeak [keV] : 94.7499      (   )
Norm@50keV  : 2.35289E-03    (     )
------------------------------------------------------------
#Fit statistic  : Chi-Squared                   48.76     using 59 bins.
 Reduced chi-squared = 0.870714
# Null hypothesis probability of 7.43e-01 with 56 degrees of freedom

Photon flux (15-150 keV)    in 14.39 sec: 0.392704 ( -0.11046  0.097471 ) ph/cm2/s
Energy fluence (15-150 keV)             : 3.8295e-07 ( -6.19454e-08  6.39818e-08 ) ergs/cm2
1-s peak spectrum fit
Power-law model
Time interval is from    0.020 sec. to    1.020 sec.

Spectral model in power-law:
------------------------------------------------------------
Parameters  : value       lower 90%   higher 90%
Photon index: -2.14401     ( -0.388553   0.339978 )
Norm@50keV  : 6.63864E-03    ( -0.00179891   0.00174122 )
------------------------------------------------------------
#Fit statistic  : Chi-Squared                   73.46     using 59 bins.
 Reduced chi-squared = 1.28877
# Null hypothesis probability of 7.01e-02 with 57 degrees of freedom

Photon flux (15-150 keV)    in 1 sec: 1.06780 ( -0.208043  0.20804 ) ph/cm2/s
Energy fluence (15-150 keV)             : 6.19812e-08 ( -1.45461e-08  1.51464e-08 ) ergs/cm2
Cutoff power-law model

Time interval is from    0.020 sec. to    1.020 sec.
Spectral model in the cutoff power-law:
------------------------------------------------------------
Parameters  : value       lower 90%   higher 90%
Photon index: -0.4576     ( -1.54763   2.24824 )
Epeak [keV] : 36.7594      ( -32.4586 16.3248 )
Norm@50keV  : 6.58539E-02    ( -0.0658794   1.31726 )
------------------------------------------------------------
#Fit statistic  : Chi-Squared                   70.38     using 59 bins.
 Reduced chi-squared = 1.25679
# Null hypothesis probability of 9.36e-02 with 56 degrees of freedom

Photon flux (15-150 keV)    in 1 sec: 1.03042 ( -0.208087  0.20947 ) ph/cm2/s
Energy fluence (15-150 keV)             : 5.57905e-08 ( -1.30066e-08  1.52474e-08 ) ergs/cm2
Time-resolved spectra
Distribution
T90 vs. Hardness ratio plot
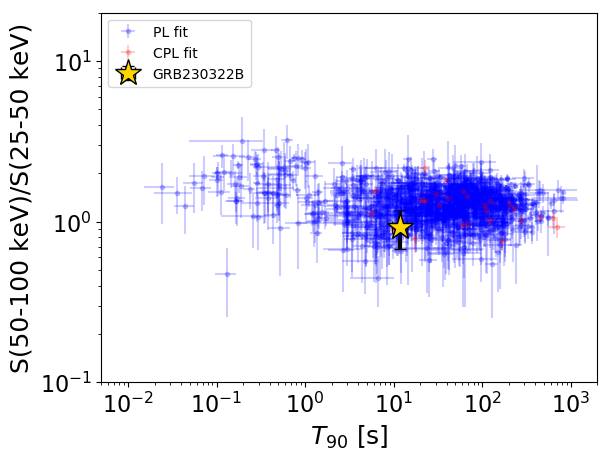
T90                                   = 11.8 sec.
Hardness ratio (energy fluence ratio) = 0.930872263799
S(15-50 keV) vs. S(50-150 keV) plot
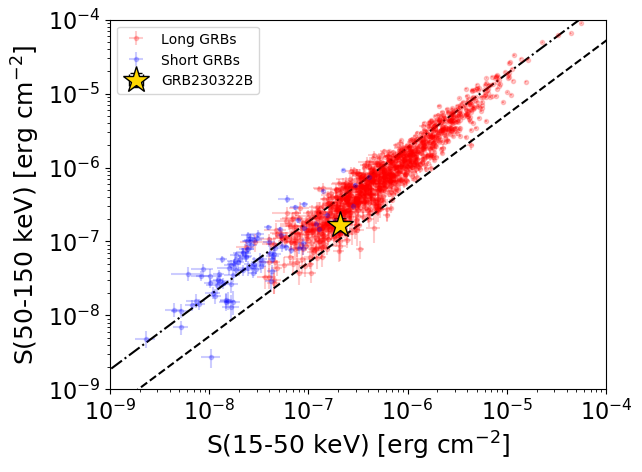
S(15-50 keV)  = 2.0902263e-07
S(50-150 keV) = 1.6930487e-07
The dash-dotted line and the dashed line traces the fluences calculated from the Band function with Epeak = 15 and 150 keV, respectively. Both lines assume a canonical values of alpha = -1 and beta = -2.5.
Mask shadow pattern
IMX = 4.475793670390039E-01, IMY = 1.383939603464624E-01
Spacecraft aspect plot
Bright source in the pre-burst/pre-slew/post-slew images
Pre-burst image of 15-350 keV band
Time interval of the image:
-239.864000 -3.072000

# RAcent  DECcent POSerr Theta    Phi  PeakCts   SNR AngSep     Name
#  [deg]    [deg]    ['] [deg]  [deg]                   [']
285.0974 -24.8729    6.0  48.5  146.1   4.4416   1.9    4.4	HT1900.1-2455
297.5562 -65.3667    2.2  31.6   84.6   3.3533   5.3 ------	UNKNOWN
352.8010  -5.6289    3.4  40.0 -109.0   3.9520   3.4  547.8	UNKNOWN
Pre-slew background subtracted image of 15-350 keV band
Time interval of the image:
-3.072000 11.320000

# RAcent  DECcent POSerr Theta    Phi  PeakCts   SNR AngSep     Name
#  [deg]    [deg]    ['] [deg]  [deg]                   [']
284.9192 -25.0299    3.7  48.5  145.8   0.7853   3.1    9.1	HT1900.1-2455
 16.5535 -47.7115    0.8  25.1  -17.2   0.8425  14.2 ------	UNKNOWN
Post-slew image of 15-350 keV band
Time interval of the image:
96.036590 962.270700

# RAcent  DECcent POSerr Theta    Phi  PeakCts   SNR AngSep     Name
#  [deg]    [deg]    ['] [deg]  [deg]                   [']
 61.5099 -71.7626    2.6  31.6   84.6   9.2889   4.4 ------	UNKNOWN
 54.7385  -5.6128    3.6  53.2  -20.3  10.0316   3.2 ------	UNKNOWN