Analysis Summary
Notes:
- 1) No attempt has been made to eliminate the non-significant decimal places.
- 2) This batgrbproduct analysis is done using the HEASARC data.
- 3) This batgrbproduct analysis is using the flight position for the mask-weighting calculation.
======================================================================
BAT GRB EVENT DATA PROCESSING REPORT
Process Script Ver: batgrbproduct v2.48
Process Start Time: Wed Jun 14 15:08:07 EDT 2023
Host Name: batproc1
Current Working Dir: /local/data/bat1/alien/Swift_3rdBATcatalog/event/batevent_reproc/trigger1161390
======================================================================
Trigger: 01161390 Segment: 000
BAT Trigger Time: 701406966.848 [s; MET]
Trigger Stop: 701406967.872 [s; MET]
UTC: 2023-03-25T03:15:35.863840 [includes UTCF correction]
Where From?: TDRSS position message
BAT
RA: 296.820236138275 Dec: -46.0941325282463 [deg; J2000]
Catalogged Source?: NO
Point Source?: YES
GRB Indicated?: YES [ by BAT flight software ]
Image S/N Ratio: 11.62
Image Trigger?: NO
Rate S/N Ratio: 29.086079144498 [ if not an image trigger ]
Image S/N Ratio: 11.62
Analysis Position: [ source = BAT ]
RA: 296.820236138275 Dec: -46.0941325282463 [deg; J2000]
Refined Position: [ source = BAT pre-slew burst ]
RA: 296.857024926155 Dec: -46.0707340759418 [deg; J2000]
{ 19h 47m 25.7s , -46d 04' 14.6" }
+/- 1.5568128472591 [arcmin] (estimated 90% radius based on SNR)
+/- 0.558808453447805 [arcmin] (formal 1-sigma fit error)
SNR: 16.1619940153994
Angular difference between the analysis and refined position is 2.077276 arcmin
Partial Coding Fraction: 0.4882812 [ including projection effects ]
Duration
T90: 38.2880001068115 +/- 11.3418334203591
Measured from: -7.22400009632111
to: 31.0640000104904 [s; relative to TRIGTIME]
T50: 6.04800009727478 +/- 7.18016826971619
Measured from: -0.168000102043152
to: 5.87999999523163 [s; relative to TRIGTIME]
Fluence
Peak Flux (peak 1 second)
Measured from: -0.0680000782012939
to: 0.931999921798706 [s; relative to TRIGTIME]
Total Fluence
Measured from: -8.55200004577637
to: 41.7039999961853 [s; relative to TRIGTIME]
Band 1 Band 2 Band 3 Band 4
15-25 25-50 50-100 100-350 keV
Total 0.736410 0.905709 0.570368 0.101465
0.076035 0.077711 0.067597 0.058154 [error]
Peak 0.100025 0.146943 0.144738 0.031913
0.013842 0.015027 0.014572 0.009694 [error]
[ fluence units of on-axis counts / fully illuminated detector ]
======================================================================
====== Table of the duration information =============================
Value tstart tstop
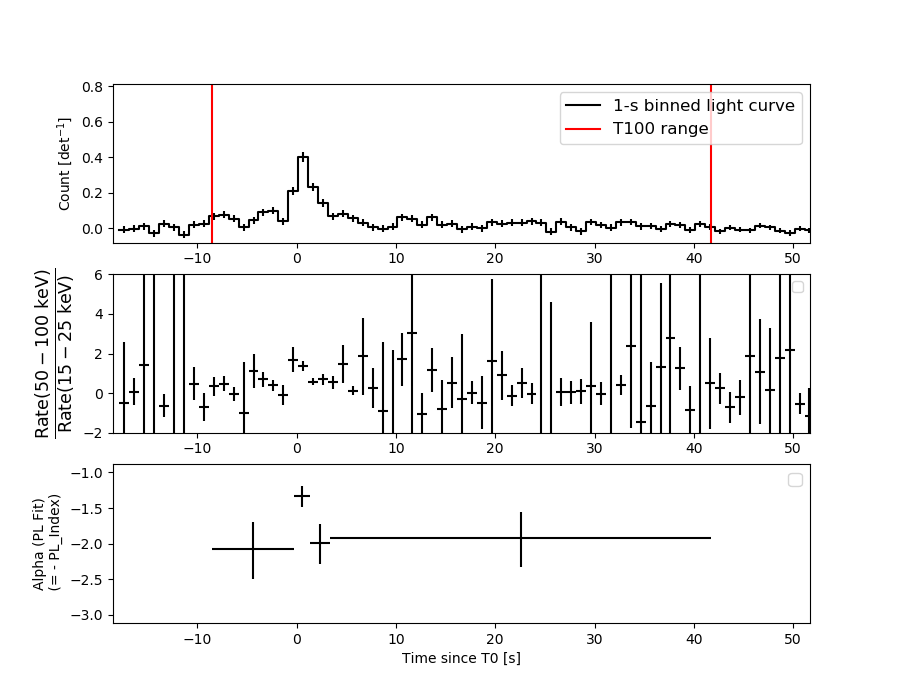
T100 50.256 -8.552 41.704
T90 38.288 -7.224 31.064
T50 6.048 -0.168 5.880
Peak 1.000 -0.068 0.932
====== Spectral Analysis Summary =====================================
Model : spectral model: simple power-law (PL) and cutoff power-law (CPL)
Ph_index : photon index: E^{Ph_index}
Ph_90err : 90% error of the photon index
Epeak : Epeak in keV
Epeak_90err: 90% error of Epeak
Norm : normalization at 50 keV in both the PL model and CPL model
Nomr_90err : 90% error of the normalization
chi2 : Chi-Squared
dof : degree of freedo
=== Time-averaged spectral analysis ===
(Best model with acceptable fit: PL)
Model Ph_index Ph_90err_low Ph_90err_hi Epeak Epeak_90err_low Epeak_90err_hi Norm Nomr_90err_low Norm_90err_hi chi2 dof
PL -1.813 -0.185 0.178 - - - 2.84e-03 -3.25e-04 3.19e-04 43.720 57
CPL -1.405 -0.670 0.742 67.022 -19.647 -67.022 4.72e-03 -1.86e-03 6.97e-03 42.570 56
=== 1-s peak spectral analysis ===
(Best model with acceptable fit: PL)
Model Ph_index Ph_90err_low Ph_90err_hi Epeak Epeak_90err_low Epeak_90err_hi Norm Nomr_90err_low Norm_90err_hi chi2 dof
PL -1.319 -0.177 0.176 - - - 2.77e-02 -2.97e-03 2.96e-03 56.720 57
CPL -0.861 -0.543 0.786 136.821 -55.761 -136.821 4.56e-02 -1.98e-02 5.81e-02 55.420 56
=== Fluence/Peak Flux Summary ===
Model Band1 Band2 Band3 Band4 Band5 Total
15-25 25-50 50-100 100-350 15-150 15-350 keV
Fluence PL 2.45e-07 3.72e-07 4.23e-07 9.18e-07 1.31e-06 1.96e-06 erg/cm2
90%_error_low -3.61e-08 -3.64e-08 -6.54e-08 -2.60e-07 -1.51e-07 -3.30e-07 erg/cm2
90%_error_hi 3.73e-08 3.64e-08 6.58e-08 3.21e-07 1.53e-07 3.78e-07 erg/cm2
Peak flux PL 9.59e-01 1.07e+00 8.62e-01 1.15e+00 3.32e+00 4.04e+00 ph/cm2/s
90%_error_low -1.77e-01 -1.29e-01 -1.10e-01 -2.74e-01 -3.62e-01 -4.45e-01 ph/cm2/s
90%_error_hi 1.87e-01 1.27e-01 1.09e-01 3.18e-01 3.62e-01 4.49e-01 ph/cm2/s
Fluence CPL 2.32e-07 3.89e-07 4.26e-07 4.81e-07 1.27e-06 1.53e-06 erg/cm2
90%_error_low -4.16e-08 -3.82e-08 -6.99e-08 -2.96e-07 -1.65e-07 -3.48e-07 erg/cm2
90%_error_hi 4.19e-08 4.71e-08 7.02e-08 5.30e-07 1.68e-07 5.80e-07 erg/cm2
Peak flux CPL 8.67e-01 1.12e+00 9.13e-01 7.44e-01 3.27e+00 3.64e+00 ph/cm2/s
90%_error_low -2.19e-01 -1.44e-01 -1.33e-01 -3.49e-01 -3.69e-01 -5.28e-01 ph/cm2/s
90%_error_hi 2.28e-01 1.48e-01 1.38e-01 5.18e-01 3.68e-01 6.74e-01 ph/cm2/s
======================================================================
Image
Pre-slew 15.0-350.0 keV image (Event data)
#   RAcent    DECcent   POSerr    Theta     Phi              Peak Cts       SNR   Name
  296.8570   -46.0707   0.0119    30.2234   108.6637         1.8526862     16.162 TRIG_01161390

Foreground time interval of the image:
 -8.552  15.053 (delta_t =  23.605 [sec])
Background time interval of the image:
-239.848  -8.552 (delta_t = 231.296 [sec])
Light Curves
Note: The mask-weighted lightcurves have units of either count/det or counts/sec/det, where a det is 0.4 x 0.4 = 0.16 sq cm.
Full-time range; 1 s binning
Other quick-look light curves:
- 64 ms binning (zoomed)
- 16 ms binning (zoomed)
- 8 ms binning (zoomed)
- 2 ms binning (zoomed)
- SN=5 or 10 s binning (full-time range)
- Raw light curve
Spectra
- 64 ms binning (zoomed)
- 16 ms binning (zoomed)
- 8 ms binning (zoomed)
- 2 ms binning (zoomed)
- SN=5 or 10 s binning (full-time range)
- Raw light curve
Spectra
Notes:
- 1) The fitting includes the systematic errors.
- 2) When the burst includes telescope slew time periods, the fitting uses an average response file made from multiple 5-s response files through out the slew time plus single time preiod for the non-slew times, and weighted by the total counts in the corresponding time period using addrmf. An average response file is needed becuase a spectral fit using the pre-slew DRM will introduce some errors in both a spectral shape and a normalization if the PHA file contains a lot of the slew/post-slew time interval.
- 3) For fits to more complicated models (e.g. a power-law over a cutoff power-law), the BAT team has decided to require a chi-square improvement of more than 6 for each extra dof.
Time averaged spectrum fit using the average DRM
Power-law model
Time interval is from   -8.552 sec. to   41.704 sec.

Spectral model in power-law:
------------------------------------------------------------
Parameters  : value       lower 90%   higher 90%
Photon index: -1.81321     ( -0.184893   0.177818 )
Norm@50keV  : 2.83835E-03    ( -0.000324843   0.000318725 )
------------------------------------------------------------
#Fit statistic  : Chi-Squared                   43.72     using 59 bins.
 Reduced chi-squared = 0.767018
# Null hypothesis probability of 9.02e-01 with 57 degrees of freedom

Photon flux (15-150 keV)    in 50.26 sec: 0.393161 ( -0.038906  0.038932 ) ph/cm2/s
Energy fluence (15-150 keV)             : 1.31293e-06 ( -1.51102e-07  1.53401e-07 ) ergs/cm2
Cutoff power-law model
Time interval is from   -8.552 sec. to   41.704 sec.
Spectral model in the cutoff power-law:
------------------------------------------------------------
Parameters  : value       lower 90%   higher 90%
Photon index: -1.40523     ( -0.669905   0.742023 )
Epeak [keV] : 67.0219      ( -19.6458 -67.0203 )
Norm@50keV  : 4.71607E-03    ( -0.00186206   0.00696988 )
------------------------------------------------------------
#Fit statistic  : Chi-Squared                   42.57     using 59 bins.
 Reduced chi-squared = 0.760179
# Null hypothesis probability of 9.07e-01 with 56 degrees of freedom

Photon flux (15-150 keV)    in 50.26 sec: 0.386332 ( -0.040362  0.040349 ) ph/cm2/s
Energy fluence (15-150 keV)             : 1.26804e-06 ( -1.64793e-07  1.68119e-07 ) ergs/cm2
1-s peak spectrum fit
Power-law model
Time interval is from   -0.068 sec. to    0.932 sec.

Spectral model in power-law:
------------------------------------------------------------
Parameters  : value       lower 90%   higher 90%
Photon index: -1.3188     ( -0.177109   0.175747 )
Norm@50keV  : 2.77147E-02    ( -0.00297003   0.00296409 )
------------------------------------------------------------
#Fit statistic  : Chi-Squared                   56.72     using 59 bins.
 Reduced chi-squared = 0.995088
# Null hypothesis probability of 4.85e-01 with 57 degrees of freedom

Photon flux (15-150 keV)    in 1 sec: 3.31820 ( -0.36172  0.36214 ) ph/cm2/s
Energy fluence (15-150 keV)             : 2.72672e-07 ( -3.21914e-08  3.23422e-08 ) ergs/cm2
Cutoff power-law model
Time interval is from   -0.068 sec. to    0.932 sec.
Spectral model in the cutoff power-law:
------------------------------------------------------------
Parameters  : value       lower 90%   higher 90%
Photon index: -0.861265     ( -0.543093   0.786155 )
Epeak [keV] : 136.821      ( -55.76 -136.82 )
Norm@50keV  : 4.55892E-02    ( -0.0198296   0.0580951 )
------------------------------------------------------------
#Fit statistic  : Chi-Squared                   55.42     using 59 bins.
 Reduced chi-squared = 0.989643
# Null hypothesis probability of 4.97e-01 with 56 degrees of freedom

Photon flux (15-150 keV)    in 1 sec: 3.27346 ( -0.36879  0.36841 ) ph/cm2/s
Energy fluence (15-150 keV)             : 1.05604e-07 ( -3.64082e-08  3.28578e-08 ) ergs/cm2
Time-resolved spectra
Distribution
T90 vs. Hardness ratio plot
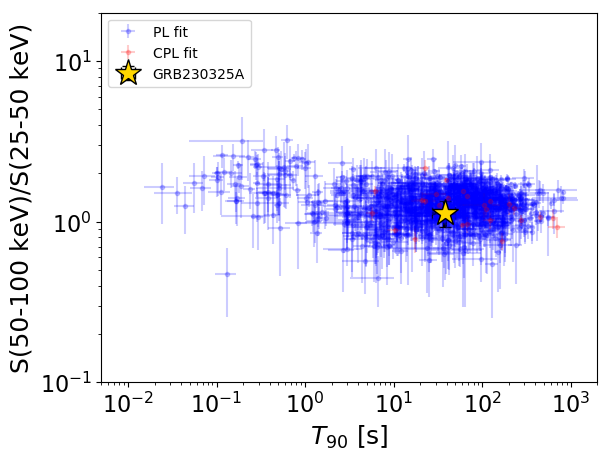
T90                                   = 38.288 sec.
Hardness ratio (energy fluence ratio) = 1.13825618144
S(15-50 keV) vs. S(50-150 keV) plot
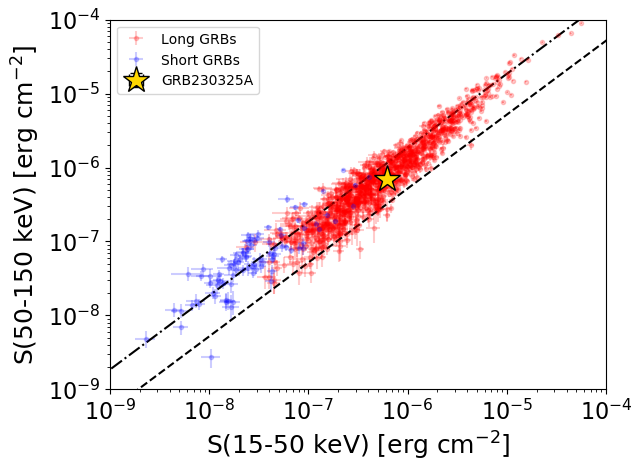
S(15-50 keV)  = 6.161121e-07
S(50-150 keV) = 6.968228e-07
The dash-dotted line and the dashed line traces the fluences calculated from the Band function with Epeak = 15 and 150 keV, respectively. Both lines assume a canonical values of alpha = -1 and beta = -2.5.
Mask shadow pattern
IMX = -1.864270239209484E-01, IMY = -5.519256895322276E-01
Spacecraft aspect plot
Bright source in the pre-burst/pre-slew/post-slew images
Pre-burst image of 15-350 keV band
Time interval of the image:
-239.848000 -8.552000

# RAcent  DECcent POSerr Theta    Phi  PeakCts   SNR AngSep     Name
#  [deg]    [deg]    ['] [deg]  [deg]                   [']
285.1672 -24.7972    7.9  46.1  136.8   2.7676   1.5   10.3	HT1900.1-2455
334.2822 -49.5677    2.5  10.1   57.0   1.5468   4.6 ------	UNKNOWN
357.1847  -5.5316    3.4  38.5 -103.4   3.6562   3.4  372.3	UNKNOWN
Pre-slew background subtracted image of 15-350 keV band
Time interval of the image:
-8.552000 15.052600

# RAcent  DECcent POSerr Theta    Phi  PeakCts   SNR AngSep     Name
#  [deg]    [deg]    ['] [deg]  [deg]                   [']
285.0409 -24.8904   32.1  46.2  136.6  -0.1263  -0.4    1.8	HT1900.1-2455
296.8571 -46.0707    0.7  30.2  108.7   1.8522  16.2 ------	UNKNOWN
 60.7702 -62.7785    2.7  52.3    9.4   0.9134   4.3 ------	UNKNOWN
 45.2796 -32.4049    2.1  53.8  -30.8   2.4946   5.6 ------	UNKNOWN
 37.1089 -26.2237    2.5  50.7  -42.1   1.7404   4.6 ------	UNKNOWN
Post-slew image of 15-350 keV band
Time interval of the image:
82.252590 539.952600

# RAcent  DECcent POSerr Theta    Phi  PeakCts   SNR AngSep     Name
#  [deg]    [deg]    ['] [deg]  [deg]                   [']
256.1383 -37.9903    0.0  30.9  108.8  -1.4767  -1.3   11.3	4U 1700-377
256.4387 -36.4208   86.0  31.5  111.6  -0.1587  -0.1    0.2	GX 349+2
262.9229 -24.8750   98.8  34.4  134.7  -0.1498  -0.1    9.1	GX 1+4
264.7041 -44.4638   25.1  22.5  100.8  -0.4799  -0.5    1.9	4U 1735-44
268.2528  -1.6269    0.0  51.0  160.4  -3.5154  -0.9   12.5	SW J1753.5-0127
270.2371 -24.9464    6.7  30.0  144.0   1.6666   1.7    8.4	GX 5-1
270.1484 -25.7690    3.9  29.4  142.9   2.9412   3.0    8.5	GRS 1758-258
274.0887 -13.9420    5.7  37.4  160.2  -2.5405  -2.0    7.4	GX 17+2
275.8460 -30.5232   27.8  22.5  144.7   0.3360   0.4   10.2	H1820-303
285.0489 -24.7949    5.9  23.3  170.4  -1.5264  -1.9    7.6	HT1900.1-2455
263.0017 -33.9720    4.6  28.3  121.6   2.5121   2.5    8.3	GX 354-0
268.3150 -34.6113    2.4  24.4  126.3   4.2967   4.8 ------	UNKNOWN