Analysis Summary
Notes:
- 1) No attempt has been made to eliminate the non-significant decimal places.
- 2) This batgrbproduct analysis is done using the HEASARC data.
- 3) This batgrbproduct analysis is using the flight position for the mask-weighting calculation.
======================================================================
BAT GRB EVENT DATA PROCESSING REPORT
Process Script Ver: batgrbproduct v2.48
Process Start Time: Wed Jun 14 15:06:19 EDT 2023
Host Name: batproc1
Current Working Dir: /local/data/bat1/alien/Swift_3rdBATcatalog/event/batevent_reproc/trigger1162001
======================================================================
Trigger: 01162001 Segment: 000
BAT Trigger Time: 701708119.552 [s; MET]
Trigger Stop: 701708120.576 [s; MET]
UTC: 2023-03-28T14:54:48.547340 [includes UTCF correction]
Where From?: TDRSS position message
BAT
RA: 290.985760498204 Dec: 80.0162708424252 [deg; J2000]
Catalogged Source?: NO
Point Source?: YES
GRB Indicated?: YES [ by BAT flight software ]
Image S/N Ratio: 17.77
Image Trigger?: NO
Rate S/N Ratio: 53.7866154354408 [ if not an image trigger ]
Image S/N Ratio: 17.77
Analysis Position: [ source = BAT ]
RA: 290.985760498204 Dec: 80.0162708424252 [deg; J2000]
Refined Position: [ source = BAT pre-slew burst ]
RA: 291.034112417174 Dec: 80.0122817911935 [deg; J2000]
{ 19h 24m 08.2s , +80d 00' 44.2" }
+/- 0.829413160582525 [arcmin] (estimated 90% radius based on SNR)
+/- 0.265517025807718 [arcmin] (formal 1-sigma fit error)
SNR: 39.7337833760157
Angular difference between the analysis and refined position is 0.557096 arcmin
Partial Coding Fraction: 0.46875 [ including projection effects ]
Duration
T90: 22.336000084877 +/- 5.71009492341089
Measured from: -2.62400007247925
to: 19.7120000123978 [s; relative to TRIGTIME]
T50: 6.78400003910065 +/- 0.687255446672283
Measured from: 0.911999940872192
to: 7.69599997997284 [s; relative to TRIGTIME]
Fluence
Peak Flux (peak 1 second)
Measured from: 0.259999990463257
to: 1.25999999046326 [s; relative to TRIGTIME]
Total Fluence
Measured from: -7.37600004673004
to: 31.7599999904633 [s; relative to TRIGTIME]
Band 1 Band 2 Band 3 Band 4
15-25 25-50 50-100 100-350 keV
Total 1.997102 2.683602 2.039914 0.478731
0.083863 0.088694 0.076842 0.061593 [error]
Peak 0.206173 0.355605 0.339686 0.105158
0.017813 0.021302 0.020469 0.013713 [error]
[ fluence units of on-axis counts / fully illuminated detector ]
======================================================================
====== Table of the duration information =============================
Value tstart tstop
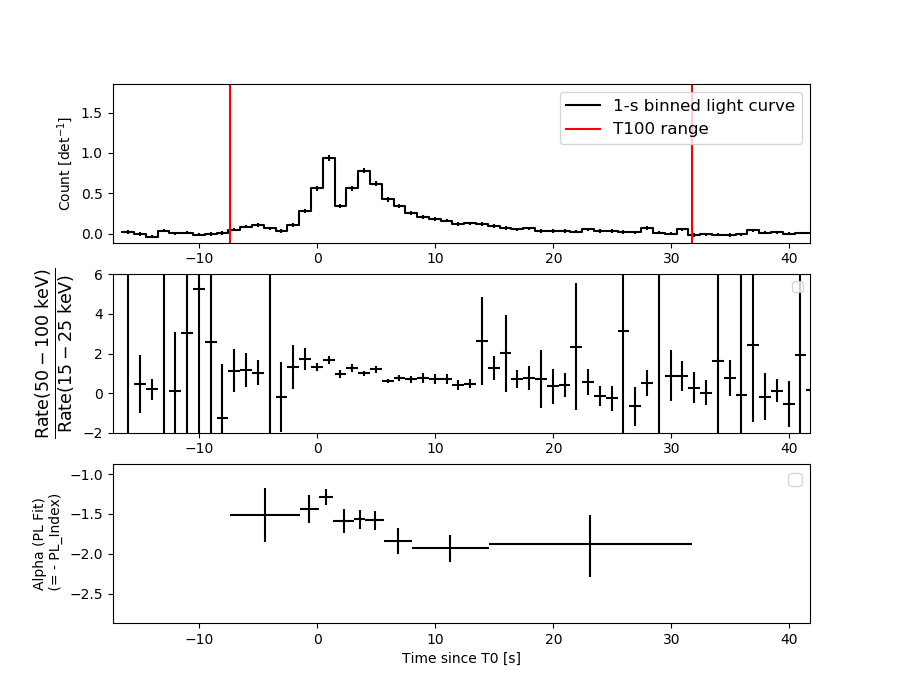
T100 39.136 -7.376 31.760
T90 22.336 -2.624 19.712
T50 6.784 0.912 7.696
Peak 1.000 0.260 1.260
====== Spectral Analysis Summary =====================================
Model : spectral model: simple power-law (PL) and cutoff power-law (CPL)
Ph_index : photon index: E^{Ph_index}
Ph_90err : 90% error of the photon index
Epeak : Epeak in keV
Epeak_90err: 90% error of Epeak
Norm : normalization at 50 keV in both the PL model and CPL model
Nomr_90err : 90% error of the normalization
chi2 : Chi-Squared
dof : degree of freedo
=== Time-averaged spectral analysis ===
(Best model with acceptable fit: PL)
Model Ph_index Ph_90err_low Ph_90err_hi Epeak Epeak_90err_low Epeak_90err_hi Norm Nomr_90err_low Norm_90err_hi chi2 dof
PL -1.633 -0.070 0.070 - - - 1.26e-02 -4.91e-04 4.91e-04 37.160 57
CPL -1.258 -0.285 0.305 102.879 -24.767 144.103 1.91e-02 -5.08e-03 7.51e-03 32.000 56
=== 1-s peak spectral analysis ===
(Best model with acceptable fit: PL)
Model Ph_index Ph_90err_low Ph_90err_hi Epeak Epeak_90err_low Epeak_90err_hi Norm Nomr_90err_low Norm_90err_hi chi2 dof
PL -1.251 -0.105 0.105 - - - 7.09e-02 -4.40e-03 4.40e-03 61.870 57
CPL -0.913 -0.380 0.457 178.684 -72.494 -178.684 1.02e-01 -3.30e-02 6.18e-02 59.970 56
=== Fluence/Peak Flux Summary ===
Model Band1 Band2 Band3 Band4 Band5 Total
15-25 25-50 50-100 100-350 15-150 15-350 keV
Fluence PL 7.12e-07 1.21e-06 1.56e-06 4.04e-06 4.58e-06 7.51e-06 erg/cm2
90%_error_low -4.95e-08 -5.04e-08 -7.81e-08 -4.28e-07 -1.88e-07 -4.85e-07 erg/cm2
90%_error_hi 5.08e-08 5.03e-08 7.79e-08 4.60e-07 1.88e-07 5.09e-07 erg/cm2
Peak flux PL 2.30e+00 2.68e+00 2.26e+00 3.20e+00 8.39e+00 1.04e+01 ph/cm2/s
90%_error_low -2.66e-01 -1.96e-01 -1.61e-01 -4.54e-01 -5.40e-01 -6.69e-01 ph/cm2/s
90%_error_hi 2.77e-01 1.94e-01 1.60e-01 4.96e-01 5.41e-01 6.73e-01 ph/cm2/s
Fluence CPL 6.59e-07 1.24e-06 1.60e-06 2.44e-06 4.47e-06 5.94e-06 erg/cm2
90%_error_low -6.19e-08 -5.78e-08 -8.57e-08 -7.28e-07 -2.09e-07 -7.53e-07 erg/cm2
90%_error_hi 6.32e-08 5.85e-08 8.67e-08 1.12e-06 2.08e-07 1.11e-06 erg/cm2
Peak flux CPL 2.13e+00 2.75e+00 2.35e+00 2.29e+00 8.29e+00 9.52e+00 ph/cm2/s
90%_error_low -3.34e-01 -2.15e-01 -1.99e-01 -7.51e-01 -5.54e-01 -9.56e-01 ph/cm2/s
90%_error_hi 3.44e-01 2.18e-01 2.02e-01 1.08e+00 5.55e-01 1.26e+00 ph/cm2/s
======================================================================
Image
Pre-slew 15.0-350.0 keV image (Event data)
#   RAcent    DECcent   POSerr    Theta     Phi              Peak Cts       SNR   Name
  291.0341    80.0123   0.0049    37.3609  -147.3329         6.8326550     39.734 TRIG_01162001

Foreground time interval of the image:
 -7.376  16.149 (delta_t =  23.525 [sec])
Background time interval of the image:
-239.552  -7.376 (delta_t = 232.176 [sec])
Light Curves
Note: The mask-weighted lightcurves have units of either count/det or counts/sec/det, where a det is 0.4 x 0.4 = 0.16 sq cm.
Full-time range; 1 s binning
Other quick-look light curves:
- 64 ms binning (zoomed)
- 16 ms binning (zoomed)
- 8 ms binning (zoomed)
- 2 ms binning (zoomed)
- SN=5 or 10 s binning (full-time range)
- Raw light curve
Spectra
- 64 ms binning (zoomed)
- 16 ms binning (zoomed)
- 8 ms binning (zoomed)
- 2 ms binning (zoomed)
- SN=5 or 10 s binning (full-time range)
- Raw light curve
Spectra
Notes:
- 1) The fitting includes the systematic errors.
- 2) When the burst includes telescope slew time periods, the fitting uses an average response file made from multiple 5-s response files through out the slew time plus single time preiod for the non-slew times, and weighted by the total counts in the corresponding time period using addrmf. An average response file is needed becuase a spectral fit using the pre-slew DRM will introduce some errors in both a spectral shape and a normalization if the PHA file contains a lot of the slew/post-slew time interval.
- 3) For fits to more complicated models (e.g. a power-law over a cutoff power-law), the BAT team has decided to require a chi-square improvement of more than 6 for each extra dof.
Time averaged spectrum fit using the average DRM
Power-law model
Time interval is from   -7.376 sec. to   31.760 sec.

Spectral model in power-law:
------------------------------------------------------------
Parameters  : value       lower 90%   higher 90%
Photon index: -1.63337     ( -0.0703932   0.0700832 )
Norm@50keV  : 1.25712E-02    ( -0.000490979   0.00049044 )
------------------------------------------------------------
#Fit statistic  : Chi-Squared                   37.16     using 59 bins.
 Reduced chi-squared = 0.65193
# Null hypothesis probability of 9.81e-01 with 57 degrees of freedom

Photon flux (15-150 keV)    in 39.14 sec: 1.63266 ( -0.06768  0.06786 ) ph/cm2/s
Energy fluence (15-150 keV)             : 4.5847e-06 ( -1.87861e-07  1.884e-07 ) ergs/cm2
Cutoff power-law model
Time interval is from   -7.376 sec. to   31.760 sec.
Spectral model in the cutoff power-law:
------------------------------------------------------------
Parameters  : value       lower 90%   higher 90%
Photon index: -1.25771     ( -0.284774   0.304497 )
Epeak [keV] : 102.879      ( -24.7679 144.102 )
Norm@50keV  : 1.91007E-02    ( -0.00508048   0.00750722 )
------------------------------------------------------------
#Fit statistic  : Chi-Squared                   32.00     using 59 bins.
 Reduced chi-squared = 0.571429
# Null hypothesis probability of 9.96e-01 with 56 degrees of freedom

Photon flux (15-150 keV)    in 39.14 sec: 1.59419 ( -0.07303  0.07343 ) ph/cm2/s
Energy fluence (15-150 keV)             : 4.46901e-06 ( -2.08503e-07  2.07817e-07 ) ergs/cm2
1-s peak spectrum fit
Power-law model
Time interval is from    0.260 sec. to    1.260 sec.

Spectral model in power-law:
------------------------------------------------------------
Parameters  : value       lower 90%   higher 90%
Photon index: -1.25132     ( -0.104965   0.105286 )
Norm@50keV  : 7.09162E-02    ( -0.00439566   0.00439563 )
------------------------------------------------------------
#Fit statistic  : Chi-Squared                   61.87     using 59 bins.
 Reduced chi-squared = 1.08544
# Null hypothesis probability of 3.06e-01 with 57 degrees of freedom

Photon flux (15-150 keV)    in 1 sec: 8.38933 ( -0.54009  0.54079 ) ph/cm2/s
Energy fluence (15-150 keV)             : 7.09561e-07 ( -4.78932e-08  4.80565e-08 ) ergs/cm2
Cutoff power-law model
Time interval is from    0.260 sec. to    1.260 sec.
Spectral model in the cutoff power-law:
------------------------------------------------------------
Parameters  : value       lower 90%   higher 90%
Photon index: -0.912834     ( -0.379689   0.457495 )
Epeak [keV] : 178.684      ( -72.4941 -178.684 )
Norm@50keV  : 0.101884    ( -0.033   0.0618033 )
------------------------------------------------------------
#Fit statistic  : Chi-Squared                   59.97     using 59 bins.
 Reduced chi-squared = 1.07089
# Null hypothesis probability of 3.34e-01 with 56 degrees of freedom

Photon flux (15-150 keV)    in 1 sec: 8.28825 ( -0.55414  0.55472 ) ph/cm2/s
Energy fluence (15-150 keV)             : 1.78867e-07 ( -4.77769e-08  5.45487e-08 ) ergs/cm2
Time-resolved spectra
Distribution
T90 vs. Hardness ratio plot
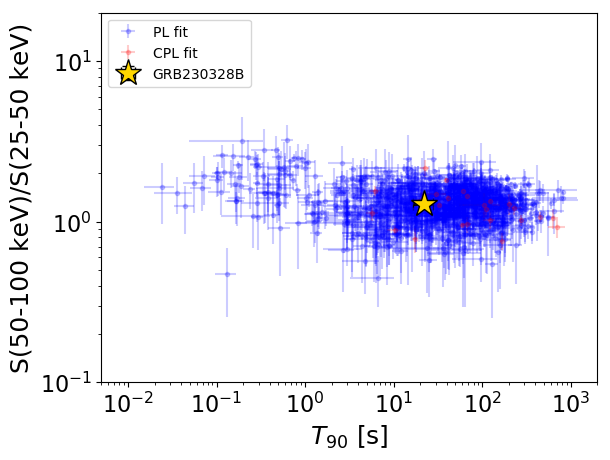
T90                                   = 22.336 sec.
Hardness ratio (energy fluence ratio) = 1.28940699569
S(15-50 keV) vs. S(50-150 keV) plot
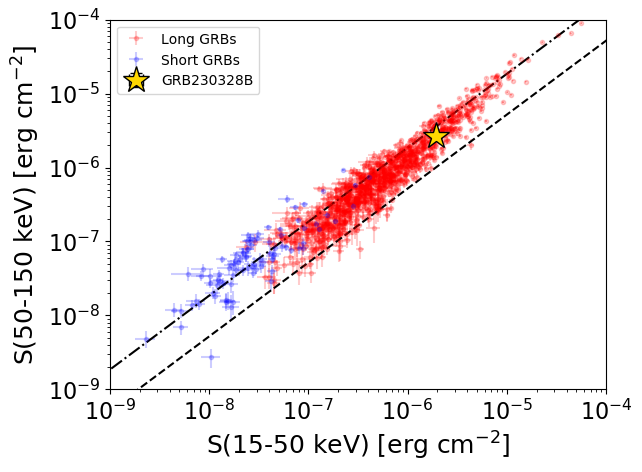
S(15-50 keV)  = 1.9184313e-06
S(50-150 keV) = 2.666295e-06
The dash-dotted line and the dashed line traces the fluences calculated from the Band function with Epeak = 15 and 150 keV, respectively. Both lines assume a canonical values of alpha = -1 and beta = -2.5.
Mask shadow pattern
IMX = -6.427102760570491E-01, IMY = 4.120911943418059E-01
Spacecraft aspect plot
Bright source in the pre-burst/pre-slew/post-slew images
Pre-burst image of 15-350 keV band
Time interval of the image:
-239.552000 -7.376000

# RAcent  DECcent POSerr Theta    Phi  PeakCts   SNR AngSep     Name
#  [deg]    [deg]    ['] [deg]  [deg]                   [']
254.5901  35.2298    6.5   9.8   44.6   0.5653   1.8    9.4	Her X-1
268.2034  -1.3470    0.0  46.6   10.9  -0.6351  -1.2   11.7	SW J1753.5-0127
288.8775  10.8997    6.3  42.4  -23.0   0.9967   1.8    5.4	GRS 1915+105
299.5859  35.1910    0.8  32.3  -63.7   7.9539  14.8    0.7	Cyg X-1
308.1640  41.0248    3.5  35.8  -78.3   2.2572   3.3    5.0	Cyg X-3
261.8048 -10.9570    2.7  55.5   20.4   6.7834   4.3 ------	UNKNOWN
161.1663  83.7326    2.8  46.7 -164.7   3.0319   4.1 ------	UNKNOWN
286.4519  14.7063    3.0  37.9  -23.0   1.7781   3.9 ------	UNKNOWN
Pre-slew background subtracted image of 15-350 keV band
Time interval of the image:
-7.376000 16.148600

# RAcent  DECcent POSerr Theta    Phi  PeakCts   SNR AngSep     Name
#  [deg]    [deg]    ['] [deg]  [deg]                   [']
254.5510  35.3835    3.4   9.7   45.1  -0.3439  -3.4    5.2	Her X-1
268.3109  -1.5285    7.8  46.8   10.8  -0.2949  -1.5    5.7	SW J1753.5-0127
288.6815  10.8699    5.8  42.3  -22.7   0.3796   2.0    8.2	GRS 1915+105
299.5900  35.2014   15.0  32.3  -63.7  -0.1523  -0.8    0.0	Cyg X-1
308.1891  40.9408   18.7  35.9  -78.2  -0.1790  -0.6    3.6	Cyg X-3
213.5794  26.1148    3.1  40.6  102.5   1.2724   3.7 ------	UNKNOWN
252.7378  -6.0404    2.4  50.8   31.7   1.7459   4.9 ------	UNKNOWN
291.0341  80.0123    0.3  37.4 -147.3   6.8323  39.8 ------	UNKNOWN
 58.0738  79.1616    2.3  55.7 -151.5   2.5677   4.9 ------	UNKNOWN
Post-slew image of 15-350 keV band
Time interval of the image:
93.148590 719.636300
720.448000 871.748600

# RAcent  DECcent POSerr Theta    Phi  PeakCts   SNR AngSep     Name
#  [deg]    [deg]    ['] [deg]  [deg]                   [']
254.4050  35.3875    4.4  46.8   28.7   3.9284   2.6    3.7	Her X-1
299.5860  35.2180    0.7  44.9  -23.0  24.8150  15.7    1.0	Cyg X-1
308.1542  40.9328    3.1  39.6  -33.5   5.0430   3.7    2.3	Cyg X-3
326.2084  38.2453    6.8  43.9  -53.8   5.1135   1.7    4.9	Cyg X-2
248.0804  35.4345    3.0  47.6   35.7   7.8135   3.8 ------	UNKNOWN
274.5848  25.2223    2.8  55.2    5.1  10.1764   4.2 ------	UNKNOWN
274.3015  31.4931    2.7  49.0    5.9   5.7363   4.3 ------	UNKNOWN
 92.8796  55.0995    2.6  44.5 -178.3   8.1283   4.4 ------	UNKNOWN
 76.9432  51.9051    3.0  46.7 -164.6   7.5308   3.8 ------	UNKNOWN
 49.0029  55.1864    2.5  40.4 -141.9   8.0099   4.6 ------	UNKNOWN
  8.9589  50.5768    3.5  38.4 -103.3   9.9111   3.3 ------	UNKNOWN