Analysis Summary
Notes:
- 1) No attempt has been made to eliminate the non-significant decimal places.
- 2) This batgrbproduct analysis is done using the HEASARC data.
- 3) This batgrbproduct analysis is using the flight position for the mask-weighting calculation.
======================================================================
                  BAT GRB EVENT DATA PROCESSING REPORT
    Process Script Ver: batgrbproduct v2.48
    Process Start Time: Wed Jun 14 15:04:57 EDT 2023
             Host Name: batproc1
   Current Working Dir: /local/data/bat1/alien/Swift_3rdBATcatalog/event/batevent_reproc/trigger1163119
======================================================================

  Trigger: 01163119      Segment: 000

  BAT Trigger Time: 702417514.56   [s; MET]
      Trigger Stop: 702417515.072   [s; MET]
               UTC: 2023-04-05T19:58:03.507020    [includes UTCF correction]
       Where From?: TDRSS position message

  BAT
    RA: 271.467274097228   Dec: -47.0704638653042  [deg; J2000]

     Catalogged Source?: NO
     Point Source?:      YES
     GRB Indicated?:     YES    [ by BAT flight software ]
     Image S/N Ratio:    9.59
     Image Trigger?:     NO
     Rate S/N Ratio:     22.9128784747792  [ if not an image trigger ]
     Image S/N Ratio:    9.59

  Analysis Position:   [ source = BAT ]
    RA: 271.467274097228   Dec: -47.0704638653042  [deg; J2000]

  Refined Position:   [ source = BAT pre-slew burst ]
    RA: 271.434620779064   Dec: -47.0718132093437  [deg; J2000]
        { 18h 05m 44.3s , -47d 04' 18.5" }
         +/- 0.781687074602248 [arcmin] (estimated 90% radius based on SNR)
         +/- 0.242189896917617 [arcmin] (formal 1-sigma fit error)
    SNR: 43.2442608923388

  Angular difference between the analysis and refined position is 1.336844 arcmin

  Partial Coding Fraction: 0.9453125    [ including projection effects ]

  Duration
     T90: 14.135999917984 +/- 5.59268845486081
        Measured from: -7.01199996471405
                   to: 7.12399995326996     [s; relative to TRIGTIME]
     T50: 1.85199999809265 +/- 0.167475413189009
        Measured from: 1.51600003242493
                   to: 3.36800003051758     [s; relative to TRIGTIME]


  Fluence
     Peak Flux  (peak 1 second)
        Measured from: 1.91600000858307
                   to: 2.91600000858307     [s; relative to TRIGTIME]
     Total Fluence
        Measured from: -19.0319999456406
                   to: 12.6560000181198     [s; relative to TRIGTIME]

             Band 1     Band 2     Band 3     Band 4
              15-25      25-50     50-100    100-350     keV
 Total     1.231788   2.137333   1.880233   0.565073
           0.059900   0.057825   0.051022   0.039610 [error]
 Peak      0.312432   0.640036   0.740229   0.234742
           0.015857   0.019938   0.021457   0.014713 [error]

     [ fluence units of on-axis counts / fully illuminated detector ]

======================================================================


====== Table of the duration information =============================

        Value   tstart    tstop
T100   31.688  -19.032   12.656
T90    14.136   -7.012    7.124
T50     1.852    1.516    3.368
Peak    1.000    1.916    2.916


====== Spectral Analysis Summary =====================================

Model      : spectral model: simple power-law (PL) and cutoff power-law (CPL)
Ph_index   : photon index: E^{Ph_index}
Ph_90err   : 90% error of the photon index
Epeak      : Epeak in keV
Epeak_90err: 90% error of Epeak
Norm       : normalization at 50 keV in both the PL model and CPL model
Nomr_90err : 90% error of the normalization
chi2       : Chi-Squared
dof        : degree of freedo

=== Time-averaged spectral analysis ===
(Best model with acceptable fit: PL)

Model Ph_index Ph_90err_low Ph_90err_hi  Epeak  Epeak_90err_low  Epeak_90err_hi  Norm       Nomr_90err_low    Norm_90err_hi    chi2    dof
PL      -1.207    -0.057      0.058       -           -               -         1.20e-02     -3.74e-04          3.73e-04      60.760   57
CPL     -0.955    -0.224      0.237      236.028     -86.593      1336.062      1.55e-02     -3.05e-03          4.11e-03      57.060   56


=== 1-s peak spectral analysis ===
(Best model with acceptable fit: CPL)

Model Ph_index Ph_90err_low Ph_90err_hi  Epeak  Epeak_90err_low  Epeak_90err_hi  Norm       Nomr_90err_low    Norm_90err_hi    chi2    dof
PL      -0.883     -0.058     0.058       -           -               -         1.26e-01     -4.27e-03          4.27e-03      44.500   57
CPL     -0.426     -0.239     0.253      205.690     -52.254       152.253      1.98e-01     -4.07e-02          5.42e-02      33.390   56


=== Fluence/Peak Flux Summary ===

              Model    Band1     Band2     Band3     Band4     Band5     Total
                       15-25     25-50    50-100    100-350    15-150    15-350    keV
Fluence         PL   3.69e-07  8.12e-07  1.41e-06  5.66e-06  3.85e-06  8.25e-06   erg/cm2
      90%_error_low -2.39e-08 -3.10e-08 -4.98e-08 -4.56e-07 -1.27e-07 -4.80e-07   erg/cm2
      90%_error_hi   2.45e-08  3.09e-08  4.97e-08  4.84e-07  1.27e-07  5.04e-07   erg/cm2
Peak flux       PL   2.89e+00  4.20e+00  4.56e+00  9.24e+00  1.45e+01  2.09e+01   ph/cm2/s
      90%_error_low -1.99e-01 -1.79e-01 -1.64e-01 -7.05e-01 -4.90e-01 -8.09e-01   ph/cm2/s
      90%_error_hi   2.05e-01  1.78e-01  1.64e-01  7.43e-01  4.90e-01  8.22e-01   ph/cm2/s

Fluence        CPL   3.46e-07  8.23e-07  1.44e-06  4.07e-06  3.79e-06  6.68e-06   erg/cm2
      90%_error_low -3.08e-08 -3.31e-08 -5.82e-08 -9.92e-07 -1.37e-07 -9.89e-07   erg/cm2
      90%_error_hi   3.14e-08  3.32e-08  5.87e-08  1.36e-06  1.37e-07  1.37e-06   erg/cm2
Peak flux      CPL   2.54e+00  4.28e+00  4.83e+00  6.07e+00  1.43e+01  1.77e+01   ph/cm2/s
      90%_error_low -2.57e-01 -1.91e-01 -2.13e-01 -1.13e+00 -5.04e-01 -1.24e+00   ph/cm2/s
      90%_error_hi   2.64e-01  1.91e-01  2.15e-01  1.46e+00  5.04e-01  1.52e+00   ph/cm2/s

======================================================================
Image
Pre-slew 15.0-350.0 keV image (Event data)
#   RAcent    DECcent   POSerr    Theta     Phi              Peak Cts       SNR   Name
  271.4346   -47.0718   0.0045    11.1236  -102.8872         5.8564733     43.244 TRIG_01163119

Foreground time interval of the image:
-19.032  10.141 (delta_t =  29.173 [sec])
Background time interval of the image:
-239.560 -19.032 (delta_t = 220.528 [sec])
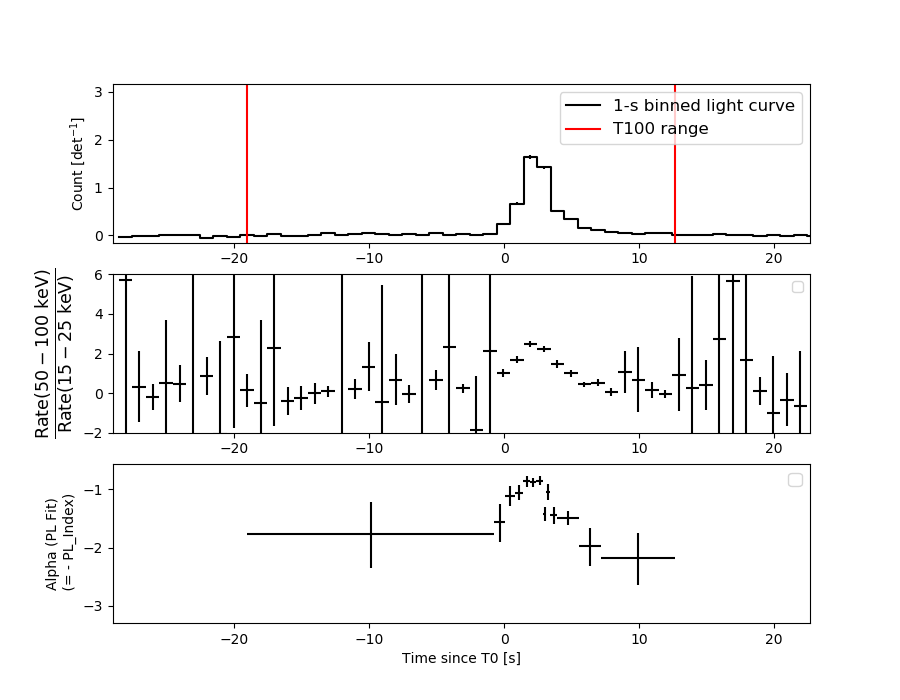
Light Curves
Note: The mask-weighted lightcurves have units of either count/det or counts/sec/det, where a det is 0.4 x 0.4 = 0.16 sq cm.
Full-time range; 1 s binning
Other quick-look light curves:
- 64 ms binning (zoomed)
- 16 ms binning (zoomed)
- 8 ms binning (zoomed)
- 2 ms binning (zoomed)
- SN=5 or 10 s binning (full-time range)
- Raw light curve
Spectra
- 64 ms binning (zoomed)
- 16 ms binning (zoomed)
- 8 ms binning (zoomed)
- 2 ms binning (zoomed)
- SN=5 or 10 s binning (full-time range)
- Raw light curve
Spectra
Notes:
- 1) The fitting includes the systematic errors.
- 2) When the burst includes telescope slew time periods, the fitting uses an average response file made from multiple 5-s response files through out the slew time plus single time preiod for the non-slew times, and weighted by the total counts in the corresponding time period using addrmf. An average response file is needed becuase a spectral fit using the pre-slew DRM will introduce some errors in both a spectral shape and a normalization if the PHA file contains a lot of the slew/post-slew time interval.
- 3) For fits to more complicated models (e.g. a power-law over a cutoff power-law), the BAT team has decided to require a chi-square improvement of more than 6 for each extra dof.
Time averaged spectrum fit using the average DRM
Power-law model
Time interval is from  -19.032 sec. to   12.656 sec.

Spectral model in power-law:
------------------------------------------------------------
Parameters  : value       lower 90%   higher 90%
Photon index: -1.20721     ( -0.057178   0.0575156 )
Norm@50keV  : 1.19991E-02    ( -0.000373597   0.000373361 )
------------------------------------------------------------
#Fit statistic  : Chi-Squared                   60.76     using 59 bins.
 Reduced chi-squared = 1.06596
# Null hypothesis probability of 3.42e-01 with 57 degrees of freedom

Photon flux (15-150 keV)    in 31.69 sec: 1.40991 ( -0.04689  0.04699 ) ph/cm2/s
Energy fluence (15-150 keV)             : 3.85046e-06 ( -1.26783e-07  1.26965e-07 ) ergs/cm2
Cutoff power-law model
Time interval is from  -19.032 sec. to   12.656 sec.
Spectral model in the cutoff power-law:
------------------------------------------------------------
Parameters  : value       lower 90%   higher 90%
Photon index: -0.954546     ( -0.224134   0.237449 )
Epeak [keV] : 236.028      ( -86.593 1336.06 )
Norm@50keV  : 1.55316E-02    ( -0.00305268   0.00411167 )
------------------------------------------------------------
#Fit statistic  : Chi-Squared                   57.06     using 59 bins.
 Reduced chi-squared = 1.01893
# Null hypothesis probability of 4.35e-01 with 56 degrees of freedom

Photon flux (15-150 keV)    in 31.69 sec: 1.38822 ( -0.05042  0.05053 ) ph/cm2/s
Energy fluence (15-150 keV)             : 3.79386e-06 ( -1.37476e-07  1.36858e-07 ) ergs/cm2
1-s peak spectrum fit
Power-law model
Time interval is from    1.916 sec. to    2.916 sec.

Spectral model in power-law:
------------------------------------------------------------
Parameters  : value       lower 90%   higher 90%
Photon index: -0.882604     ( -0.0579588   0.0583161 )
Norm@50keV  : 0.126293    ( -0.00427424   0.00426891 )
------------------------------------------------------------
#Fit statistic  : Chi-Squared                   44.50     using 59 bins.
 Reduced chi-squared = 0.780702
# Null hypothesis probability of 8.86e-01 with 57 degrees of freedom

Photon flux (15-150 keV)    in 1 sec: 14.4943 ( -0.4903  0.4905 ) ph/cm2/s
Energy fluence (15-150 keV)             : 1.42718e-06 ( -5.2695e-08  5.27801e-08 ) ergs/cm2
Cutoff power-law model
Time interval is from    1.916 sec. to    2.916 sec.
Spectral model in the cutoff power-law:
------------------------------------------------------------
Parameters  : value       lower 90%   higher 90%
Photon index: -0.426399     ( -0.239198   0.253046 )
Epeak [keV] : 205.690      ( -52.2545 152.253 )
Norm@50keV  : 0.198264    ( -0.0407385   0.054197 )
------------------------------------------------------------
#Fit statistic  : Chi-Squared                   33.39     using 59 bins.
 Reduced chi-squared = 0.59625
# Null hypothesis probability of 9.93e-01 with 56 degrees of freedom

Photon flux (15-150 keV)    in 1 sec: 14.2625 ( -0.504  0.5041 ) ph/cm2/s
Energy fluence (15-150 keV)             : 1.40365e-06 ( -5.53392e-08  5.51643e-08 ) ergs/cm2
Time-resolved spectra
Distribution
T90 vs. Hardness ratio plot
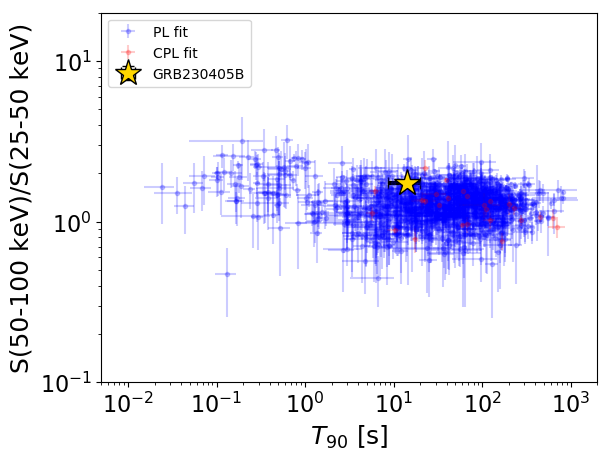
T90                                   = 14.136 sec.
Hardness ratio (energy fluence ratio) = 1.73244669037
S(15-50 keV) vs. S(50-150 keV) plot
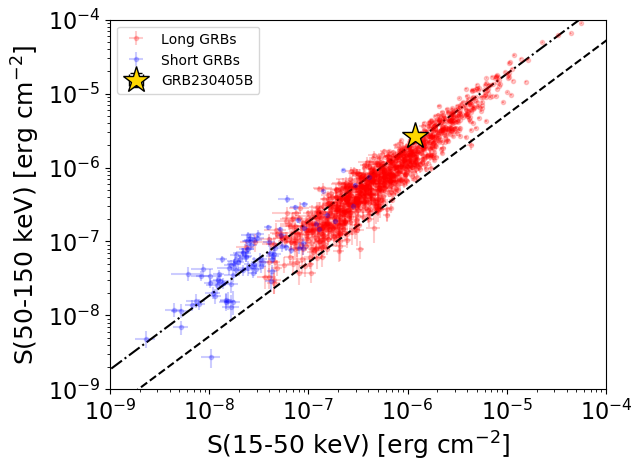
S(15-50 keV)  = 1.1815283e-06
S(50-150 keV) = 2.668928e-06
The dash-dotted line and the dashed line traces the fluences calculated from the Band function with Epeak = 15 and 150 keV, respectively. Both lines assume a canonical values of alpha = -1 and beta = -2.5.
Mask shadow pattern
IMX = -4.385245319988727E-02, IMY = 1.916666906535452E-01
Spacecraft aspect plot

Bright source in the pre-burst/pre-slew/post-slew images
Pre-burst image of 15-350 keV band
Time interval of the image:
-239.560000 -19.032000

# RAcent  DECcent POSerr Theta    Phi  PeakCts   SNR AngSep     Name
#  [deg]    [deg]    ['] [deg]  [deg]                   [']
170.3117 -60.7271    7.2  48.8   16.9   1.3095   1.6    6.3	Cen X-3
186.6402 -62.7784    0.8  40.8   17.2   9.9118  14.9    0.7	GX 301-2
245.0115 -15.6296    0.8  31.7  137.5  11.1722  15.3    2.0	Sco X-1
255.9170 -37.8298    1.5   8.3  160.0   3.6203   7.9    3.4	4U 1700-377
256.3920 -36.3641    2.9   9.8  161.8   1.8304   4.0    4.1	GX 349+2
262.9524 -24.7249   14.2  22.3  175.2   0.3986   0.8    3.3	GX 1+4
264.5442 -44.5627    4.0   6.7 -123.9   1.4614   2.9   10.9	4U 1735-44
268.4548  -1.5198    4.9  46.1  175.0   2.7326   2.3    6.6	SW J1753.5-0127
270.1672 -24.9333    4.7  24.3 -169.0   1.1981   2.4   10.8	GX 5-1
270.1484 -25.7303    3.8  23.6 -168.2   1.4296   3.0    8.4	GRS 1758-258
274.1334 -14.0409    4.8  35.8 -171.1   1.4803   2.4    7.4	GX 17+2
275.7889 -30.3441    4.3  22.4 -151.1   1.3390   2.7    7.2	H1820-303
285.1819 -25.0885    0.0  31.8 -144.6  -0.3087  -0.4   12.8	HT1900.1-2455
263.0007 -33.7615    4.4  13.7 -175.3   1.1813   2.6    4.4	GX 354-0
 92.7091 -79.0449    3.0  54.4  -19.5   6.0093   3.8 ------	UNKNOWN
300.6393  -9.5522    2.5  53.2 -142.2  11.0427   4.5 ------	UNKNOWN
Pre-slew background subtracted image of 15-350 keV band
Time interval of the image:
-19.032000 10.140600

# RAcent  DECcent POSerr Theta    Phi  PeakCts   SNR AngSep     Name
#  [deg]    [deg]    ['] [deg]  [deg]                   [']
170.3343 -60.5235   10.2  48.9   17.1   0.3352   1.1    6.0	Cen X-3
186.6159 -62.6726    7.3  40.8   17.3   0.3292   1.6    6.0	GX 301-2
244.9863 -15.6109   64.7  31.7  137.4   0.0312   0.2    1.8	Sco X-1
255.9801 -37.7941    5.4   8.4  160.4  -0.2571  -2.1    3.0	4U 1700-377
256.6777 -36.3415    0.0   9.9  163.1   0.1073   0.9   12.7	GX 349+2
263.0118 -24.7530   23.4  22.3  175.3   0.0650   0.5    0.5	GX 1+4
265.0026 -44.3503    0.0   7.1 -124.7   0.2001   1.6   12.6	4U 1735-44
268.4341  -1.5770    4.5  46.0  174.9   0.6766   2.5    8.5	SW J1753.5-0127
270.1770 -24.8968    0.0  24.4 -169.1  -0.3040  -2.4   12.4	GX 5-1
270.2956 -25.6254    4.5  23.8 -168.0  -0.3232  -2.5    7.1	GRS 1758-258
274.1304 -14.0567    3.7  35.8 -171.1   0.4875   3.1    7.4	GX 17+2
276.0655 -30.5142    5.3  22.5 -150.3  -0.2852  -2.2   11.4	H1820-303
285.1819 -25.0885    0.0  31.8 -144.6   0.1448   0.9   12.8	HT1900.1-2455
262.8586 -33.8502   12.3  13.6 -175.7  -0.1127  -0.9    6.6	GX 354-0
271.4346 -47.0718    0.3  11.1 -102.9   5.8565  43.2 ------	UNKNOWN
319.8662 -60.1545    2.4  39.3  -68.7   1.6667   4.7 ------	UNKNOWN
Post-slew image of 15-350 keV band
Time interval of the image:
53.740590 962.670000

# RAcent  DECcent POSerr Theta    Phi  PeakCts   SNR AngSep     Name
#  [deg]    [deg]    ['] [deg]  [deg]                   [']
186.7151 -62.7739    1.1  47.2   33.2  28.3773  10.4    1.6	GX 301-2
244.9792 -15.6386    1.1  38.3  131.0  51.3601  10.2    0.1	Sco X-1
255.9387 -37.8727    4.8  14.7  118.1   5.0661   2.4    2.8	4U 1700-377
256.3643 -36.3823    4.5  15.5  123.1   5.2775   2.6    4.2	GX 349+2
262.9831 -24.7835    3.0  23.3  155.0   6.9211   3.9    2.7	GX 1+4
264.6776 -44.3825    7.8   5.5  112.0   2.5416   1.5    4.9	4U 1735-44
268.4694  -1.4888    5.4  45.7  170.6  10.8005   2.1    6.5	SW J1753.5-0127
270.2979 -25.1329    4.6  22.0  172.0   4.7554   2.5    3.3	GX 5-1
270.4499 -25.8149    6.0  21.3  172.3   3.6237   1.9    9.1	GRS 1758-258
274.0179 -13.8939   20.3  33.3  179.3   1.2494   0.6    8.6	GX 17+2
275.7653 -30.2103    0.0  17.2 -172.5   0.8392   0.5   12.5	H1820-303
284.8793 -24.8915    9.4  24.6 -154.8  -2.1586  -1.2    8.7	HT1900.1-2455
262.9889 -33.8359  535.8  14.7  146.0  -0.0400  -0.0    0.1	GX 354-0
159.0850 -75.7566    4.6  49.8   12.2   5.9140   2.5 ------	UNKNOWN
303.6772 -87.9541    2.4  41.2   -6.8  11.4011   4.8 ------	UNKNOWN
304.5169  -2.3033    2.7  53.1 -142.3  34.5433   4.2 ------	UNKNOWN