Analysis Summary
Notes:
- 1) No attempt has been made to eliminate the non-significant decimal places.
- 2) This batgrbproduct analysis is done using the HEASARC data.
- 3) This batgrbproduct analysis is using the flight position for the mask-weighting calculation.
======================================================================
                  BAT GRB EVENT DATA PROCESSING REPORT
    Process Script Ver: batgrbproduct v2.48
    Process Start Time: Wed Jun 14 15:03:34 EDT 2023
             Host Name: batproc1
   Current Working Dir: /local/data/bat1/alien/Swift_3rdBATcatalog/event/batevent_reproc/trigger1163401
======================================================================

  Trigger: 01163401      Segment: 000

  BAT Trigger Time: 702709047.872   [s; MET]
      Trigger Stop: 702709048.896   [s; MET]
               UTC: 2023-04-09T04:56:56.799160    [includes UTCF correction]
       Where From?: TDRSS position message

  BAT
    RA: 329.530427345421   Dec: 52.8541952268448  [deg; J2000]

     Catalogged Source?: NO
     Point Source?:      YES
     GRB Indicated?:     YES    [ by BAT flight software ]
     Image S/N Ratio:    9.2
     Image Trigger?:     NO
     Rate S/N Ratio:     19.723082923316  [ if not an image trigger ]
     Image S/N Ratio:    9.2

  Analysis Position:   [ source = BAT ]
    RA: 329.530427345421   Dec: 52.8541952268448  [deg; J2000]

  Refined Position:   [ source = BAT pre-slew burst ]
    RA: 329.515463822109   Dec: 52.8320017100701  [deg; J2000]
        { 21h 58m 03.7s , +52d 49' 55.2" }
         +/- 1.69556299593017 [arcmin] (estimated 90% radius based on SNR)
         +/- 0.683733287667842 [arcmin] (formal 1-sigma fit error)
    SNR: 14.3062908966215

  Angular difference between the analysis and refined position is 1.437795 arcmin

  Partial Coding Fraction: 0.3203125    [ including projection effects ]

  Duration
     T90: 9.79199981689453 +/- 2.58863975001758
        Measured from: -0.25599992275238
                   to: 9.53599989414215     [s; relative to TRIGTIME]
     T50: 3.4559999704361 +/- 1.13408284654695
        Measured from: 0.575999975204468
                   to: 4.03199994564056     [s; relative to TRIGTIME]


  Fluence
     Peak Flux  (peak 1 second)
        Measured from: 0.427999973297119
                   to: 1.42799997329712     [s; relative to TRIGTIME]
     Total Fluence
        Measured from: -0.575999975204468
                   to: 11.7760000228882     [s; relative to TRIGTIME]

             Band 1     Band 2     Band 3     Band 4
              15-25      25-50     50-100    100-350     keV
 Total     0.634758   0.673953   0.397689   0.021933
           0.062360   0.064532   0.056051   0.044916 [error]
 Peak      0.155129   0.170346   0.119880   0.001007
           0.019897   0.022171   0.017664   0.014047 [error]

     [ fluence units of on-axis counts / fully illuminated detector ]

======================================================================


====== Table of the duration information =============================

        Value   tstart    tstop
T100   12.352   -0.576   11.776
T90     9.792   -0.256    9.536
T50     3.456    0.576    4.032
Peak    1.000    0.428    1.428


====== Spectral Analysis Summary =====================================

Model      : spectral model: simple power-law (PL) and cutoff power-law (CPL)
Ph_index   : photon index: E^{Ph_index}
Ph_90err   : 90% error of the photon index
Epeak      : Epeak in keV
Epeak_90err: 90% error of Epeak
Norm       : normalization at 50 keV in both the PL model and CPL model
Nomr_90err : 90% error of the normalization
chi2       : Chi-Squared
dof        : degree of freedo

=== Time-averaged spectral analysis ===
(Best model with acceptable fit: PL)

Model Ph_index Ph_90err_low Ph_90err_hi  Epeak  Epeak_90err_low  Epeak_90err_hi  Norm       Nomr_90err_low    Norm_90err_hi    chi2    dof
PL      -1.855    -0.199      0.190       -           -               -         8.71e-03     -1.10e-03          1.08e-03      54.670   57
CPL     -1.628    -0.636      0.758       74.534     -68.643       -74.534      1.16e-02     -6.15e-03          1.80e-02      54.340   56


=== 1-s peak spectral analysis ===
(Best model with acceptable fit: PL)

Model Ph_index Ph_90err_low Ph_90err_hi  Epeak  Epeak_90err_low  Epeak_90err_hi  Norm       Nomr_90err_low    Norm_90err_hi    chi2    dof
PL      -1.722     -0.221     0.212       -           -               -         2.78e-02     -4.11e-03          4.04e-03      59.260   57
CPL     -1.142     -0.718     0.940       69.288     -21.315       -69.288      5.76e-02     -3.24e-02          1.25e-01      57.710   56


=== Fluence/Peak Flux Summary ===

              Model    Band1     Band2     Band3     Band4     Band5     Total
                       15-25     25-50    50-100    100-350    15-150    15-350    keV
Fluence         PL   1.92e-07  2.84e-07  3.14e-07  6.54e-07  9.89e-07  1.44e-06   erg/cm2
      90%_error_low -2.96e-08 -2.99e-08 -5.35e-08 -2.00e-07 -1.24e-07 -2.60e-07   erg/cm2
      90%_error_hi   3.04e-08  2.99e-08  5.38e-08  2.49e-07  1.25e-07  2.98e-07   erg/cm2
Peak flux       PL   1.42e+00  1.25e+00  7.59e-01  6.95e-01  3.73e+00  4.13e+00   ph/cm2/s
      90%_error_low -2.77e-01 -1.70e-01 -1.40e-01 -2.19e-01 -5.03e-01 -5.58e-01   ph/cm2/s
      90%_error_hi   2.88e-01  1.70e-01  1.39e-01  2.67e-01  5.03e-01  5.59e-01   ph/cm2/s

Fluence        CPL   1.87e-07  2.92e-07  3.16e-07  4.44e-07  9.71e-07  1.24e-06   erg/cm2
      90%_error_low -3.34e-08 -3.61e-08 -5.57e-08 -2.91e-07 -1.34e-07 -3.29e-07   erg/cm2
      90%_error_hi   3.34e-08  3.92e-08  5.64e-08  2.67e-07  1.35e-07  3.10e-07   erg/cm2
Peak flux      CPL   1.32e+00  1.35e+00  7.95e-01  3.63e-01  3.70e+00  3.83e+00   ph/cm2/s
      90%_error_low -3.15e-01 -2.15e-01 -1.56e-01 -2.20e-01 -5.06e-01 -5.62e-01   ph/cm2/s
      90%_error_hi   3.17e-01  2.26e-01  1.60e-01  4.34e-01  5.05e-01  6.57e-01   ph/cm2/s

======================================================================
Image
Pre-slew 15.0-350.0 keV image (Event data)
#   RAcent    DECcent   POSerr    Theta     Phi              Peak Cts       SNR   Name
  329.5155    52.8320   0.0134    29.2109   -87.4106         1.7932422     14.306 TRIG_01163401

Foreground time interval of the image:
 -0.576  11.776 (delta_t =  12.352 [sec])
Background time interval of the image:
-239.872  -0.576 (delta_t = 239.296 [sec])
Light Curves
Note: The mask-weighted lightcurves have units of either count/det or counts/sec/det, where a det is 0.4 x 0.4 = 0.16 sq cm.
Full-time range; 1 s binning
Other quick-look light curves:
- 64 ms binning (zoomed)
- 16 ms binning (zoomed)
- 8 ms binning (zoomed)
- 2 ms binning (zoomed)
- SN=5 or 10 s binning (full-time range)
- Raw light curve
Spectra
- 64 ms binning (zoomed)
- 16 ms binning (zoomed)
- 8 ms binning (zoomed)
- 2 ms binning (zoomed)
- SN=5 or 10 s binning (full-time range)
- Raw light curve
Spectra
Notes:
- 1) The fitting includes the systematic errors.
- 2) When the burst includes telescope slew time periods, the fitting uses an average response file made from multiple 5-s response files through out the slew time plus single time preiod for the non-slew times, and weighted by the total counts in the corresponding time period using addrmf. An average response file is needed becuase a spectral fit using the pre-slew DRM will introduce some errors in both a spectral shape and a normalization if the PHA file contains a lot of the slew/post-slew time interval.
- 3) For fits to more complicated models (e.g. a power-law over a cutoff power-law), the BAT team has decided to require a chi-square improvement of more than 6 for each extra dof.
Time averaged spectrum fit using the average DRM
Power-law model
Time interval is from   -0.576 sec. to   11.776 sec.

Spectral model in power-law:
------------------------------------------------------------
Parameters  : value       lower 90%   higher 90%
Photon index: -1.85543     ( -0.198802   0.189578 )
Norm@50keV  : 8.70680E-03    ( -0.00110144   0.00107548 )
------------------------------------------------------------
#Fit statistic  : Chi-Squared                   54.67     using 59 bins.
 Reduced chi-squared = 0.959123
# Null hypothesis probability of 5.63e-01 with 57 degrees of freedom

Photon flux (15-150 keV)    in 12.35 sec: 1.22661 ( -0.13008  0.13013 ) ph/cm2/s
Energy fluence (15-150 keV)             : 9.88819e-07 ( -1.23617e-07  1.25391e-07 ) ergs/cm2
Cutoff power-law model
Time interval is from   -0.576 sec. to   11.776 sec.
Spectral model in the cutoff power-law:
------------------------------------------------------------
Parameters  : value       lower 90%   higher 90%
Photon index: -1.62773     ( -0.635992   0.757967 )
Epeak [keV] : 74.5340      ( -68.6423 -74.5334 )
Norm@50keV  : 1.16086E-02    ( -0.00614597   0.0179832 )
------------------------------------------------------------
#Fit statistic  : Chi-Squared                   54.34     using 59 bins.
 Reduced chi-squared = 0.970357
# Null hypothesis probability of 5.38e-01 with 56 degrees of freedom

Photon flux (15-150 keV)    in 12.35 sec: 1.21690 ( -0.13323  0.13312 ) ph/cm2/s
Energy fluence (15-150 keV)             : 9.70883e-07 ( -1.33688e-07  1.34893e-07 ) ergs/cm2
1-s peak spectrum fit
Power-law model
Time interval is from    0.428 sec. to    1.428 sec.

Spectral model in power-law:
------------------------------------------------------------
Parameters  : value       lower 90%   higher 90%
Photon index: -1.72248     ( -0.221043   0.212357 )
Norm@50keV  : 2.78344E-02    ( -0.00410964   0.00404112 )
------------------------------------------------------------
#Fit statistic  : Chi-Squared                   59.26     using 59 bins.
 Reduced chi-squared = 1.03965
# Null hypothesis probability of 3.93e-01 with 57 degrees of freedom

Photon flux (15-150 keV)    in 1 sec: 3.72639 ( -0.50296  0.50315 ) ph/cm2/s
Energy fluence (15-150 keV)             : 2.5733e-07 ( -3.91022e-08  3.94605e-08 ) ergs/cm2
Cutoff power-law model
Time interval is from    0.428 sec. to    1.428 sec.
Spectral model in the cutoff power-law:
------------------------------------------------------------
Parameters  : value       lower 90%   higher 90%
Photon index: -1.14201     ( -0.718137   0.940202 )
Epeak [keV] : 69.2877      ( -21.3154 -69.288 )
Norm@50keV  : 5.76171E-02    ( -0.0324273   0.12469 )
------------------------------------------------------------
#Fit statistic  : Chi-Squared                   57.71     using 59 bins.
 Reduced chi-squared = 1.03054
# Null hypothesis probability of 4.12e-01 with 56 degrees of freedom

Photon flux (15-150 keV)    in 1 sec: 3.69668 ( -0.50567  0.50546 ) ph/cm2/s
Energy fluence (15-150 keV)             : 2.49569e-07 ( -4.0495e-08  4.09603e-08 ) ergs/cm2
Time-resolved spectra
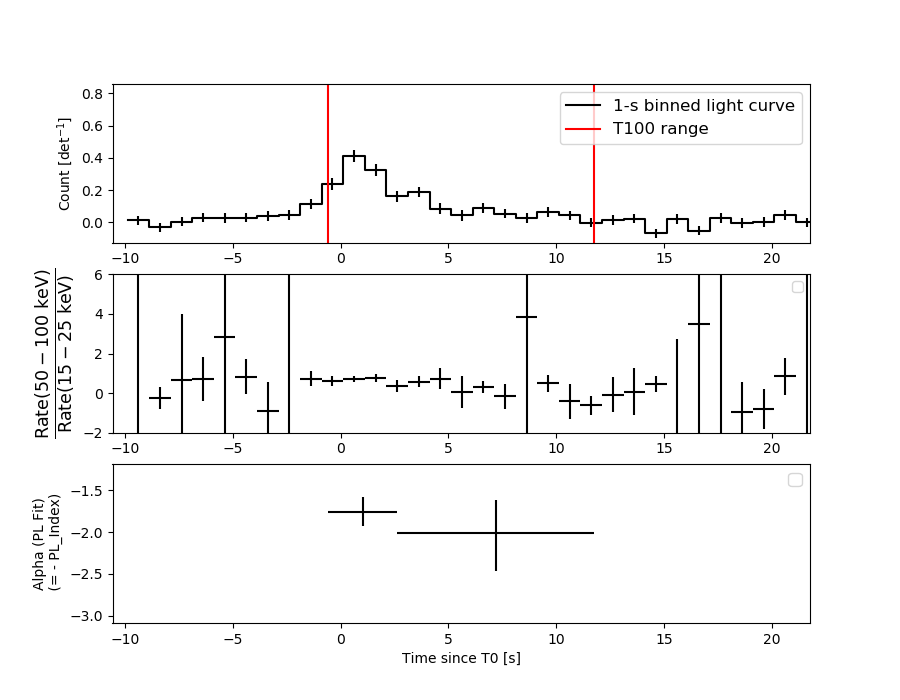
Distribution
T90 vs. Hardness ratio plot
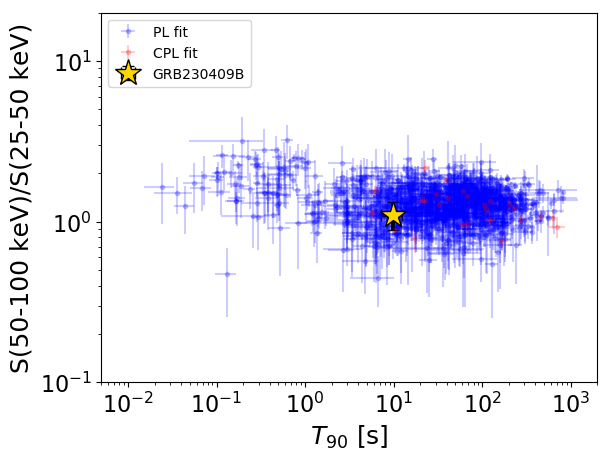
T90                                   = 9.792 sec.
Hardness ratio (energy fluence ratio) = 1.10542721616
S(15-50 keV) vs. S(50-150 keV) plot
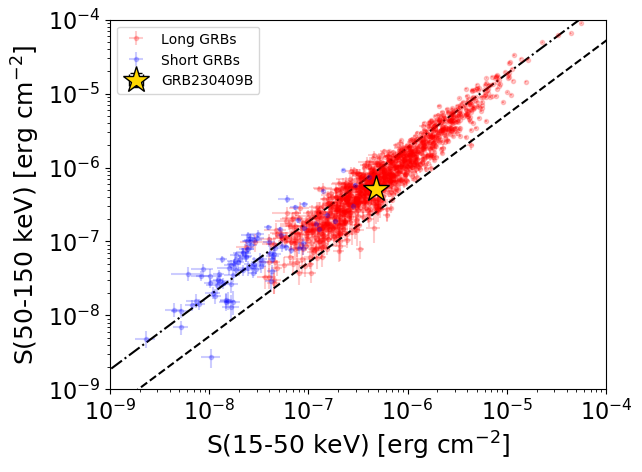
S(15-50 keV)  = 4.759607e-07
S(50-150 keV) = 5.128456e-07
The dash-dotted line and the dashed line traces the fluences calculated from the Band function with Epeak = 15 and 150 keV, respectively. Both lines assume a canonical values of alpha = -1 and beta = -2.5.
Mask shadow pattern
IMX = 2.526078347114099E-02, IMY = 5.585594125070563E-01
Spacecraft aspect plot
Bright source in the pre-burst/pre-slew/post-slew images
Pre-burst image of 15-350 keV band
Time interval of the image:
-239.872000 -0.576000

# RAcent  DECcent POSerr Theta    Phi  PeakCts   SNR AngSep     Name
#  [deg]    [deg]    ['] [deg]  [deg]                   [']
254.5079  35.5162    5.3  25.7   70.8   1.4781   2.2   10.7	Her X-1
288.8572  10.8875  458.4  44.7    5.9  -0.0181  -0.0    4.9	GRS 1915+105
299.5938  35.2101    1.4  24.3  -24.6   4.8307   7.9    0.5	Cyg X-1
308.1271  40.9246    3.7  23.7  -46.3   1.8913   3.1    1.8	Cyg X-3
326.2671  38.3628   10.3  35.6  -62.5   1.0164   1.1    5.1	Cyg X-2
265.5800   6.1869    2.3  49.9   37.2   8.6931   5.0 ------	UNKNOWN
303.3849  13.9596    3.3  45.1  -14.7   2.5964   3.5 ------	UNKNOWN
114.4706  78.0999    2.5  46.6 -164.6   4.9908   4.6 ------	UNKNOWN
Pre-slew background subtracted image of 15-350 keV band
Time interval of the image:
-0.576000 11.776000

# RAcent  DECcent POSerr Theta    Phi  PeakCts   SNR AngSep     Name
#  [deg]    [deg]    ['] [deg]  [deg]                   [']
254.4315  35.2561    8.9  25.9   70.6  -0.0968  -1.3    5.3	Her X-1
288.6743  10.9796    7.0  44.6    6.1   0.1923   1.7    7.6	GRS 1915+105
299.5210  35.3437    4.9  24.2  -24.6   0.1493   2.3    9.2	Cyg X-1
308.1582  40.8099   33.0  23.8  -46.2   0.0286   0.4    8.8	Cyg X-3
326.3367  38.2797    7.0  35.6  -62.5  -0.2271  -1.7    8.2	Cyg X-2
281.6375   9.4373    2.6  45.5   16.0   0.5172   4.4 ------	UNKNOWN
205.4831  70.3636    2.2  34.3  164.9   0.3995   5.2 ------	UNKNOWN
104.9955  67.3273    2.2  57.7 -163.0   2.1678   5.2 ------	UNKNOWN
329.5178  52.8342    0.8  29.2  -87.4   1.8008  14.3 ------	UNKNOWN
Post-slew image of 15-350 keV band
Time interval of the image:
84.428610 962.291500

# RAcent  DECcent POSerr Theta    Phi  PeakCts   SNR AngSep     Name
#  [deg]    [deg]    ['] [deg]  [deg]                   [']
288.7917  10.9450    9.6  53.1   22.1   5.1079   1.2    0.4	GRS 1915+105
299.5890  35.2117    1.2  27.5   30.9  18.4008   9.3    0.6	Cyg X-1
308.0426  40.9460    2.7  18.8   28.1   7.5823   4.3    3.1	Cyg X-3
326.2799  38.3971    6.9  14.6  -21.1   2.6546   1.7    6.8	Cyg X-2
 19.5186  63.7429    1.3  27.6 -164.0  15.3052   8.7 ------	UNKNOWN
320.2873  12.4119    2.8  41.1  -17.4   9.0994   4.1 ------	UNKNOWN