Analysis Summary
Notes:
- 1) No attempt has been made to eliminate the non-significant decimal places.
- 2) This batgrbproduct analysis is done using the HEASARC data.
- 3) This batgrbproduct analysis is using the flight position for the mask-weighting calculation.
======================================================================
BAT GRB EVENT DATA PROCESSING REPORT
Process Script Ver: batgrbproduct v2.48
Process Start Time: Wed Jun 14 15:02:18 EDT 2023
Host Name: batproc1
Current Working Dir: /local/data/bat1/alien/Swift_3rdBATcatalog/event/batevent_reproc/trigger1164180
======================================================================
Trigger: 01164180 Segment: 000
BAT Trigger Time: 703181692.352 [s; MET]
Trigger Stop: 703181700.544 [s; MET]
UTC: 2023-04-14T16:14:21.246980 [includes UTCF correction]
Where From?: TDRSS position message
BAT
RA: 181.071398844 Dec: 53.1268747077817 [deg; J2000]
Catalogged Source?: NO
Point Source?: YES
GRB Indicated?: YES [ by BAT flight software ]
Image S/N Ratio: 7.77
Image Trigger?: NO
Rate S/N Ratio: 11.4891252930761 [ if not an image trigger ]
Image S/N Ratio: 7.77
Analysis Position: [ source = BAT ]
RA: 181.071398844 Dec: 53.1268747077817 [deg; J2000]
Refined Position: [ source = BAT pre-slew burst ]
RA: 181.027130344276 Dec: 53.1921010010707 [deg; J2000]
{ 12h 04m 06.5s , +53d 11' 31.6" }
+/- 2.46760884578931 [arcmin] (estimated 90% radius based on SNR)
+/- 1.27389067923357 [arcmin] (formal 1-sigma fit error)
SNR: 8.36996495081363
Angular difference between the analysis and refined position is 4.225208 arcmin
Partial Coding Fraction: 0.8046875 [ including projection effects ]
Duration
T90: 29.0599999427795 +/- 7.74073911085516
Measured from: -0.0679999589920044
to: 28.9919999837875 [s; relative to TRIGTIME]
T50: 12.539999961853 +/- 8.64171837297098
Measured from: 2.67999994754791
to: 15.2199999094009 [s; relative to TRIGTIME]
Fluence
Peak Flux (peak 1 second)
Measured from: 9.30400002002716
to: 10.3040000200272 [s; relative to TRIGTIME]
Total Fluence
Measured from: -0.519999980926514
to: 35.2239999771118 [s; relative to TRIGTIME]
Band 1 Band 2 Band 3 Band 4
15-25 25-50 50-100 100-350 keV
Total 0.215802 0.368472 0.166028 0.070017
0.051725 0.053556 0.045742 0.038748 [error]
Peak 0.035608 0.025856 0.013699 0.008081
0.008796 0.009297 0.007896 0.006912 [error]
[ fluence units of on-axis counts / fully illuminated detector ]
======================================================================
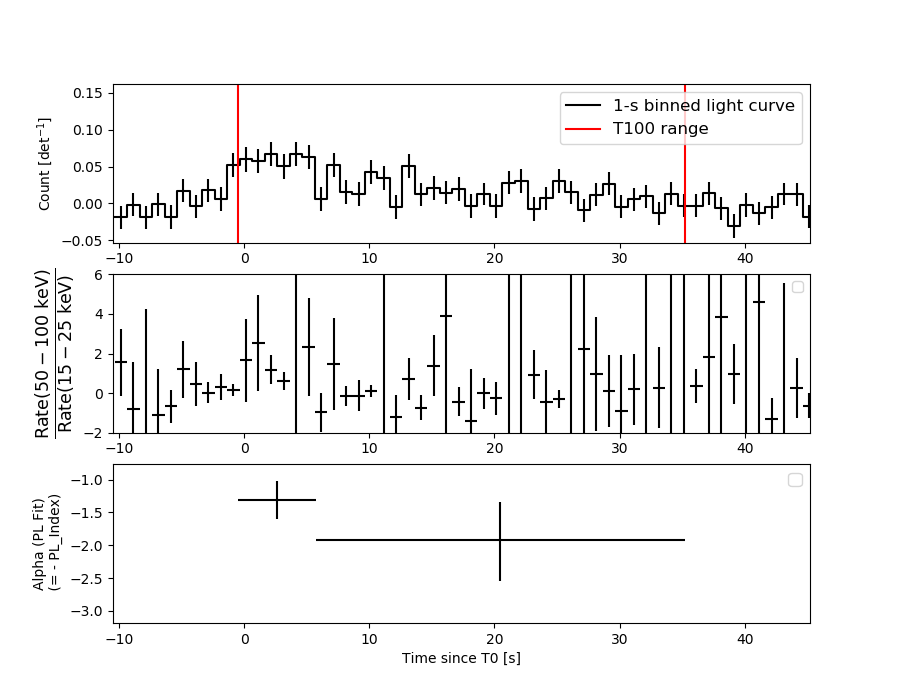
====== Table of the duration information =============================
Value tstart tstop
T100 35.744 -0.520 35.224
T90 29.060 -0.068 28.992
T50 12.540 2.680 15.220
Peak 1.000 9.304 10.304
====== Spectral Analysis Summary =====================================
Model : spectral model: simple power-law (PL) and cutoff power-law (CPL)
Ph_index : photon index: E^{Ph_index}
Ph_90err : 90% error of the photon index
Epeak : Epeak in keV
Epeak_90err: 90% error of Epeak
Norm : normalization at 50 keV in both the PL model and CPL model
Nomr_90err : 90% error of the normalization
chi2 : Chi-Squared
dof : degree of freedo
=== Time-averaged spectral analysis ===
(Best model with acceptable fit: PL)
Model Ph_index Ph_90err_low Ph_90err_hi Epeak Epeak_90err_low Epeak_90err_hi Norm Nomr_90err_low Norm_90err_hi chi2 dof
PL -1.604 -0.341 0.333 - - - 1.41e-03 -2.98e-04 2.90e-04 67.160 57
CPL -1.543 -1.130 1.566 312.809 -312.809 -312.809 1.54e-03 -4.18e-04 1.39e-02 67.190 56
=== 1-s peak spectral analysis ===
(Best model with acceptable fit: N/A)
Model Ph_index Ph_90err_low Ph_90err_hi Epeak Epeak_90err_low Epeak_90err_hi Norm Nomr_90err_low Norm_90err_hi chi2 dof
PL -2.264 -0.633 0.468 - - - 3.70e-03 -1.70e-03 1.64e-03 56.950 57
CPL 0.033 -2.037 4.492 34.306 -34.306 18.365 9.43e-02 -9.43e-02 1.66e+02 53.690 56
=== Fluence/Peak Flux Summary ===
Model Band1 Band2 Band3 Band4 Band5 Total
15-25 25-50 50-100 100-350 15-150 15-350 keV
Fluence PL 7.11e-08 1.23e-07 1.61e-07 4.32e-07 4.72e-07 7.87e-07 erg/cm2
90%_error_low -2.04e-08 -2.35e-08 -4.46e-08 -2.02e-07 -1.05e-07 -2.52e-07 erg/cm2
90%_error_hi 2.14e-08 2.34e-08 4.50e-08 3.01e-07 1.08e-07 3.33e-07 erg/cm2
Peak flux PL 3.19e-01 2.05e-01 8.50e-02 4.80e-02 6.33e-01 6.57e-01 ph/cm2/s
90%_error_low -1.15e-01 -7.08e-02 -4.56e-02 -4.80e-02 -2.04e-01 -2.14e-01 ph/cm2/s
90%_error_hi 1.20e-01 6.94e-02 5.01e-02 5.99e-02 2.04e-01 2.17e-01 ph/cm2/s
Fluence CPL 7.13e-08 1.22e-07 1.61e-07 4.44e-07 4.74e-07 7.27e-07 erg/cm2
90%_error_low -2.09e-08 -2.27e-08 -4.86e-08 -2.94e-07 -1.35e-07 -3.80e-07 erg/cm2
90%_error_hi 2.04e-08 2.49e-08 4.54e-08 1.38e-07 8.48e-08 3.77e-07 erg/cm2
Peak flux CPL 2.86e-01 2.78e-01 7.95e-02 4.46e-03 6.49e-01 6.48e-01 ph/cm2/s
90%_error_low -1.32e-01 -9.97e-02 -7.95e-02 -4.46e-03 -1.98e-01 -1.97e-01 ph/cm2/s
90%_error_hi 1.32e-01 1.06e-01 7.11e-02 4.59e-02 2.01e-01 2.03e-01 ph/cm2/s
======================================================================
Image
Pre-slew 15.0-350.0 keV image (Event data)
#   RAcent    DECcent   POSerr    Theta     Phi              Peak Cts       SNR   Name
  181.0271    53.1921   0.0229    20.4094   130.6616         0.8835266      8.370 TRIG_01164180

Foreground time interval of the image:
 -0.520  35.224 (delta_t =  35.744 [sec])
Background time interval of the image:
-239.352  -0.520 (delta_t = 238.832 [sec])
Light Curves
Note: The mask-weighted lightcurves have units of either count/det or counts/sec/det, where a det is 0.4 x 0.4 = 0.16 sq cm.
Full-time range; 1 s binning
Other quick-look light curves:
- 64 ms binning (zoomed)
- 16 ms binning (zoomed)
- 8 ms binning (zoomed)
- 2 ms binning (zoomed)
- SN=5 or 10 s binning (full-time range)
- Raw light curve
Spectra
- 64 ms binning (zoomed)
- 16 ms binning (zoomed)
- 8 ms binning (zoomed)
- 2 ms binning (zoomed)
- SN=5 or 10 s binning (full-time range)
- Raw light curve
Spectra
Notes:
- 1) The fitting includes the systematic errors.
- 2) When the burst includes telescope slew time periods, the fitting uses an average response file made from multiple 5-s response files through out the slew time plus single time preiod for the non-slew times, and weighted by the total counts in the corresponding time period using addrmf. An average response file is needed becuase a spectral fit using the pre-slew DRM will introduce some errors in both a spectral shape and a normalization if the PHA file contains a lot of the slew/post-slew time interval.
- 3) For fits to more complicated models (e.g. a power-law over a cutoff power-law), the BAT team has decided to require a chi-square improvement of more than 6 for each extra dof.
Time averaged spectrum fit using the average DRM
Power-law model
Time interval is from   -0.520 sec. to   35.224 sec.

Spectral model in power-law:
------------------------------------------------------------
Parameters  : value       lower 90%   higher 90%
Photon index: -1.60371     ( -0.340591   0.333233 )
Norm@50keV  : 1.41373E-03    ( -0.000298027   0.000290366 )
------------------------------------------------------------
#Fit statistic  : Chi-Squared                   67.16     using 59 bins.
 Reduced chi-squared = 1.17825
# Null hypothesis probability of 1.68e-01 with 57 degrees of freedom

Photon flux (15-150 keV)    in 35.74 sec: 0.181886 ( -0.034614  0.034627 ) ph/cm2/s
Energy fluence (15-150 keV)             : 4.72383e-07 ( -1.05274e-07  1.08308e-07 ) ergs/cm2
Cutoff power-law model

Time interval is from   -0.520 sec. to   35.224 sec.
Spectral model in the cutoff power-law:
------------------------------------------------------------
Parameters  : value       lower 90%   higher 90%
Photon index: -1.60199     ( -1.11981   1.57673 )
Epeak [keV] : 9998.81      ( -9999.18 -9999.18 )
Norm@50keV  : 1.41703E-03    ( -0.000300072   0.0139895 )
------------------------------------------------------------
#Fit statistic  : Chi-Squared                   67.16     using 59 bins.
 Reduced chi-squared = 1.19929
# Null hypothesis probability of 1.46e-01 with 56 degrees of freedom

Photon flux (15-150 keV)    in 35.74 sec: 0.181945 ( -0.034777  0.034569 ) ph/cm2/s
Energy fluence (15-150 keV)             : 4.73626e-07 ( -1.35379e-07  8.47724e-08 ) ergs/cm2
1-s peak spectrum fit
Power-law model
Time interval is from    9.304 sec. to   10.304 sec.

Spectral model in power-law:
------------------------------------------------------------
Parameters  : value       lower 90%   higher 90%
Photon index: -2.26395     ( -0.6252   0.476328 )
Norm@50keV  : 3.69730E-03    ( -0.00168637   0.00165098 )
------------------------------------------------------------
#Fit statistic  : Chi-Squared                   56.95     using 59 bins.
 Reduced chi-squared = 0.999123
# Null hypothesis probability of 4.77e-01 with 57 degrees of freedom

Photon flux (15-150 keV)    in 1 sec: 0.633270 ( -0.203646  0.204315 ) ph/cm2/s
Energy fluence (15-150 keV)             : 3.50332e-08 ( -1.33776e-08  1.42433e-08 ) ergs/cm2
Cutoff power-law model
Time interval is from    9.304 sec. to   10.304 sec.
Spectral model in the cutoff power-law:
------------------------------------------------------------
Parameters  : value       lower 90%   higher 90%
Photon index: 0.033365     ( -2.02906   4.50003 )
Epeak [keV] : 34.3059      ( -34.3409 18.3305 )
Norm@50keV  : 9.42711E-02    ( -0.0941262   166.324 )
------------------------------------------------------------
#Fit statistic  : Chi-Squared                   53.69     using 59 bins.
 Reduced chi-squared = 0.95875
# Null hypothesis probability of 5.63e-01 with 56 degrees of freedom

Photon flux (15-150 keV)    in 1 sec: 0.648766 ( -0.198458  0.200815 ) ph/cm2/s
Energy fluence (15-150 keV)             : 0 ( 0  0 ) ergs/cm2
Time-resolved spectra
Distribution
T90 vs. Hardness ratio plot
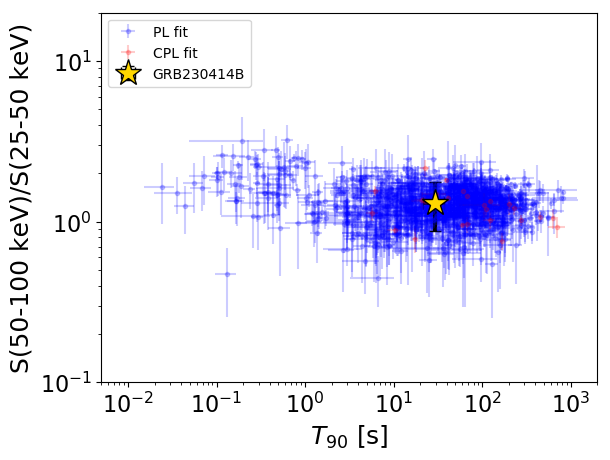
T90                                   = 29.06 sec.
Hardness ratio (energy fluence ratio) = 1.31616384037
S(15-50 keV) vs. S(50-150 keV) plot
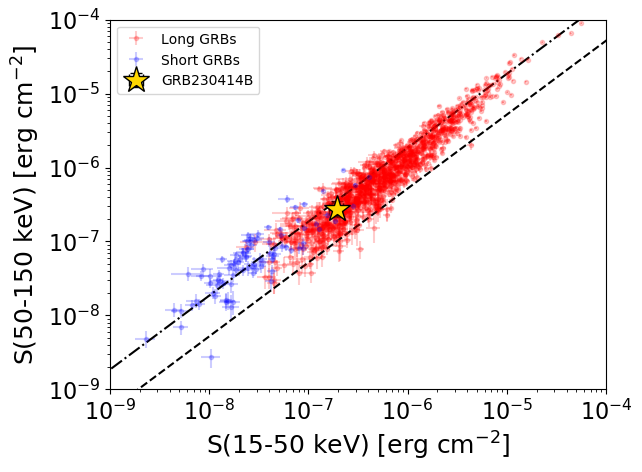
S(15-50 keV)  = 1.9377886e-07
S(50-150 keV) = 2.786064e-07
The dash-dotted line and the dashed line traces the fluences calculated from the Band function with Epeak = 15 and 150 keV, respectively. Both lines assume a canonical values of alpha = -1 and beta = -2.5.
Mask shadow pattern
IMX = -2.424463437888354E-01, IMY = -2.822522106552625E-01
Spacecraft aspect plot
Bright source in the pre-burst/pre-slew/post-slew images
Pre-burst image of 15-350 keV band
Time interval of the image:
-239.352000 -0.520000

# RAcent  DECcent POSerr Theta    Phi  PeakCts   SNR AngSep     Name
#  [deg]    [deg]    ['] [deg]  [deg]                   [']
254.4565  35.3494    4.1  42.2   17.6   1.3375   2.8    0.4	Her X-1
204.3499  37.8068    2.4  31.6   84.7   3.2460   4.7 ------	UNKNOWN
215.6170  59.7869    2.7  10.0   57.1   1.5057   4.3 ------	UNKNOWN
282.4145  37.3379    2.5  49.9  -12.1   2.9838   4.6 ------	UNKNOWN
251.3616  84.0397    2.3  16.8  -87.0   2.1626   4.9 ------	UNKNOWN
291.4232  44.2870    2.7  46.9  -24.4   3.0628   4.3 ------	UNKNOWN
 32.5872  72.1868    3.4  38.5 -103.3   4.3240   3.4 ------	UNKNOWN
 79.4618  54.1716    2.6  51.0 -137.1   8.0364   4.4 ------	UNKNOWN
335.9958  63.0035    2.9  42.7  -69.2   5.7650   4.0 ------	UNKNOWN
Pre-slew background subtracted image of 15-350 keV band
Time interval of the image:
-0.520000 35.224000

# RAcent  DECcent POSerr Theta    Phi  PeakCts   SNR AngSep     Name
#  [deg]    [deg]    ['] [deg]  [deg]                   [']
254.4728  35.2907   10.5  42.3   17.6   0.1754   1.1    3.2	Her X-1
154.9408  30.0857    2.3  49.3  145.0   2.0783   4.9 ------	UNKNOWN
181.0271  53.1921    1.4  20.4  130.7   0.8837   8.4 ------	UNKNOWN
291.5811  49.6258    2.3  42.3  -28.4   0.7708   5.1 ------	UNKNOWN
314.7229  63.2811    2.3  37.8  -56.5   0.9214   5.0 ------	UNKNOWN
 65.8581  63.6389    2.0  44.5 -124.0   2.1315   5.7 ------	UNKNOWN
Post-slew image of 15-350 keV band
Time interval of the image:
111.148630 962.768000

# RAcent  DECcent POSerr Theta    Phi  PeakCts   SNR AngSep     Name
#  [deg]    [deg]    ['] [deg]  [deg]                   [']
254.4665  35.2940    3.6  53.0   12.2   6.7177   3.2    2.9	Her X-1
234.2373  22.6373    2.9  50.2   39.8  12.1938   4.0 ------	UNKNOWN
197.2696  24.0234    2.8  31.6   84.7   8.9850   4.1 ------	UNKNOWN
193.4065  46.9192    2.6  10.0   57.1   5.1528   4.5 ------	UNKNOWN
 67.0887  81.0806    3.8  41.2  -78.7  13.7538   3.1 ------	UNKNOWN