Analysis Summary
Notes:
- 1) No attempt has been made to eliminate the non-significant decimal places.
- 2) This batgrbproduct analysis is done using the HEASARC data.
- 3) This batgrbproduct analysis is using the flight position for the mask-weighting calculation.
======================================================================
                  BAT GRB EVENT DATA PROCESSING REPORT
    Process Script Ver: batgrbproduct v2.48
    Process Start Time: Wed Jun 14 15:01:00 EDT 2023
             Host Name: batproc1
   Current Working Dir: /local/data/bat1/alien/Swift_3rdBATcatalog/event/batevent_reproc/trigger1164980
======================================================================

  Trigger: 01164980      Segment: 000

  BAT Trigger Time: 703678772.224   [s; MET]
      Trigger Stop: 703678776.32   [s; MET]
               UTC: 2023-04-20T10:19:01.085120    [includes UTCF correction]
       Where From?: TDRSS position message

  BAT
    RA: 161.013191653554   Dec: 32.0865774853194  [deg; J2000]

     Catalogged Source?: NO
     Point Source?:      YES
     GRB Indicated?:     YES    [ by BAT flight software ]
     Image S/N Ratio:    7.98
     Image Trigger?:     NO
     Rate S/N Ratio:     11.8743420870379  [ if not an image trigger ]
     Image S/N Ratio:    7.98

  Analysis Position:   [ source = BAT ]
    RA: 161.013191653554   Dec: 32.0865774853194  [deg; J2000]

  Refined Position:   [ source = BAT pre-slew burst ]
    RA: 161.038809668405   Dec: 32.1063487867989  [deg; J2000]
        { 10h 44m 09.3s , +32d 06' 22.9" }
         +/- 1.44648280624915 [arcmin] (estimated 90% radius based on SNR)
         +/- 0.620898497071233 [arcmin] (formal 1-sigma fit error)
    SNR: 17.9514450758647

  Angular difference between the analysis and refined position is 1.761487 arcmin

  Partial Coding Fraction: 1.03125    [ including projection effects ]

  Duration
     T90: 111.947999954224 +/- 11.9286545948353
        Measured from: -23.1999999284744
                   to: 88.7480000257492     [s; relative to TRIGTIME]
     T50: 56.0119999647141 +/- 6.8337339828217
        Measured from: 4
                   to: 60.0119999647141     [s; relative to TRIGTIME]


  Fluence
     Peak Flux  (peak 1 second)
        Measured from: 1.41200006008148
                   to: 2.41200006008148     [s; relative to TRIGTIME]
     Total Fluence
        Measured from: -34.135999917984
                   to: 100.920000076294     [s; relative to TRIGTIME]

             Band 1     Band 2     Band 3     Band 4
              15-25      25-50     50-100    100-350     keV
 Total     1.443527   2.043745   1.212035   0.203400
           0.092693   0.095795   0.082834   0.070103 [error]
 Peak      0.033753   0.046634   0.042845   0.004048
           0.008481   0.008740   0.007999   0.006245 [error]

     [ fluence units of on-axis counts / fully illuminated detector ]

======================================================================


====== Table of the duration information =============================

        Value   tstart    tstop
T100  135.056  -34.136  100.920
T90   111.948  -23.200   88.748
T50    56.012    4.000   60.012
Peak    1.000    1.412    2.412


====== Spectral Analysis Summary =====================================

Model      : spectral model: simple power-law (PL) and cutoff power-law (CPL)
Ph_index   : photon index: E^{Ph_index}
Ph_90err   : 90% error of the photon index
Epeak      : Epeak in keV
Epeak_90err: 90% error of Epeak
Norm       : normalization at 50 keV in both the PL model and CPL model
Nomr_90err : 90% error of the normalization
chi2       : Chi-Squared
dof        : degree of freedo

=== Time-averaged spectral analysis ===
(Best model with acceptable fit: CPL)

Model Ph_index Ph_90err_low Ph_90err_hi  Epeak  Epeak_90err_low  Epeak_90err_hi  Norm       Nomr_90err_low    Norm_90err_hi    chi2    dof
PL      -1.641    -0.102      0.101       -           -               -         2.26e-03     -1.39e-04          1.39e-04      62.600   57
CPL     -0.960    -0.430      0.483       70.413     -13.181        42.436      5.24e-03     -2.12e-03          4.20e-03      54.810   56


=== 1-s peak spectral analysis ===
(Best model with acceptable fit: PL)

Model Ph_index Ph_90err_low Ph_90err_hi  Epeak  Epeak_90err_low  Epeak_90err_hi  Norm       Nomr_90err_low    Norm_90err_hi    chi2    dof
PL      -1.368     -0.317     0.309       -           -               -         7.94e-03     -1.61e-03          1.60e-03      58.370   57
CPL      1.067     -1.808     3.533       67.466     -13.166        42.600      1.09e-01     -1.09e-01          3.37e+00      52.370   56


=== Fluence/Peak Flux Summary ===

              Model    Band1     Band2     Band3     Band4     Band5     Total
                       15-25     25-50    50-100    100-350    15-150    15-350    keV
Fluence         PL   4.46e-07  7.51e-07  9.64e-07  2.49e-06  2.85e-06  4.65e-06   erg/cm2
      90%_error_low -4.08e-08 -4.38e-08 -7.90e-08 -4.01e-07 -1.87e-07 -4.74e-07   erg/cm2
      90%_error_hi   4.18e-08  4.38e-08  7.92e-08  4.50e-07  1.89e-07  5.14e-07   erg/cm2
Peak flux       PL   2.88e-01  3.13e-01  2.43e-01  3.09e-01  9.60e-01  1.15e+00   ph/cm2/s
      90%_error_low -8.86e-02 -6.67e-02 -5.94e-02 -1.27e-01 -1.92e-01 -2.37e-01   ph/cm2/s
      90%_error_hi   9.71e-02  6.61e-02  5.88e-02  1.67e-01  1.93e-01  2.42e-01   ph/cm2/s

Fluence        CPL   4.07e-07  8.09e-07  9.71e-07  8.94e-07  2.66e-06  3.08e-06   erg/cm2
      90%_error_low -4.75e-08 -5.67e-08 -8.82e-08 -3.92e-07 -2.16e-07 -4.48e-07   erg/cm2
      90%_error_hi   4.80e-08  5.81e-08  8.73e-08  7.44e-07  2.19e-07  7.61e-07   erg/cm2
Peak flux      CPL   1.62e-01  3.60e-01  3.01e-01  6.53e-02  8.78e-01  8.88e-01   ph/cm2/s
      90%_error_low -1.62e-01 -8.86e-02 -7.89e-02 -6.53e-02 -2.12e-01 -2.20e-01   ph/cm2/s
      90%_error_hi   1.31e-01  8.71e-02  8.34e-02  1.26e-01  2.07e-01  2.31e-01   ph/cm2/s

======================================================================
Image
Pre-slew 15.0-350.0 keV image (Event data)
#   RAcent    DECcent   POSerr    Theta     Phi              Peak Cts       SNR   Name
  161.0388    32.1063   0.0107    10.4531  -162.7648         2.5773292     17.951 TRIG_01164980

Foreground time interval of the image:
-34.136  38.077 (delta_t =  72.213 [sec])
Background time interval of the image:
-239.224 -34.136 (delta_t = 205.088 [sec])
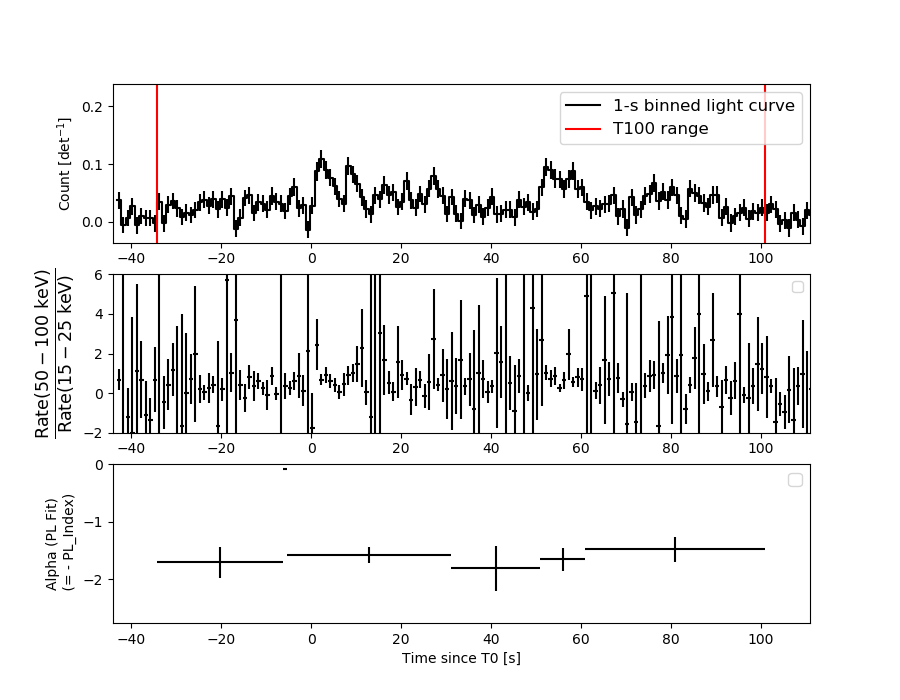
Light Curves
Note: The mask-weighted lightcurves have units of either count/det or counts/sec/det, where a det is 0.4 x 0.4 = 0.16 sq cm.
Full-time range; 1 s binning
Other quick-look light curves:
- 64 ms binning (zoomed)
- 16 ms binning (zoomed)
- 8 ms binning (zoomed)
- 2 ms binning (zoomed)
- SN=5 or 10 s binning (full-time range)
- Raw light curve
Spectra
- 64 ms binning (zoomed)
- 16 ms binning (zoomed)
- 8 ms binning (zoomed)
- 2 ms binning (zoomed)
- SN=5 or 10 s binning (full-time range)
- Raw light curve
Spectra
Notes:
- 1) The fitting includes the systematic errors.
- 2) When the burst includes telescope slew time periods, the fitting uses an average response file made from multiple 5-s response files through out the slew time plus single time preiod for the non-slew times, and weighted by the total counts in the corresponding time period using addrmf. An average response file is needed becuase a spectral fit using the pre-slew DRM will introduce some errors in both a spectral shape and a normalization if the PHA file contains a lot of the slew/post-slew time interval.
- 3) For fits to more complicated models (e.g. a power-law over a cutoff power-law), the BAT team has decided to require a chi-square improvement of more than 6 for each extra dof.
Time averaged spectrum fit using the average DRM
Power-law model
Time interval is from  -34.136 sec. to  100.920 sec.

Spectral model in power-law:
------------------------------------------------------------
Parameters  : value       lower 90%   higher 90%
Photon index: -1.64066     ( -0.102242   0.101131 )
Norm@50keV  : 2.26286E-03    ( -0.000139385   0.000138556 )
------------------------------------------------------------
#Fit statistic  : Chi-Squared                   62.60     using 59 bins.
 Reduced chi-squared = 1.09825
# Null hypothesis probability of 2.84e-01 with 57 degrees of freedom

Photon flux (15-150 keV)    in 135.1 sec: 0.294581 ( -0.017131  0.017145 ) ph/cm2/s
Energy fluence (15-150 keV)             : 2.84633e-06 ( -1.86855e-07  1.88579e-07 ) ergs/cm2
Cutoff power-law model
Time interval is from  -34.136 sec. to  100.920 sec.
Spectral model in the cutoff power-law:
------------------------------------------------------------
Parameters  : value       lower 90%   higher 90%
Photon index: -0.959623     ( -0.429504   0.482533 )
Epeak [keV] : 70.4133      ( -13.181 42.4359 )
Norm@50keV  : 5.24150E-03    ( -0.00211875   0.00420445 )
------------------------------------------------------------
#Fit statistic  : Chi-Squared                   54.81     using 59 bins.
 Reduced chi-squared = 0.97875
# Null hypothesis probability of 5.20e-01 with 56 degrees of freedom

Photon flux (15-150 keV)    in 135.1 sec: 0.285134 ( -0.01809  0.018084 ) ph/cm2/s
Energy fluence (15-150 keV)             : 2.66119e-06 ( -2.16432e-07  2.19032e-07 ) ergs/cm2
1-s peak spectrum fit
Power-law model
Time interval is from    1.412 sec. to    2.412 sec.

Spectral model in power-law:
------------------------------------------------------------
Parameters  : value       lower 90%   higher 90%
Photon index: -1.36761     ( -0.317272   0.3089 )
Norm@50keV  : 7.93802E-03    ( -0.00161299   0.00160433 )
------------------------------------------------------------
#Fit statistic  : Chi-Squared                   58.37     using 59 bins.
 Reduced chi-squared = 1.02404
# Null hypothesis probability of 4.25e-01 with 57 degrees of freedom

Photon flux (15-150 keV)    in 1 sec: 0.959863 ( -0.192459  0.192737 ) ph/cm2/s
Energy fluence (15-150 keV)             : 7.72343e-08 ( -1.7193e-08  1.74832e-08 ) ergs/cm2
Cutoff power-law model
Time interval is from    1.412 sec. to    2.412 sec.
Spectral model in the cutoff power-law:
------------------------------------------------------------
Parameters  : value       lower 90%   higher 90%
Photon index: 1.06728     ( -1.83113   3.51049 )
Epeak [keV] : 67.4664      ( -13.0517 42.714 )
Norm@50keV  : 0.109110    ( -0.112822   3.3634 )
------------------------------------------------------------
#Fit statistic  : Chi-Squared                   52.37     using 59 bins.
 Reduced chi-squared = 0.935179
# Null hypothesis probability of 6.13e-01 with 56 degrees of freedom

Photon flux (15-150 keV)    in 1 sec: 0.877890 ( -0.21178  0.20664 ) ph/cm2/s
Energy fluence (15-150 keV)             : 3.53411e-08 ( -1.85209e-08  1.42085e-08 ) ergs/cm2
Time-resolved spectra
Distribution
T90 vs. Hardness ratio plot
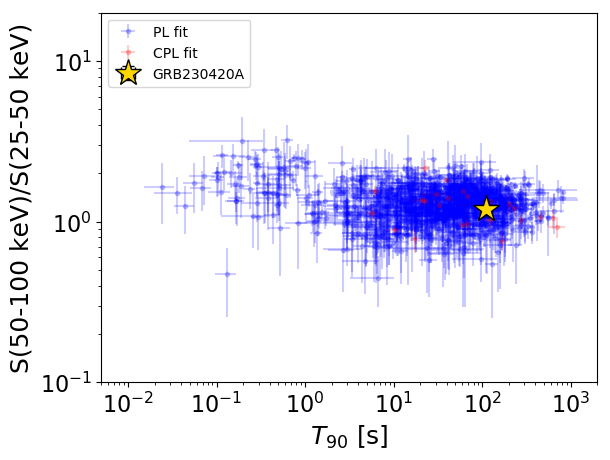
T90                                   = 111.948 sec.
Hardness ratio (energy fluence ratio) = 1.20104699534
S(15-50 keV) vs. S(50-150 keV) plot
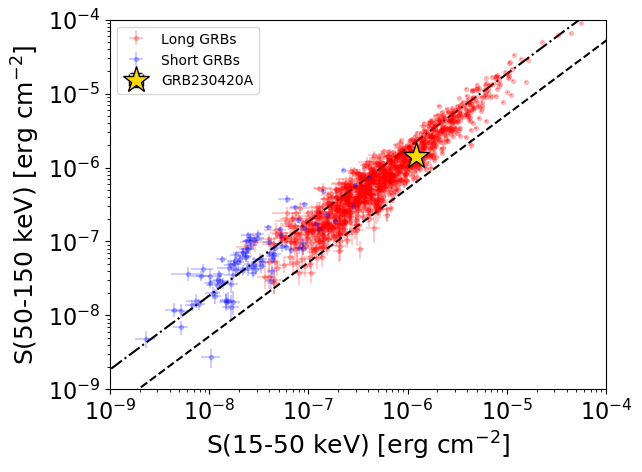
S(15-50 keV)  = 1.2156404e-06
S(50-150 keV) = 1.4455418e-06
The dash-dotted line and the dashed line traces the fluences calculated from the Band function with Epeak = 15 and 150 keV, respectively. Both lines assume a canonical values of alpha = -1 and beta = -2.5.
Mask shadow pattern
IMX = -1.762085707032564E-01, IMY = 5.466435392643043E-02
Spacecraft aspect plot
Bright source in the pre-burst/pre-slew/post-slew images
Pre-burst image of 15-350 keV band
Time interval of the image:
-239.224000 -34.136000

# RAcent  DECcent POSerr Theta    Phi  PeakCts   SNR AngSep     Name
#  [deg]    [deg]    ['] [deg]  [deg]                   [']
174.7132   7.8649    2.5  29.3  127.2   2.2598   4.7 ------	UNKNOWN
221.0907  68.7092    2.4  41.2  -23.3   2.6019   4.8 ------	UNKNOWN
119.9545  56.0931    2.7  39.4  -91.8   5.7377   4.2 ------	UNKNOWN
119.5392  64.7229    2.9  41.3  -78.8   5.4382   4.1 ------	UNKNOWN
Pre-slew background subtracted image of 15-350 keV band
Time interval of the image:
-34.136000 38.076590

# RAcent  DECcent POSerr Theta    Phi  PeakCts   SNR AngSep     Name
#  [deg]    [deg]    ['] [deg]  [deg]                   [']
189.0577  -0.2863    2.4  40.5  105.7   3.0409   4.8 ------	UNKNOWN
179.8089  19.2726    2.1  19.0  109.7   0.9370   5.5 ------	UNKNOWN
203.6270  47.4348    2.1  25.2    8.0   0.8387   5.7 ------	UNKNOWN
194.6365  44.9114    2.3  18.6   10.2   0.7361   5.0 ------	UNKNOWN
161.0388  32.1064    0.6  10.5 -162.8   2.5765  17.9 ------	UNKNOWN
138.4734  40.4544    2.8  26.4 -119.9   0.8414   4.1 ------	UNKNOWN
Post-slew image of 15-350 keV band
Time interval of the image:
79.676600 962.886000

# RAcent  DECcent POSerr Theta    Phi  PeakCts   SNR AngSep     Name
#  [deg]    [deg]    ['] [deg]  [deg]                   [']
204.0854  17.1520    2.4  41.6   64.5  16.4995   4.9 ------	UNKNOWN
188.5688  13.0582    2.4  31.6   84.7  11.0419   4.8 ------	UNKNOWN
132.3088   1.1142    3.4  41.1 -169.1   7.0926   3.4 ------	UNKNOWN
150.8505  81.5009    2.5  49.5  -38.0  21.2138   4.6 ------	UNKNOWN