Analysis Summary
Notes:
- 1) No attempt has been made to eliminate the non-significant decimal places.
- 2) This batgrbproduct analysis is done using the HEASARC data.
- 3) This batgrbproduct analysis is using the flight position for the mask-weighting calculation.
======================================================================
BAT GRB EVENT DATA PROCESSING REPORT
Process Script Ver: batgrbproduct v2.48
Process Start Time: Wed Jun 14 14:59:49 EDT 2023
Host Name: batproc1
Current Working Dir: /local/data/bat1/alien/Swift_3rdBATcatalog/event/batevent_reproc/trigger1165354
======================================================================
Trigger: 01165354 Segment: 000
BAT Trigger Time: 703969706.624 [s; MET]
Trigger Stop: 703969718.784 [s; MET]
UTC: 2023-04-23T19:07:55.465280 [includes UTCF correction]
Where From?: TDRSS position message
BAT
RA: 122.604962807057 Dec: -21.9203287405549 [deg; J2000]
Catalogged Source?: NO
Point Source?: YES
GRB Indicated?: YES [ by BAT flight software ]
Image S/N Ratio: 7.3
Image Trigger?: NO
Rate S/N Ratio: 8.60232526704263 [ if not an image trigger ]
Image S/N Ratio: 7.3
Analysis Position: [ source = BAT ]
RA: 122.604962807057 Dec: -21.9203287405549 [deg; J2000]
Refined Position: [ source = BAT pre-slew burst ]
RA: 122.617613108822 Dec: -21.90101311814 [deg; J2000]
{ 08h 10m 28.2s , -21d 54' 03.6" }
+/- 2.31936388783496 [arcmin] (estimated 90% radius based on SNR)
+/- 1.1251900313376 [arcmin] (formal 1-sigma fit error)
SNR: 9.14456016139219
Angular difference between the analysis and refined position is 1.356105 arcmin
Partial Coding Fraction: 1.03125 [ including projection effects ]
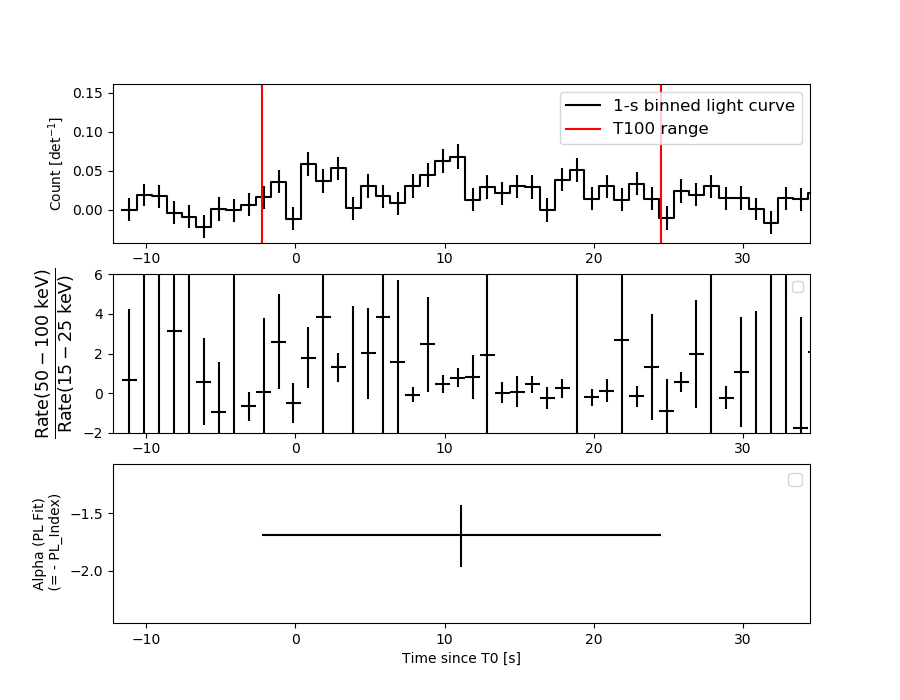
Duration
T90: 23.6039999723434 +/- 4.27154537102887
Measured from: -0.659999966621399
to: 22.944000005722 [s; relative to TRIGTIME]
T50: 13.5759999752045 +/- 5.71036467937035
Measured from: 3.89600002765656
to: 17.472000002861 [s; relative to TRIGTIME]
Fluence
Peak Flux (peak 1 second)
Measured from: 10.6240000724792
to: 11.6240000724792 [s; relative to TRIGTIME]
Total Fluence
Measured from: -2.25199997425079
to: 24.4920001029968 [s; relative to TRIGTIME]
Band 1 Band 2 Band 3 Band 4
15-25 25-50 50-100 100-350 keV
Total 0.223083 0.360289 0.195658 -0.002772
0.041995 0.043384 0.037300 0.032194 [error]
Peak 0.022458 0.037889 0.011594 0.001708
0.008410 0.008686 0.007360 0.006693 [error]
[ fluence units of on-axis counts / fully illuminated detector ]
======================================================================
====== Table of the duration information =============================
Value tstart tstop
T100 26.744 -2.252 24.492
T90 23.604 -0.660 22.944
T50 13.576 3.896 17.472
Peak 1.000 10.624 11.624
====== Spectral Analysis Summary =====================================
Model : spectral model: simple power-law (PL) and cutoff power-law (CPL)
Ph_index : photon index: E^{Ph_index}
Ph_90err : 90% error of the photon index
Epeak : Epeak in keV
Epeak_90err: 90% error of Epeak
Norm : normalization at 50 keV in both the PL model and CPL model
Nomr_90err : 90% error of the normalization
chi2 : Chi-Squared
dof : degree of freedo
=== Time-averaged spectral analysis ===
(Best model with acceptable fit: PL)
Model Ph_index Ph_90err_low Ph_90err_hi Epeak Epeak_90err_low Epeak_90err_hi Norm Nomr_90err_low Norm_90err_hi chi2 dof
PL -1.691 -0.274 0.260 - - - 1.86e-03 -3.18e-04 3.10e-04 43.530 57
CPL -1.257 -0.761 1.290 76.719 -54.442 -76.719 3.24e-03 -3.24e-03 1.38e-02 43.010 56
=== 1-s peak spectral analysis ===
(Best model with acceptable fit: N/A)
Model Ph_index Ph_90err_low Ph_90err_hi Epeak Epeak_90err_low Epeak_90err_hi Norm Nomr_90err_low Norm_90err_hi chi2 dof
PL -2.015 -0.698 0.548 - - - 3.88e-03 -1.75e-03 1.65e-03 57.980 57
CPL 0.688 -2.911 -0.688 40.450 -40.450 -40.450 1.45e-01 -1.45e-01 4.57e+04 56.060 56
=== Fluence/Peak Flux Summary ===
Model Band1 Band2 Band3 Band4 Band5 Total
15-25 25-50 50-100 100-350 15-150 15-350 keV
Fluence PL 7.60e-08 1.24e-07 1.54e-07 3.78e-07 4.61e-07 7.32e-07 erg/cm2
90%_error_low -1.65e-08 -1.83e-08 -3.52e-08 -1.50e-07 -8.19e-08 -1.89e-07 erg/cm2
90%_error_hi 1.72e-08 1.83e-08 3.54e-08 2.04e-07 8.40e-08 2.34e-07 erg/cm2
Peak flux PL 2.62e-01 1.95e-01 9.65e-02 6.81e-02 5.86e-01 6.22e-01 ph/cm2/s
90%_error_low -1.06e-01 -6.51e-02 -5.24e-02 -6.81e-02 -1.89e-01 -2.06e-01 ph/cm2/s
90%_error_hi 1.13e-01 6.42e-02 5.63e-02 9.51e-02 1.90e-01 2.10e-01 ph/cm2/s
Fluence CPL 7.26e-08 1.31e-07 1.54e-07 1.82e-07 4.41e-07 5.40e-07 erg/cm2
90%_error_low -1.87e-08 -2.22e-08 -3.90e-08 -1.47e-07 -9.28e-08 -1.80e-07 erg/cm2
90%_error_hi 1.89e-08 2.57e-08 3.79e-08 3.75e-07 9.49e-08 2.70e-07 erg/cm2
Peak flux CPL 1.92e-01 2.67e-01 8.61e-02 3.35e-03 5.49e-01 5.49e-01 ph/cm2/s
90%_error_low -1.92e-01 -1.07e-01 -6.13e-02 -3.35e-03 -1.99e-01 -1.99e-01 ph/cm2/s
90%_error_hi 1.46e-01 1.14e-01 7.07e-02 5.52e-02 1.95e-01 1.97e-01 ph/cm2/s
======================================================================
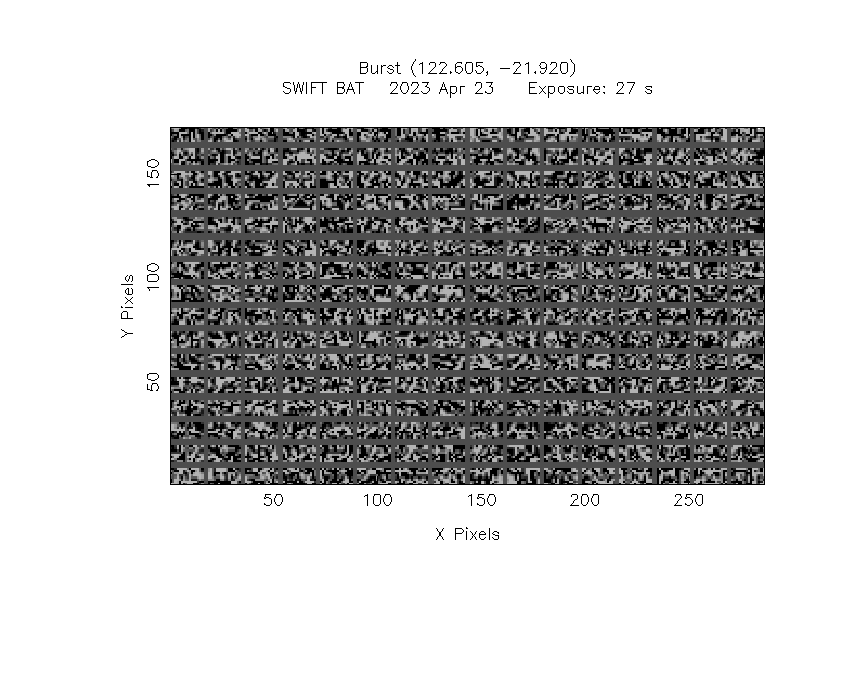
Image
Pre-slew 15.0-350.0 keV image (Event data)
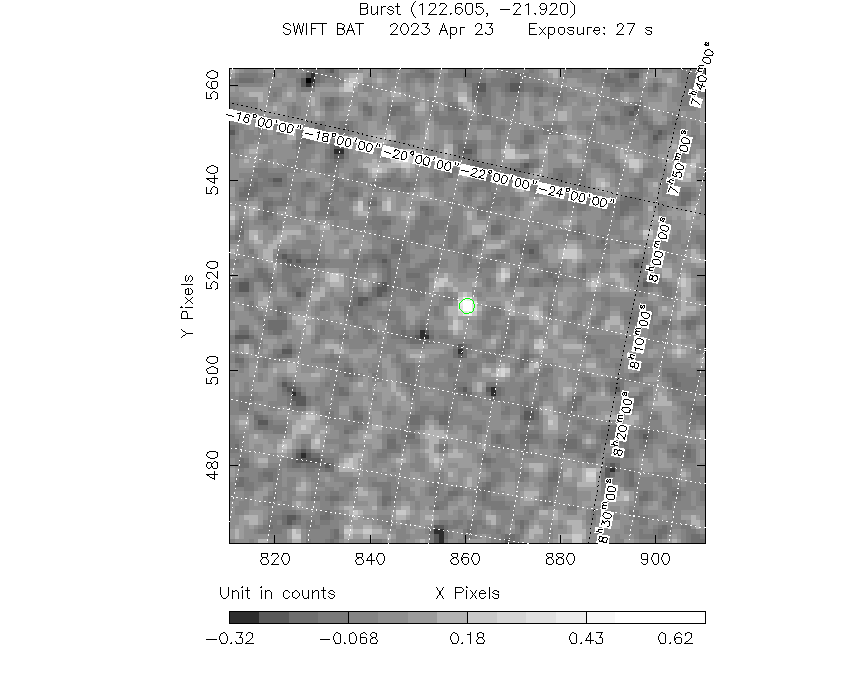
#   RAcent    DECcent   POSerr    Theta     Phi              Peak Cts       SNR   Name
  122.6176   -21.9010   0.0211     4.9926   -62.4655         0.7312292      9.145 TRIG_01165354

Foreground time interval of the image:
 -2.252  24.492 (delta_t =  26.744 [sec])
Background time interval of the image:
-239.624  -2.252 (delta_t = 237.372 [sec])
Light Curves
Note: The mask-weighted lightcurves have units of either count/det or counts/sec/det, where a det is 0.4 x 0.4 = 0.16 sq cm.
Full-time range; 1 s binning
Other quick-look light curves:
- 64 ms binning (zoomed)
- 16 ms binning (zoomed)
- 8 ms binning (zoomed)
- 2 ms binning (zoomed)
- SN=5 or 10 s binning (full-time range)
- Raw light curve
Spectra
- 64 ms binning (zoomed)
- 16 ms binning (zoomed)
- 8 ms binning (zoomed)
- 2 ms binning (zoomed)
- SN=5 or 10 s binning (full-time range)
- Raw light curve
Spectra
Notes:
- 1) The fitting includes the systematic errors.
- 2) When the burst includes telescope slew time periods, the fitting uses an average response file made from multiple 5-s response files through out the slew time plus single time preiod for the non-slew times, and weighted by the total counts in the corresponding time period using addrmf. An average response file is needed becuase a spectral fit using the pre-slew DRM will introduce some errors in both a spectral shape and a normalization if the PHA file contains a lot of the slew/post-slew time interval.
- 3) For fits to more complicated models (e.g. a power-law over a cutoff power-law), the BAT team has decided to require a chi-square improvement of more than 6 for each extra dof.
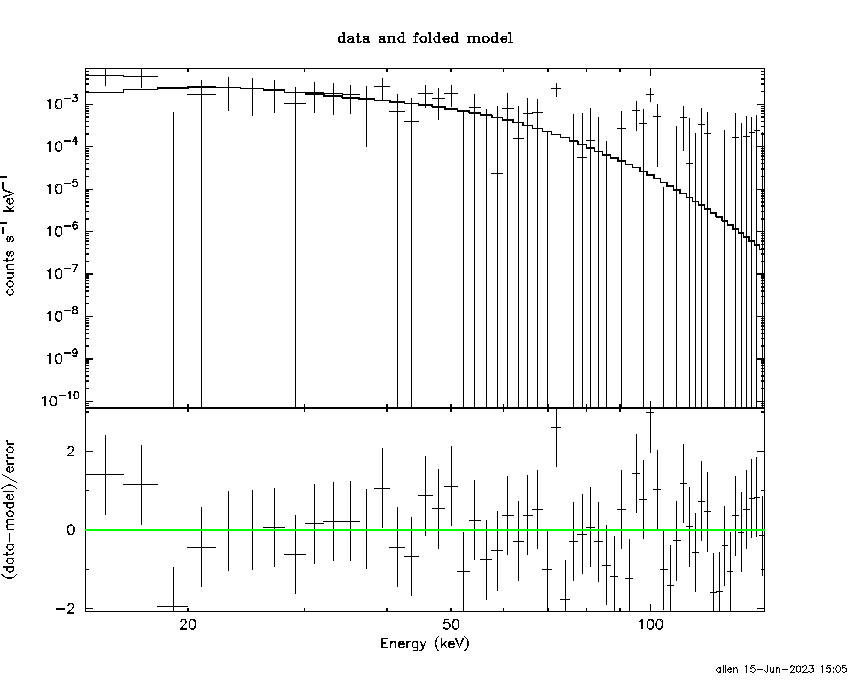
Time averaged spectrum fit using the average DRM
Power-law model
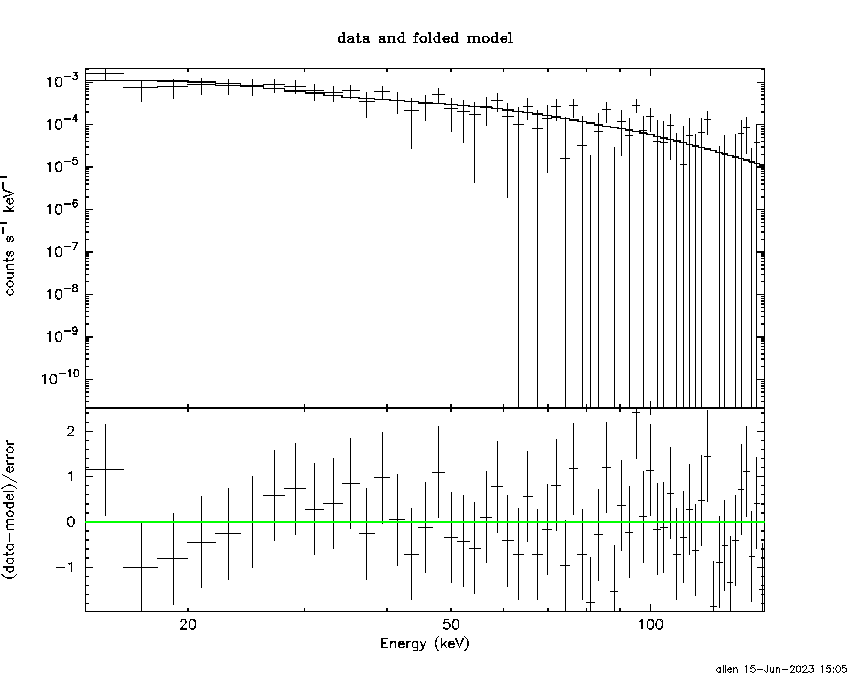
Time interval is from   -2.252 sec. to   24.492 sec.

Spectral model in power-law:
------------------------------------------------------------
Parameters  : value       lower 90%   higher 90%
Photon index: -1.69125     ( -0.27396   0.260047 )
Norm@50keV  : 1.86039E-03    ( -0.000318406   0.000310013 )
------------------------------------------------------------
#Fit statistic  : Chi-Squared                   43.53     using 59 bins.
 Reduced chi-squared = 0.763684
# Null hypothesis probability of 9.05e-01 with 57 degrees of freedom

Photon flux (15-150 keV)    in 26.74 sec: 0.246340 ( -0.036356  0.036363 ) ph/cm2/s
Energy fluence (15-150 keV)             : 4.6099e-07 ( -8.18656e-08  8.39663e-08 ) ergs/cm2
Cutoff power-law model
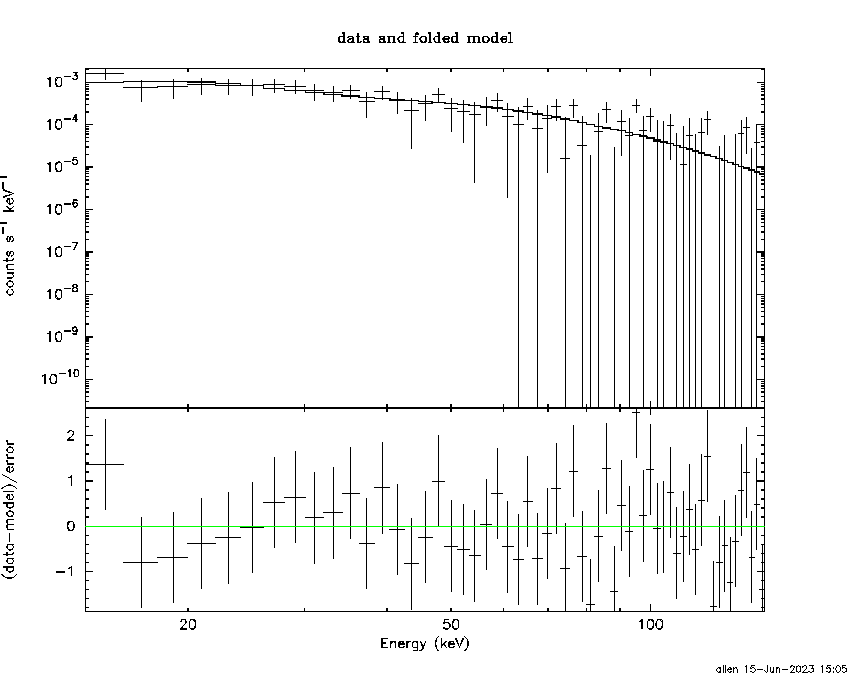
Time interval is from   -2.252 sec. to   24.492 sec.
Spectral model in the cutoff power-law:
------------------------------------------------------------
Parameters  : value       lower 90%   higher 90%
Photon index: -1.25654     ( -0.761451   1.29018 )
Epeak [keV] : 76.7188      ( -54.4419 -76.7188 )
Norm@50keV  : 3.23539E-03    ( -0.00323539   0.0137951 )
------------------------------------------------------------
#Fit statistic  : Chi-Squared                   43.01     using 59 bins.
 Reduced chi-squared = 0.768036
# Null hypothesis probability of 8.99e-01 with 56 degrees of freedom

Photon flux (15-150 keV)    in 26.74 sec: 0.242321 ( -0.037623  0.037526 ) ph/cm2/s
Energy fluence (15-150 keV)             : 4.41255e-07 ( -9.27966e-08  9.48513e-08 ) ergs/cm2
1-s peak spectrum fit
Power-law model
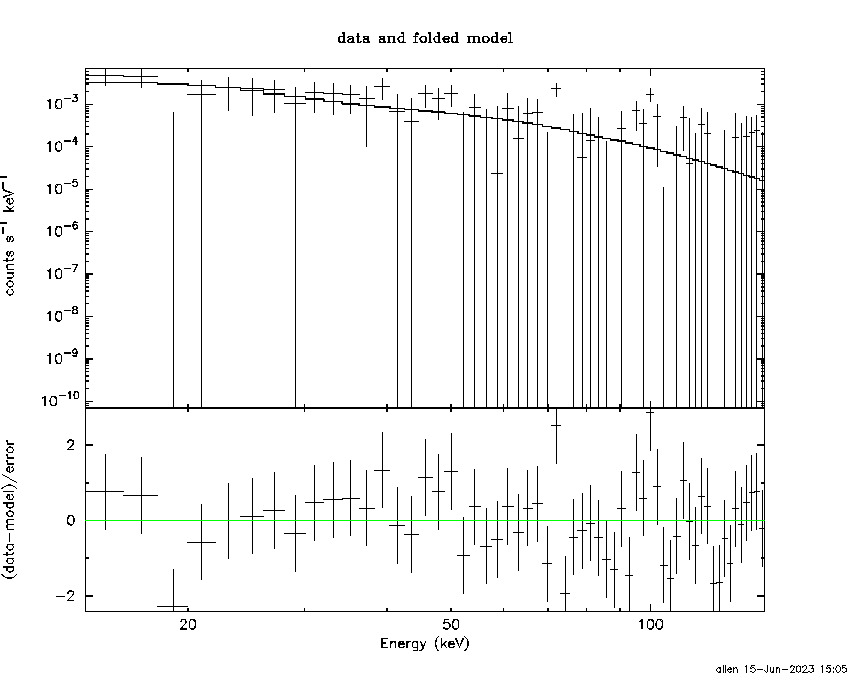
Time interval is from   10.624 sec. to   11.624 sec.

Spectral model in power-law:
------------------------------------------------------------
Parameters  : value       lower 90%   higher 90%
Photon index: -2.01489     ( -0.697753   0.54831 )
Norm@50keV  : 3.87879E-03    ( -0.00175077   0.0016511 )
------------------------------------------------------------
#Fit statistic  : Chi-Squared                   57.98     using 59 bins.
 Reduced chi-squared = 1.01719
# Null hypothesis probability of 4.39e-01 with 57 degrees of freedom

Photon flux (15-150 keV)    in 1 sec: 0.585885 ( -0.189457  0.189584 ) ph/cm2/s
Energy fluence (15-150 keV)             : 3.58088e-08 ( -1.41856e-08  1.53335e-08 ) ergs/cm2
Cutoff power-law model
Time interval is from   10.624 sec. to   11.624 sec.
Spectral model in the cutoff power-law:
------------------------------------------------------------
Parameters  : value       lower 90%   higher 90%
Photon index: 0.688297     ( -2.96243   -0.739872 )
Epeak [keV] : 40.4502      ( -40.4248 -40.4248 )
Norm@50keV  : 0.145444    ( -0.174985   45727.6 )
------------------------------------------------------------
#Fit statistic  : Chi-Squared                   56.06     using 59 bins.
 Reduced chi-squared = 1.00107
# Null hypothesis probability of 4.73e-01 with 56 degrees of freedom

Photon flux (15-150 keV)    in 1 sec: 0.548718 ( -0.199061  0.19465 ) ph/cm2/s
Energy fluence (15-150 keV)             : 0 ( 0  0 ) ergs/cm2
Time-resolved spectra
Distribution
T90 vs. Hardness ratio plot
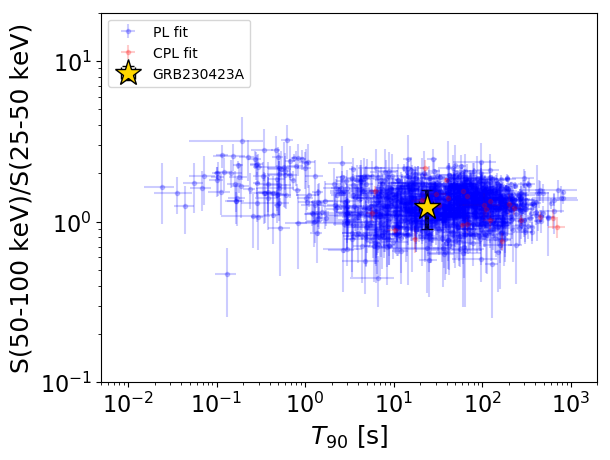
T90                                   = 23.604 sec.
Hardness ratio (energy fluence ratio) = 1.23868219754
S(15-50 keV) vs. S(50-150 keV) plot
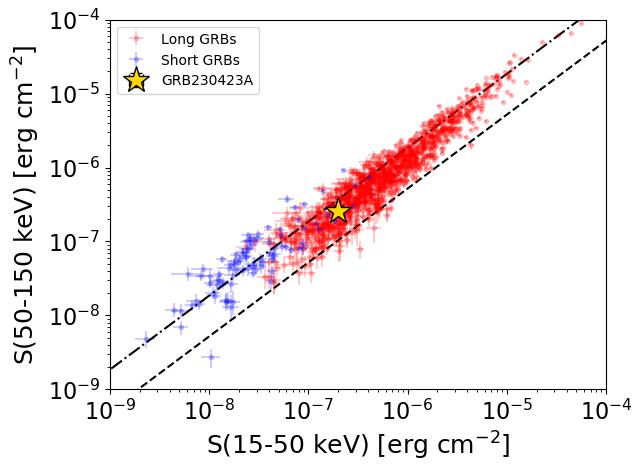
S(15-50 keV)  = 2.0036843e-07
S(50-150 keV) = 2.606203e-07
The dash-dotted line and the dashed line traces the fluences calculated from the Band function with Epeak = 15 and 150 keV, respectively. Both lines assume a canonical values of alpha = -1 and beta = -2.5.
Mask shadow pattern
IMX = 4.038392364169518E-02, IMY = 7.746302932783052E-02
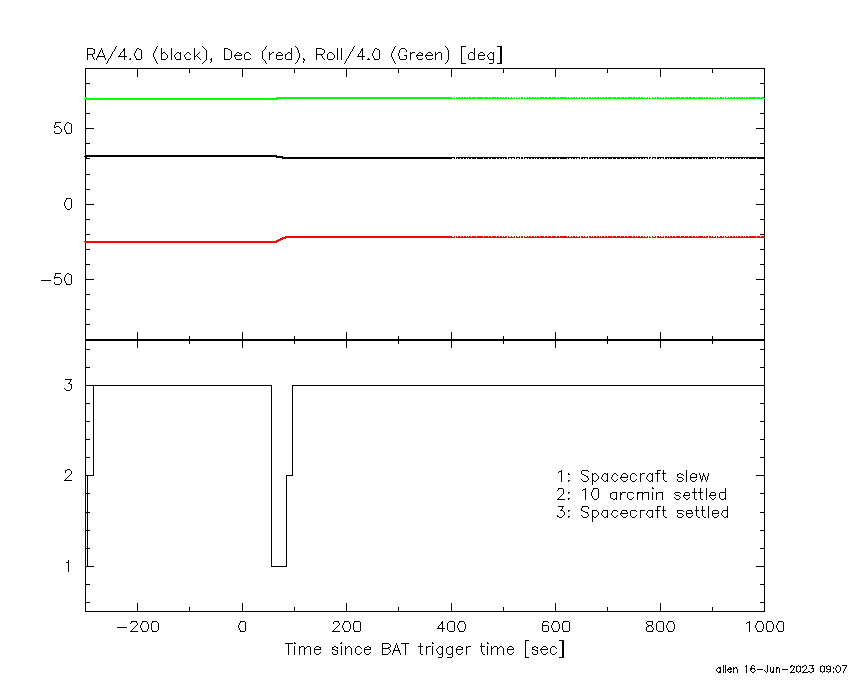
Spacecraft aspect plot
Bright source in the pre-burst/pre-slew/post-slew images
Pre-burst image of 15-350 keV band
Time interval of the image:
-239.624000 -2.252000

# RAcent  DECcent POSerr Theta    Phi  PeakCts   SNR AngSep     Name
#  [deg]    [deg]    ['] [deg]  [deg]                   [']
135.4070 -40.5572    2.8  17.1  147.7   1.9949   4.1    5.5	Vela X-1
170.3692 -60.6447    9.1  46.3  142.4   2.8849   1.3    2.0	Cen X-3
161.6209 -23.3903    2.4  31.6   84.7   3.6284   4.7 ------	UNKNOWN
152.1359   7.9970    2.5  41.1   30.1   2.5551   4.6 ------	UNKNOWN
129.1225  -7.0557    3.4  18.1   -2.7   1.4507   3.4 ------	UNKNOWN
 85.0104 -21.4931    2.9  38.5 -103.5   5.7511   3.9 ------	UNKNOWN
Pre-slew background subtracted image of 15-350 keV band
Time interval of the image:
-2.252000 24.492000

# RAcent  DECcent POSerr Theta    Phi  PeakCts   SNR AngSep     Name
#  [deg]    [deg]    ['] [deg]  [deg]                   [']
135.5361 -40.7035    6.3  17.3  147.6  -0.1606  -1.8    8.9	Vela X-1
170.4839 -60.6453    4.0  46.4  142.3   0.8873   2.9    5.1	Cen X-3
142.7112  18.9957    2.2  46.6   11.0   0.8653   5.2 ------	UNKNOWN
135.8760  -2.2596    2.2  24.3   12.4   0.4567   5.2 ------	UNKNOWN
129.0046 -33.2827    2.3   8.5  158.1   0.4140   5.1 ------	UNKNOWN
122.6176 -21.9011    1.3   5.0  -62.5   0.7311   9.1 ------	UNKNOWN
112.3730  12.8078    2.9  40.4  -32.0   0.5808   4.0 ------	UNKNOWN
Post-slew image of 15-350 keV band
Time interval of the image:
84.076600 306.639000
307.376000 549.507900
550.376000 962.464300

# RAcent  DECcent POSerr Theta    Phi  PeakCts   SNR AngSep     Name
#  [deg]    [deg]    ['] [deg]  [deg]                   [']
135.4393 -40.5494    2.7  21.6  141.7   6.7782   4.2    4.1	Vela X-1
156.7231 -21.4300    2.7  31.6   84.6  11.1352   4.3 ------	UNKNOWN
141.5280  24.8094    2.3  50.2   11.5   9.2425   5.1 ------	UNKNOWN