Analysis Summary
Notes:
- 1) No attempt has been made to eliminate the non-significant decimal places.
- 2) This batgrbproduct analysis is done using the HEASARC data.
- 3) This batgrbproduct analysis is using the flight position for the mask-weighting calculation.
======================================================================
BAT GRB EVENT DATA PROCESSING REPORT
Process Script Ver: batgrbproduct v2.48
Process Start Time: Wed Jun 14 14:58:35 EDT 2023
Host Name: batproc1
Current Working Dir: /local/data/bat1/alien/Swift_3rdBATcatalog/event/batevent_reproc/trigger1165948
======================================================================
Trigger: 01165948 Segment: 000
BAT Trigger Time: 704284343.168 [s; MET]
Trigger Stop: 704284345.216 [s; MET]
UTC: 2023-04-27T10:31:51.987820 [includes UTCF correction]
Where From?: TDRSS position message
BAT
RA: 153.324167550389 Dec: 48.1798072225164 [deg; J2000]
Catalogged Source?: NO
Point Source?: YES
GRB Indicated?: YES [ by BAT flight software ]
Image S/N Ratio: 6.8
Image Trigger?: NO
Rate S/N Ratio: 11.0453610171873 [ if not an image trigger ]
Image S/N Ratio: 6.8
Analysis Position: [ source = BAT ]
RA: 153.324167550389 Dec: 48.1798072225164 [deg; J2000]
Refined Position: [ source = BAT pre-slew burst ]
RA: 153.381479790343 Dec: 48.2611435826414 [deg; J2000]
{ 10h 13m 31.6s , +48d 15' 40.1" }
+/- 3.25058011442226 [arcmin] (estimated 90% radius based on SNR)
+/- 2.27794152516293 [arcmin] (formal 1-sigma fit error)
SNR: 5.64606277573643
Angular difference between the analysis and refined position is 5.391230 arcmin
Partial Coding Fraction: 0.875 [ including projection effects ]
Duration
T90: 6.33599996566772 +/- 2.57253184686787
Measured from: -0.159999966621399
to: 6.17599999904633 [s; relative to TRIGTIME]
T50: 2.92800009250641 +/- 2.20428666050985
Measured from: 0.399999976158142
to: 3.32800006866455 [s; relative to TRIGTIME]
Fluence
Peak Flux (peak 1 second)
Measured from: -0.251999974250793
to: 0.748000025749207 [s; relative to TRIGTIME]
Total Fluence
Measured from: -0.51199996471405
to: 6.44800007343292 [s; relative to TRIGTIME]
Band 1 Band 2 Band 3 Band 4
15-25 25-50 50-100 100-350 keV
Total 0.146400 0.088468 0.044883 -0.003628
0.024014 0.023974 0.020622 0.017676 [error]
Peak 0.040060 0.032880 0.025109 0.005893
0.009392 0.009701 0.008432 0.006991 [error]
[ fluence units of on-axis counts / fully illuminated detector ]
======================================================================
====== Table of the duration information =============================
Value tstart tstop
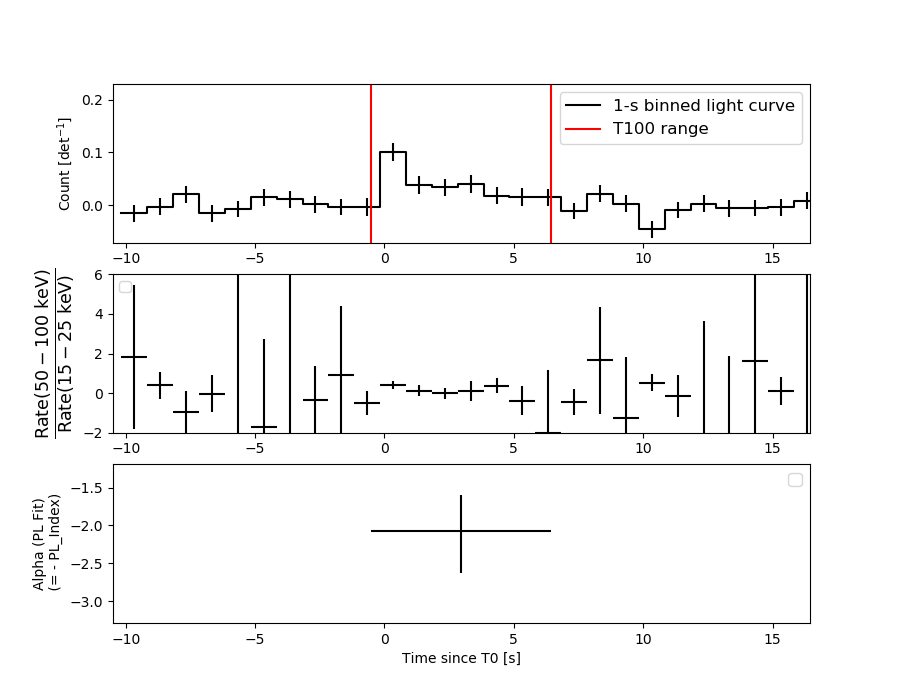
T100 6.960 -0.512 6.448
T90 6.336 -0.160 6.176
T50 2.928 0.400 3.328
Peak 1.000 -0.252 0.748
====== Spectral Analysis Summary =====================================
Model : spectral model: simple power-law (PL) and cutoff power-law (CPL)
Ph_index : photon index: E^{Ph_index}
Ph_90err : 90% error of the photon index
Epeak : Epeak in keV
Epeak_90err: 90% error of Epeak
Norm : normalization at 50 keV in both the PL model and CPL model
Nomr_90err : 90% error of the normalization
chi2 : Chi-Squared
dof : degree of freedo
=== Time-averaged spectral analysis ===
(Best model with acceptable fit: N/A)
Model Ph_index Ph_90err_low Ph_90err_hi Epeak Epeak_90err_low Epeak_90err_hi Norm Nomr_90err_low Norm_90err_hi chi2 dof
PL -2.073 -0.556 0.478 - - - 1.97e-03 -7.32e-04 7.01e-04 78.010 57
CPL -1.937 N/A N/A 17.074 N/A N/A 2.40e-03 N/A N/A 77.970 56
=== 1-s peak spectral analysis ===
(Best model with acceptable fit: PL)
Model Ph_index Ph_90err_low Ph_90err_hi Epeak Epeak_90err_low Epeak_90err_hi Norm Nomr_90err_low Norm_90err_hi chi2 dof
PL -1.828 -0.562 0.514 - - - 4.87e-03 -1.85e-03 1.80e-03 64.150 57
CPL 3.308 N/A N/A 30.633 N/A N/A 1.92e+01 N/A N/A 62.170 56
=== Fluence/Peak Flux Summary ===
Model Band1 Band2 Band3 Band4 Band5 Total
15-25 25-50 50-100 100-350 15-150 15-350 keV
Fluence PL 3.00e-08 3.90e-08 3.71e-08 6.24e-08 1.27e-07 1.68e-07 erg/cm2
90%_error_low -9.87e-09 -1.08e-08 -1.73e-08 -4.23e-08 -4.09e-08 -6.87e-08 erg/cm2
90%_error_hi 1.01e-08 1.05e-08 1.93e-08 8.15e-08 4.42e-08 9.99e-08 erg/cm2
Peak flux PL 2.75e-01 2.28e-01 1.28e-01 1.07e-01 6.79e-01 7.38e-01 ph/cm2/s
90%_error_low -1.14e-01 -7.19e-02 -5.91e-02 -7.04e-02 -2.14e-01 -2.37e-01 ph/cm2/s
90%_error_hi 1.21e-01 7.18e-02 6.27e-02 1.25e-01 2.14e-01 2.41e-01 ph/cm2/s
Fluence CPL 2.99e-08 3.99e-08 3.62e-08 4.13e-08 1.24e-07 1.47e-07 erg/cm2
90%_error_low -1.01e-08 -1.13e-08 -2.95e-08 N/A -4.96e-08 -7.14e-08 erg/cm2
90%_error_hi 1.01e-08 1.40e-08 1.60e-08 N/A 4.02e-08 9.69e-08 erg/cm2
Peak flux CPL 2.81e-01 3.00e-01 4.31e-03 7.19e-09 5.86e-01 5.86e-01 ph/cm2/s
90%_error_low -1.30e-01 -1.24e-01 -4.31e-03 -7.19e-09 -1.80e-01 -1.82e-01 ph/cm2/s
90%_error_hi 1.44e-01 1.24e-01 1.60e-01 -7.19e-09 2.07e-01 1.25e-01 ph/cm2/s
======================================================================
Image
Pre-slew 15.0-350.0 keV image (Event data)
#   RAcent    DECcent   POSerr    Theta     Phi              Peak Cts       SNR   Name
  153.3815    48.2611   0.0340    13.6249   -76.8270         0.2560387      5.646 TRIG_01165948

Foreground time interval of the image:
 -0.512   6.448 (delta_t =   6.960 [sec])
Background time interval of the image:
-239.168  -0.512 (delta_t = 238.656 [sec])
Light Curves
Note: The mask-weighted lightcurves have units of either count/det or counts/sec/det, where a det is 0.4 x 0.4 = 0.16 sq cm.
Full-time range; 1 s binning
Other quick-look light curves:
- 64 ms binning (zoomed)
- 16 ms binning (zoomed)
- 8 ms binning (zoomed)
- 2 ms binning (zoomed)
- SN=5 or 10 s binning (full-time range)
- Raw light curve
Spectra
- 64 ms binning (zoomed)
- 16 ms binning (zoomed)
- 8 ms binning (zoomed)
- 2 ms binning (zoomed)
- SN=5 or 10 s binning (full-time range)
- Raw light curve
Spectra
Notes:
- 1) The fitting includes the systematic errors.
- 2) When the burst includes telescope slew time periods, the fitting uses an average response file made from multiple 5-s response files through out the slew time plus single time preiod for the non-slew times, and weighted by the total counts in the corresponding time period using addrmf. An average response file is needed becuase a spectral fit using the pre-slew DRM will introduce some errors in both a spectral shape and a normalization if the PHA file contains a lot of the slew/post-slew time interval.
- 3) For fits to more complicated models (e.g. a power-law over a cutoff power-law), the BAT team has decided to require a chi-square improvement of more than 6 for each extra dof.
Time averaged spectrum fit using the average DRM
Power-law model
Time interval is from   -0.512 sec. to    6.448 sec.

Spectral model in power-law:
------------------------------------------------------------
Parameters  : value       lower 90%   higher 90%
Photon index: -2.07279     ( -0.555557   0.478002 )
Norm@50keV  : 1.96611E-03    ( -0.00073225   0.000701504 )
------------------------------------------------------------
#Fit statistic  : Chi-Squared                   78.01     using 59 bins.
 Reduced chi-squared = 1.3686
# Null hypothesis probability of 3.38e-02 with 57 degrees of freedom

Photon flux (15-150 keV)    in 6.96 sec: 0.305256 ( -0.078631  0.078658 ) ph/cm2/s
Energy fluence (15-150 keV)             : 1.26849e-07 ( -4.09325e-08  4.41675e-08 ) ergs/cm2
Cutoff power-law model
Time interval is from   -0.512 sec. to    6.448 sec.
Spectral model in the cutoff power-law:
------------------------------------------------------------
Parameters  : value       lower 90%   higher 90%
Photon index: -1.93682     (       )
Epeak [keV] : 17.0736      (   )
Norm@50keV  : 2.40071E-03    (     )
------------------------------------------------------------
#Fit statistic  : Chi-Squared                   77.97     using 59 bins.
 Reduced chi-squared = 1.39232
# Null hypothesis probability of 2.78e-02 with 56 degrees of freedom

Photon flux (15-150 keV)    in 6.96 sec: 0.305108 ( -0.078218  0.078862 ) ph/cm2/s
Energy fluence (15-150 keV)             : 1.23589e-07 ( -4.96147e-08  4.02435e-08 ) ergs/cm2
1-s peak spectrum fit
Power-law model
Time interval is from   -0.252 sec. to    0.748 sec.

Spectral model in power-law:
------------------------------------------------------------
Parameters  : value       lower 90%   higher 90%
Photon index: -1.82777     ( -0.562772   0.513836 )
Norm@50keV  : 4.87108E-03    ( -0.00185346   0.00179538 )
------------------------------------------------------------
#Fit statistic  : Chi-Squared                   64.15     using 59 bins.
 Reduced chi-squared = 1.12544
# Null hypothesis probability of 2.40e-01 with 57 degrees of freedom

Photon flux (15-150 keV)    in 1 sec: 0.678622 ( -0.213763  0.213766 ) ph/cm2/s
Energy fluence (15-150 keV)             : 4.48208e-08 ( -1.64253e-08  1.7524e-08 ) ergs/cm2
Cutoff power-law model
Time interval is from   -0.252 sec. to    0.748 sec.
Spectral model in the cutoff power-law:
------------------------------------------------------------
Parameters  : value       lower 90%   higher 90%
Photon index: 9.61081     (       )
Epeak [keV] : 27.8381      (   )
Norm@50keV  : 8.46582E+05    (     )
------------------------------------------------------------
#Fit statistic  : Chi-Squared                   61.69     using 59 bins.
 Reduced chi-squared = 1.10161
# Null hypothesis probability of 2.80e-01 with 56 degrees of freedom

Photon flux (15-150 keV)    in 1 sec: 0.585599 ( -0.180393  0.207004 ) ph/cm2/s
Energy fluence (15-150 keV)             : 2.49086e-08 ( -7.9929e-09  2.66772e-08 ) ergs/cm2
Time-resolved spectra
Distribution
T90 vs. Hardness ratio plot
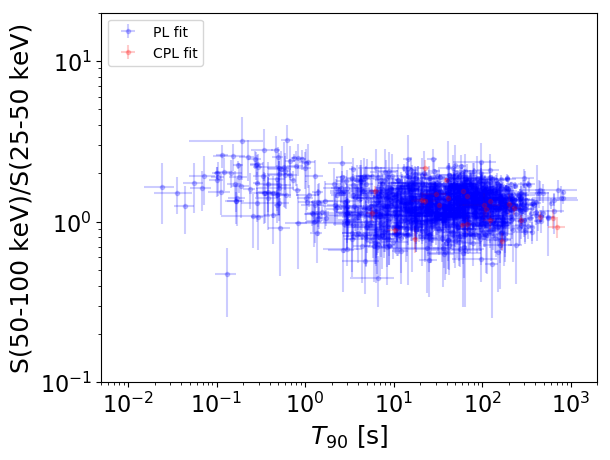
T90                                   = N/A sec.
Hardness ratio (energy fluence ratio) = N/A
S(15-50 keV) vs. S(50-150 keV) plot
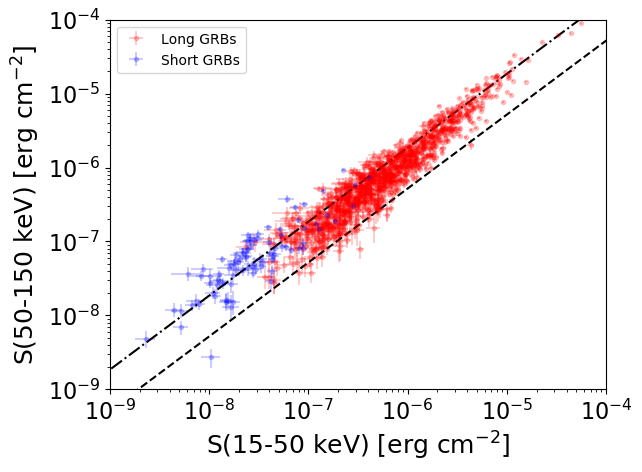
S(15-50 keV)  = N/A
S(50-150 keV) = N/A
The dash-dotted line and the dashed line traces the fluences calculated from the Band function with Epeak = 15 and 150 keV, respectively. Both lines assume a canonical values of alpha = -1 and beta = -2.5.
Mask shadow pattern
IMX = 5.523776989566868E-02, IMY = 2.360075174023397E-01
Spacecraft aspect plot
Bright source in the pre-burst/pre-slew/post-slew images
Pre-burst image of 15-350 keV band
Time interval of the image:
-239.168000 -0.512000

# RAcent  DECcent POSerr Theta    Phi  PeakCts   SNR AngSep     Name
#  [deg]    [deg]    ['] [deg]  [deg]                   [']
193.5468  17.5873    2.3  31.6   84.7   3.7621   4.9 ------	UNKNOWN
Pre-slew background subtracted image of 15-350 keV band
Time interval of the image:
-0.512000 6.448000

# RAcent  DECcent POSerr Theta    Phi  PeakCts   SNR AngSep     Name
#  [deg]    [deg]    ['] [deg]  [deg]                   [']
204.1236  15.0702    2.6  40.7   75.7   0.7325   4.5 ------	UNKNOWN
142.8362  -6.8745    2.3  50.0  172.4   0.5834   5.0 ------	UNKNOWN
153.3814  48.2611    2.0  13.6  -76.8   0.2561   5.6 ------	UNKNOWN
Post-slew image of 15-350 keV band
Time interval of the image:
77.332600 962.964500

# RAcent  DECcent POSerr Theta    Phi  PeakCts   SNR AngSep     Name
#  [deg]    [deg]    ['] [deg]  [deg]                   [']
186.1996  29.0176    2.5  31.6   84.7  11.5015   4.6 ------	UNKNOWN
153.3234  14.8083    3.1  33.4  149.4   7.9548   3.7 ------	UNKNOWN
292.9662  70.5628    3.7  57.7  -15.8  15.5190   3.2 ------	UNKNOWN