Analysis Summary
Notes:
- 1) No attempt has been made to eliminate the non-significant decimal places.
- 2) This batgrbproduct analysis is done using the HEASARC data.
- 3) This batgrbproduct analysis is using the flight position for the mask-weighting calculation.
======================================================================
BAT GRB EVENT DATA PROCESSING REPORT
Process Script Ver: batgrbproduct v2.48
Process Start Time: Wed Jun 14 14:57:14 EDT 2023
Host Name: batproc1
Current Working Dir: /local/data/bat1/alien/Swift_3rdBATcatalog/event/batevent_reproc/trigger1167266
======================================================================
Trigger: 01167266 Segment: 000
BAT Trigger Time: 705069949.952 [s; MET]
Trigger Stop: 705069950.08 [s; MET]
UTC: 2023-05-06T12:45:18.718180 [includes UTCF correction]
Where From?: TDRSS position message
BAT
RA: 326.992980588766 Dec: 44.5403527391438 [deg; J2000]
Catalogged Source?: NO
Point Source?: YES
GRB Indicated?: YES [ by BAT flight software ]
Image S/N Ratio: 9.5
Image Trigger?: NO
Rate S/N Ratio: 32.9241552663087 [ if not an image trigger ]
Image S/N Ratio: 9.5
Analysis Position: [ source = BAT ]
RA: 326.992980588766 Dec: 44.5403527391438 [deg; J2000]
Refined Position: [ source = BAT pre-slew burst ]
RA: 326.985868732122 Dec: 44.5141426681885 [deg; J2000]
{ 21h 47m 56.6s , +44d 30' 50.9" }
+/- 1.21574348727153 [arcmin] (estimated 90% radius based on SNR)
+/- 0.43333938036842 [arcmin] (formal 1-sigma fit error)
SNR: 23.0099455937413
Angular difference between the analysis and refined position is 1.601758 arcmin
Partial Coding Fraction: 0.734375 [ including projection effects ]
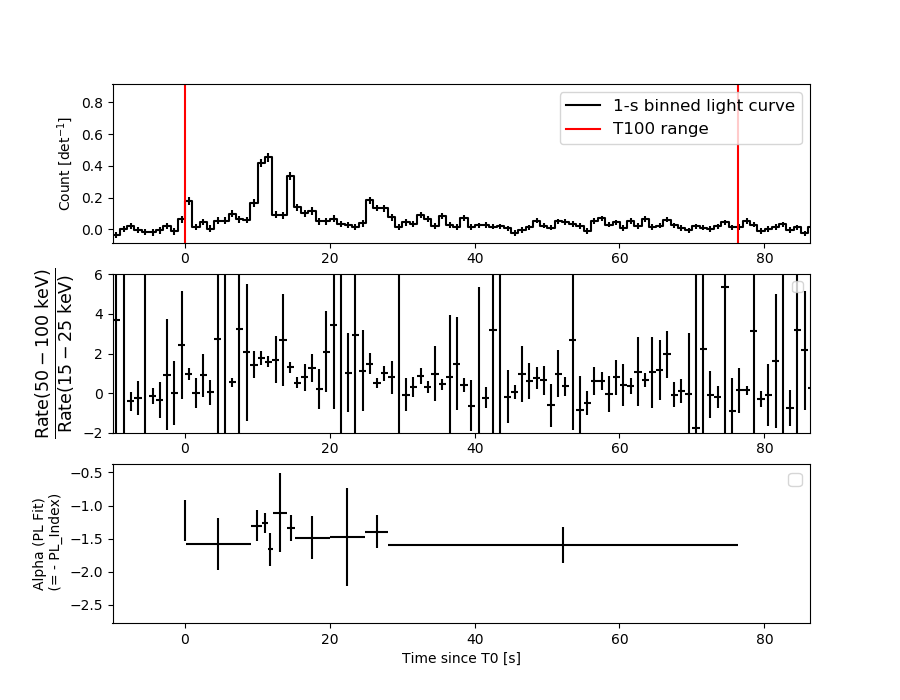
Duration
T90: 61.539999961853 +/- 10.8925583836745
Measured from: 2.62399995326996
to: 64.163999915123 [s; relative to TRIGTIME]
T50: 21.5359998941422 +/- 3.96879016687736
Measured from: 10.9919999837875
to: 32.5279998779297 [s; relative to TRIGTIME]
Fluence
Peak Flux (peak 1 second)
Measured from: 10.6039999723434
to: 11.6039999723434 [s; relative to TRIGTIME]
Total Fluence
Measured from: 0.0239999294281006
to: 76.2960000038147 [s; relative to TRIGTIME]
Band 1 Band 2 Band 3 Band 4
15-25 25-50 50-100 100-350 keV
Total 1.209569 1.717474 1.312353 0.443115
0.096711 0.095553 0.078766 0.067627 [error]
Peak 0.131856 0.212727 0.195473 0.053052
0.014822 0.016330 0.015639 0.012442 [error]
[ fluence units of on-axis counts / fully illuminated detector ]
======================================================================
====== Table of the duration information =============================
Value tstart tstop
T100 76.272 0.024 76.296
T90 61.540 2.624 64.164
T50 21.536 10.992 32.528
Peak 1.000 10.604 11.604
====== Spectral Analysis Summary =====================================
Model : spectral model: simple power-law (PL) and cutoff power-law (CPL)
Ph_index : photon index: E^{Ph_index}
Ph_90err : 90% error of the photon index
Epeak : Epeak in keV
Epeak_90err: 90% error of Epeak
Norm : normalization at 50 keV in both the PL model and CPL model
Nomr_90err : 90% error of the normalization
chi2 : Chi-Squared
dof : degree of freedo
=== Time-averaged spectral analysis ===
(Best model with acceptable fit: PL)
Model Ph_index Ph_90err_low Ph_90err_hi Epeak Epeak_90err_low Epeak_90err_hi Norm Nomr_90err_low Norm_90err_hi chi2 dof
PL -1.410 -0.112 0.113 - - - 3.96e-03 -2.37e-04 2.37e-04 39.430 57
CPL -1.411 -0.109 0.201 9999.360 -9999.360 -9999.360 3.97e-03 -2.32e-04 1.28e-03 39.460 56
=== 1-s peak spectral analysis ===
(Best model with acceptable fit: PL)
Model Ph_index Ph_90err_low Ph_90err_hi Epeak Epeak_90err_low Epeak_90err_hi Norm Nomr_90err_low Norm_90err_hi chi2 dof
PL -1.276 -0.140 0.140 - - - 3.89e-02 -3.23e-03 3.22e-03 47.760 57
CPL -0.790 -0.537 0.647 126.449 -46.241 -126.449 6.82e-02 -3.06e-02 7.29e-02 45.610 56
=== Fluence/Peak Flux Summary ===
Model Band1 Band2 Band3 Band4 Band5 Total
15-25 25-50 50-100 100-350 15-150 15-350 keV
Fluence PL 3.54e-07 6.88e-07 1.04e-06 3.38e-06 2.91e-06 5.45e-06 erg/cm2
90%_error_low -4.04e-08 -4.63e-08 -7.87e-08 -5.48e-07 -1.91e-07 -6.01e-07 erg/cm2
90%_error_hi 4.19e-08 4.60e-08 7.83e-08 6.22e-07 1.92e-07 6.61e-07 erg/cm2
Peak flux PL 1.29e+00 1.49e+00 1.23e+00 1.70e+00 4.63e+00 5.71e+00 ph/cm2/s
90%_error_low -1.84e-01 -1.34e-01 -1.25e-01 -3.32e-01 -3.81e-01 -4.99e-01 ph/cm2/s
90%_error_hi 1.92e-01 1.33e-01 1.24e-01 3.79e-01 3.82e-01 5.07e-01 ph/cm2/s
Fluence CPL 3.58e-07 6.84e-07 1.03e-06 3.54e-06 2.92e-06 5.28e-06 erg/cm2
90%_error_low N/A -4.30e-08 -9.27e-08 -1.30e-06 -2.51e-07 -1.01e-06 erg/cm2
90%_error_hi N/A 5.01e-08 1.02e-07 1.17e-07 2.25e-07 8.14e-07 erg/cm2
Peak flux CPL 1.18e+00 1.56e+00 1.28e+00 9.83e-01 4.54e+00 5.00e+00 ph/cm2/s
90%_error_low -2.22e-01 -1.58e-01 -1.41e-01 -4.46e-01 -3.97e-01 -6.11e-01 ph/cm2/s
90%_error_hi 2.28e-01 1.62e-01 1.44e-01 7.67e-01 3.95e-01 9.32e-01 ph/cm2/s
======================================================================
Image
Pre-slew 15.0-350.0 keV image (Event data)
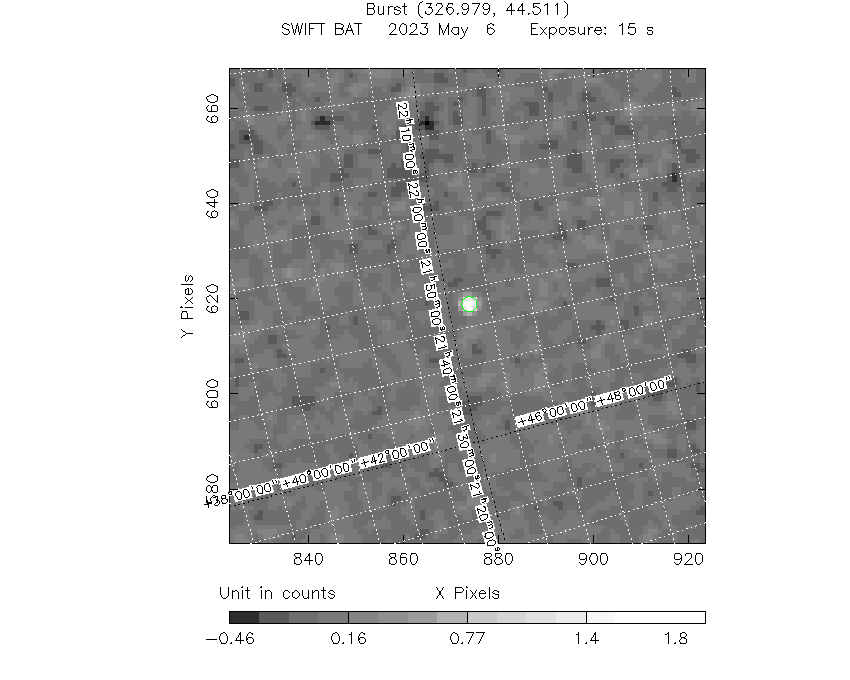
#   RAcent    DECcent   POSerr    Theta     Phi              Peak Cts       SNR   Name
  326.9859    44.5141   0.0083    16.6532   -87.6777         2.1131267     23.010 TRIG_01167266

Foreground time interval of the image:
  0.024  14.749 (delta_t =  14.725 [sec])
Background time interval of the image:
-239.952   0.024 (delta_t = 239.976 [sec])
Light Curves
Note: The mask-weighted lightcurves have units of either count/det or counts/sec/det, where a det is 0.4 x 0.4 = 0.16 sq cm.
Full-time range; 1 s binning
Other quick-look light curves:
- 64 ms binning (zoomed)
- 16 ms binning (zoomed)
- 8 ms binning (zoomed)
- 2 ms binning (zoomed)
- SN=5 or 10 s binning (full-time range)
- Raw light curve
Spectra
- 64 ms binning (zoomed)
- 16 ms binning (zoomed)
- 8 ms binning (zoomed)
- 2 ms binning (zoomed)
- SN=5 or 10 s binning (full-time range)
- Raw light curve
Spectra
Notes:
- 1) The fitting includes the systematic errors.
- 2) When the burst includes telescope slew time periods, the fitting uses an average response file made from multiple 5-s response files through out the slew time plus single time preiod for the non-slew times, and weighted by the total counts in the corresponding time period using addrmf. An average response file is needed becuase a spectral fit using the pre-slew DRM will introduce some errors in both a spectral shape and a normalization if the PHA file contains a lot of the slew/post-slew time interval.
- 3) For fits to more complicated models (e.g. a power-law over a cutoff power-law), the BAT team has decided to require a chi-square improvement of more than 6 for each extra dof.
Time averaged spectrum fit using the average DRM
Power-law model
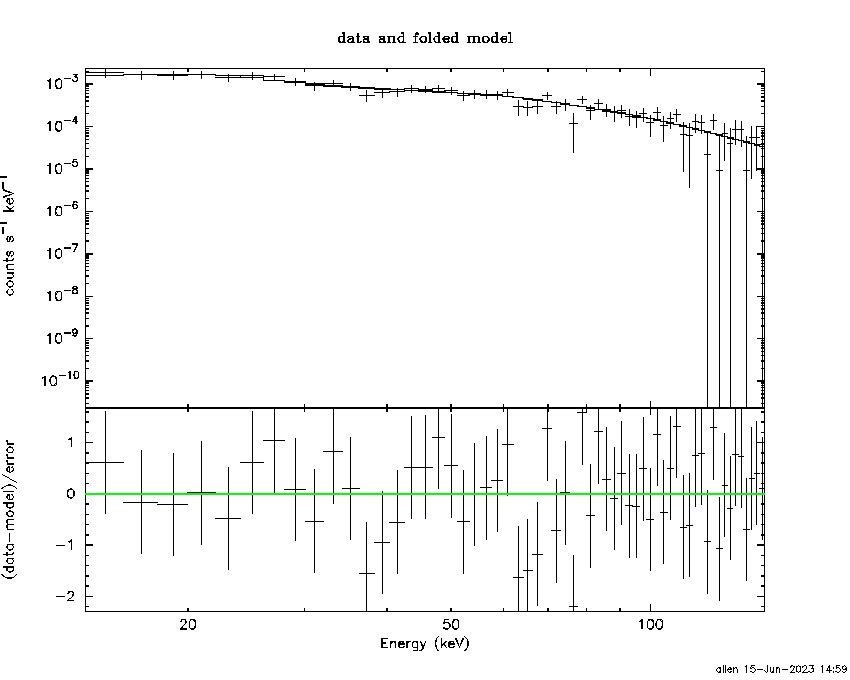
Time interval is from    0.024 sec. to   76.296 sec.

Spectral model in power-law:
------------------------------------------------------------
Parameters  : value       lower 90%   higher 90%
Photon index: -1.41004     ( -0.11228   0.112865 )
Norm@50keV  : 3.95849E-03    ( -0.000236793   0.000236557 )
------------------------------------------------------------
#Fit statistic  : Chi-Squared                   39.43     using 59 bins.
 Reduced chi-squared = 0.691754
# Null hypothesis probability of 9.63e-01 with 57 degrees of freedom

Photon flux (15-150 keV)    in 76.27 sec: 0.483189 ( -0.030355  0.030507 ) ph/cm2/s
Energy fluence (15-150 keV)             : 2.91174e-06 ( -1.90775e-07  1.91841e-07 ) ergs/cm2
Cutoff power-law model

Time interval is from    0.024 sec. to   76.296 sec.
Spectral model in the cutoff power-law:
------------------------------------------------------------
Parameters  : value       lower 90%   higher 90%
Photon index: -1.4105     ( -0.109761   0.200775 )
Epeak [keV] : 9999.36      ( -9999.36 -9999.36 )
Norm@50keV  : 3.96641E-03    ( -0.000236863   0.00127824 )
------------------------------------------------------------
#Fit statistic  : Chi-Squared                   39.46     using 59 bins.
 Reduced chi-squared = 0.704643
# Null hypothesis probability of 9.54e-01 with 56 degrees of freedom

Photon flux (15-150 keV)    in 76.27 sec: 0.485381 ( -0.032675  0.028199 ) ph/cm2/s
Energy fluence (15-150 keV)             : 2.92465e-06 ( -2.50943e-07  2.25156e-07 ) ergs/cm2
1-s peak spectrum fit
Power-law model
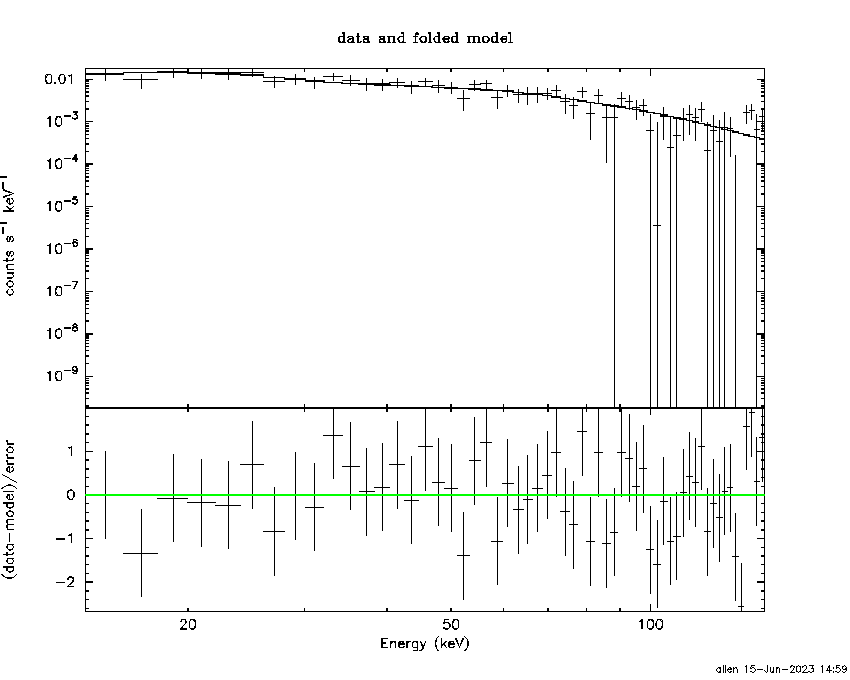
Time interval is from   10.604 sec. to   11.604 sec.

Spectral model in power-law:
------------------------------------------------------------
Parameters  : value       lower 90%   higher 90%
Photon index: -1.27607     ( -0.139969   0.139841 )
Norm@50keV  : 3.89356E-02    ( -0.00322736   0.00321635 )
------------------------------------------------------------
#Fit statistic  : Chi-Squared                   47.76     using 59 bins.
 Reduced chi-squared = 0.837895
# Null hypothesis probability of 8.03e-01 with 57 degrees of freedom

Photon flux (15-150 keV)    in 1 sec: 4.62530 ( -0.38142  0.38161 ) ph/cm2/s
Energy fluence (15-150 keV)             : 3.87097e-07 ( -3.64582e-08  3.68289e-08 ) ergs/cm2
Cutoff power-law model
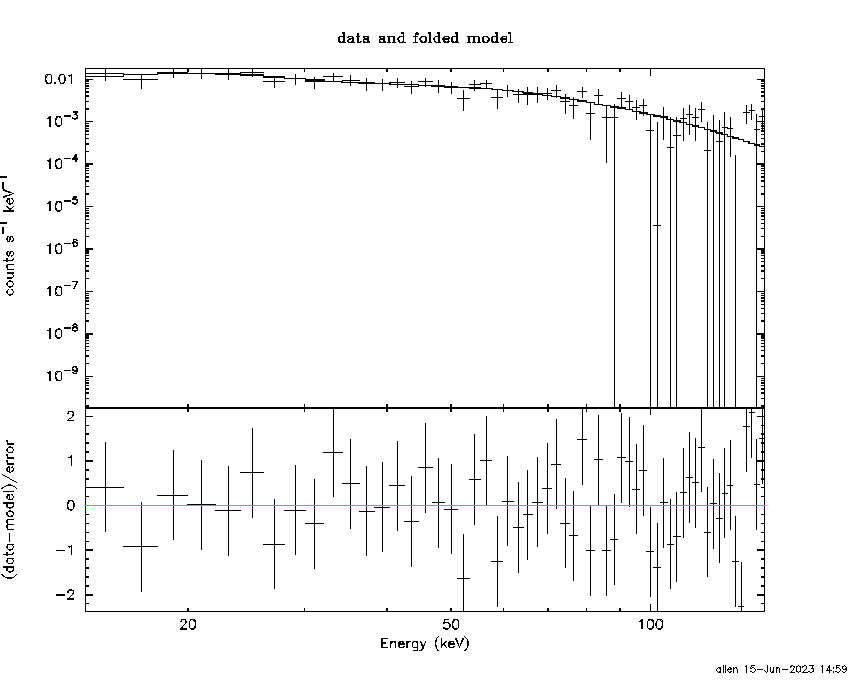
Time interval is from   10.604 sec. to   11.604 sec.
Spectral model in the cutoff power-law:
------------------------------------------------------------
Parameters  : value       lower 90%   higher 90%
Photon index: -0.789672     ( -0.537227   0.647067 )
Epeak [keV] : 126.449      ( -46.2396 -126.447 )
Norm@50keV  : 6.82252E-02    ( -0.0306082   0.0729005 )
------------------------------------------------------------
#Fit statistic  : Chi-Squared                   45.61     using 59 bins.
 Reduced chi-squared = 0.814464
# Null hypothesis probability of 8.38e-01 with 56 degrees of freedom

Photon flux (15-150 keV)    in 1 sec: 4.53750 ( -0.39706  0.39498 ) ph/cm2/s
Energy fluence (15-150 keV)             : 3.72538e-07 ( -4.09109e-08  4.07093e-08 ) ergs/cm2
Time-resolved spectra
Distribution
T90 vs. Hardness ratio plot
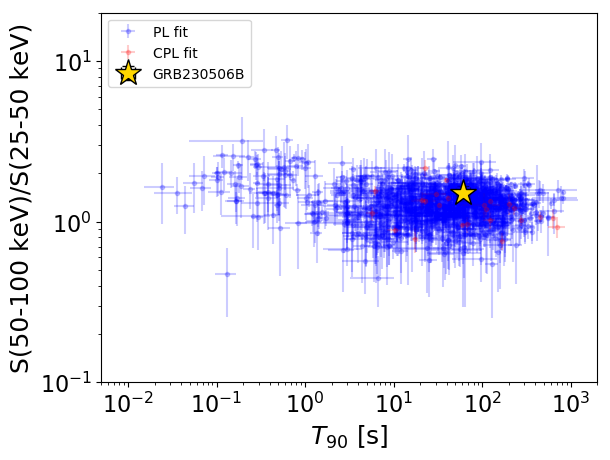
T90                                   = 61.54 sec.
Hardness ratio (energy fluence ratio) = 1.50525478112
S(15-50 keV) vs. S(50-150 keV) plot
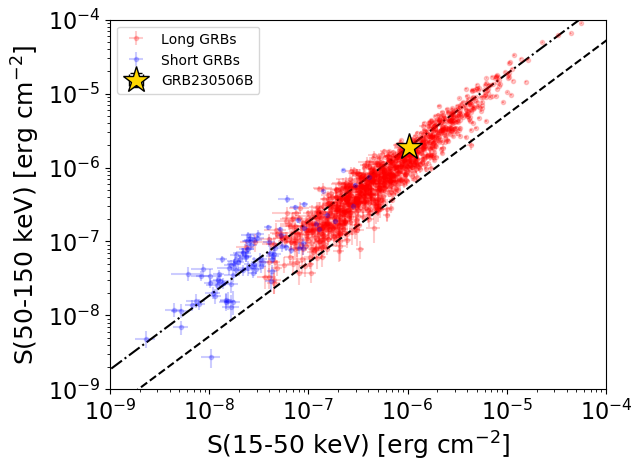
S(15-50 keV)  = 1.0423435e-06
S(50-150 keV) = 1.8693884e-06
The dash-dotted line and the dashed line traces the fluences calculated from the Band function with Epeak = 15 and 150 keV, respectively. Both lines assume a canonical values of alpha = -1 and beta = -2.5.
Mask shadow pattern
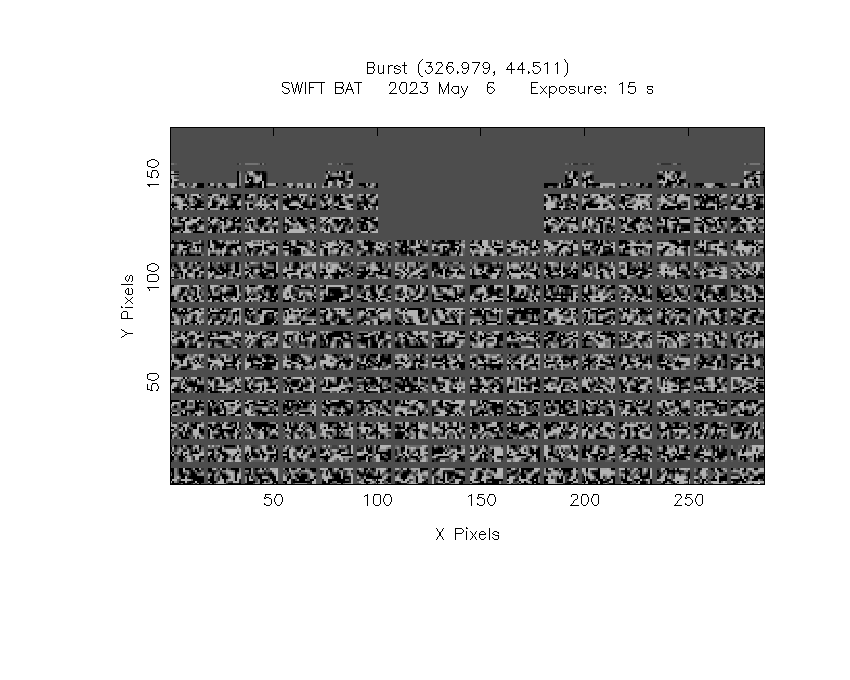
IMX = 1.212068208750919E-02, IMY = 2.988785134397000E-01
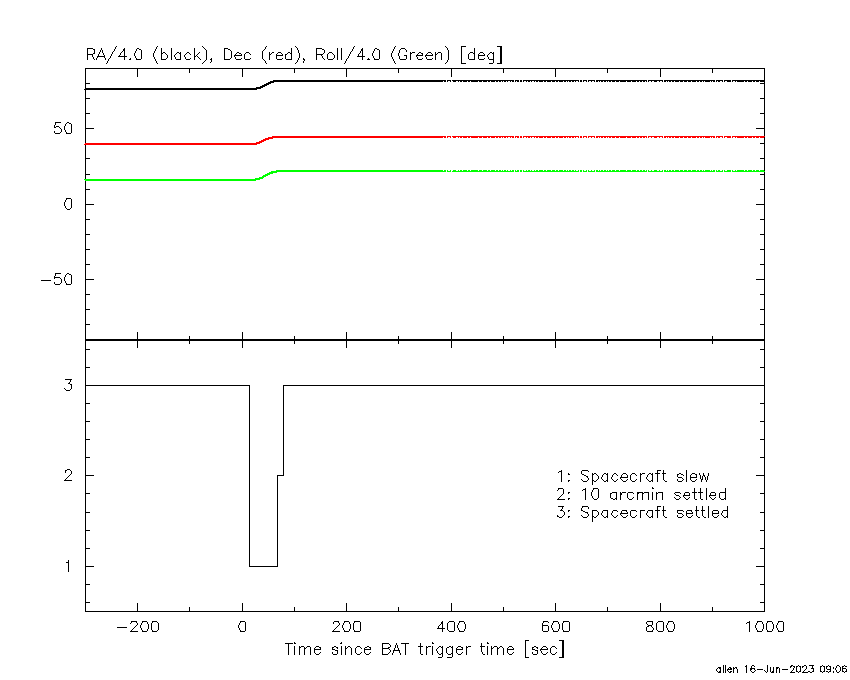
Spacecraft aspect plot
Bright source in the pre-burst/pre-slew/post-slew images
Pre-burst image of 15-350 keV band
Time interval of the image:
-239.952000 0.024000

# RAcent  DECcent POSerr Theta    Phi  PeakCts   SNR AngSep     Name
#  [deg]    [deg]    ['] [deg]  [deg]                   [']
254.4371  35.3663   39.9  40.1  126.3  -0.5644  -0.3    1.8	Her X-1
288.8377  10.9396    9.3  32.4   57.4  -1.0890  -1.2    2.3	GRS 1915+105
299.5911  35.1774    1.3   6.5   72.6   4.7822   9.1    1.5	Cyg X-1
308.1298  41.0187    3.2   2.4  -95.5   1.8530   3.7    4.1	Cyg X-3
326.3499  38.2062    6.1  16.3  -65.3   1.2268   1.9   10.9	Cyg X-2
299.4221  31.0375    2.5  10.0   56.7   2.3356   4.6 ------	UNKNOWN
Pre-slew background subtracted image of 15-350 keV band
Time interval of the image:
0.024000 14.748600

# RAcent  DECcent POSerr Theta    Phi  PeakCts   SNR AngSep     Name
#  [deg]    [deg]    ['] [deg]  [deg]                   [']
254.5114  35.3919   35.0  40.0  126.3  -0.0632  -0.3    4.0	Her X-1
288.8190  10.8041    8.4  32.5   57.3   0.1605   1.4    8.6	GRS 1915+105
299.4056  35.1640   11.0   6.6   73.4   0.0813   1.1    9.3	Cyg X-1
307.8985  41.0451    4.8   2.3  -98.2   0.1807   2.4   11.1	Cyg X-3
326.0781  38.1546    4.2  16.1  -65.0   0.2453   2.7   11.0	Cyg X-2
326.9859  44.5141    0.5  16.7  -87.7   2.1132  23.0 ------	UNKNOWN
350.5887  58.5514    2.6  34.1 -112.7   0.7540   4.4 ------	UNKNOWN
Post-slew image of 15-350 keV band
Time interval of the image:
67.348600 962.200500

# RAcent  DECcent POSerr Theta    Phi  PeakCts   SNR AngSep     Name
#  [deg]    [deg]    ['] [deg]  [deg]                   [']
299.5943  35.2086    1.4  22.8   78.3  15.9787   8.2    0.5	Cyg X-1
308.1898  40.9253    3.6  14.2   84.8   5.9732   3.2    4.0	Cyg X-3
326.1363  38.2360    5.9   6.3    8.9  -3.3918  -2.0    5.4	Cyg X-2
288.7819  32.8946    2.6  31.6   84.6  12.9418   4.4 ------	UNKNOWN
320.4158  -9.5274    2.4  54.4   10.9  21.6330   4.9 ------	UNKNOWN
352.8039  -5.6319    3.3  55.3  -29.0  23.7850   3.6  547.7	UNKNOWN
357.6471   4.1314    3.5  48.5  -39.9  16.4013   3.3  285.2	UNKNOWN