Analysis Summary
Notes:
- 1) No attempt has been made to eliminate the non-significant decimal places.
- 2) This batgrbproduct analysis is done using the HEASARC data.
- 3) This batgrbproduct analysis is using the flight position for the mask-weighting calculation.
======================================================================
BAT GRB EVENT DATA PROCESSING REPORT
Process Script Ver: batgrbproduct v2.48
Process Start Time: Wed Jun 14 14:55:52 EDT 2023
Host Name: batproc1
Current Working Dir: /local/data/bat1/alien/Swift_3rdBATcatalog/event/batevent_reproc/trigger1167288
======================================================================
Trigger: 01167288 Segment: 000
BAT Trigger Time: 705085790.592 [s; MET]
Trigger Stop: 705085791.616 [s; MET]
UTC: 2023-05-06T17:09:19.357100 [includes UTCF correction]
Where From?: TDRSS position message
BAT
RA: 134.373246151572 Dec: 45.1256110571573 [deg; J2000]
Catalogged Source?: NO
Point Source?: YES
GRB Indicated?: YES [ by BAT flight software ]
Image S/N Ratio: 7.73
Image Trigger?: NO
Rate S/N Ratio: 11.2249721603218 [ if not an image trigger ]
Image S/N Ratio: 7.73
Analysis Position: [ source = BAT ]
RA: 134.373246151572 Dec: 45.1256110571573 [deg; J2000]
Refined Position: [ source = BAT pre-slew burst ]
RA: 134.374288649084 Dec: 45.1299489900697 [deg; J2000]
{ 08h 57m 29.8s , +45d 07' 47.8" }
+/- 1.43829315184559 [arcmin] (estimated 90% radius based on SNR)
+/- 0.783369900759221 [arcmin] (formal 1-sigma fit error)
SNR: 18.0976454700914
Angular difference between the analysis and refined position is 0.263991 arcmin
Partial Coding Fraction: 0.46875 [ including projection effects ]
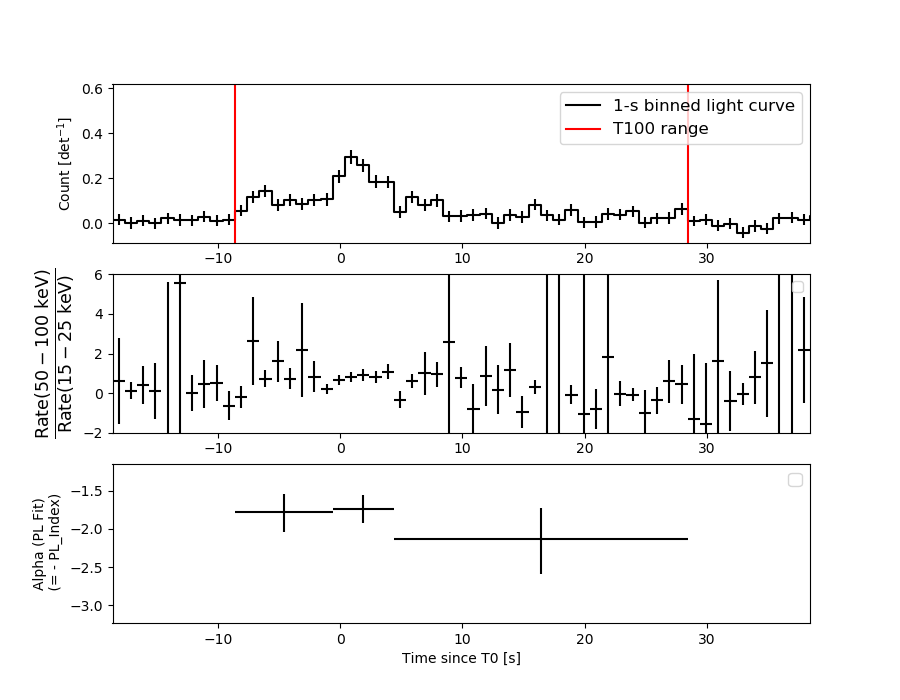
Duration
T90: 31 +/- 6.32455532033676
Measured from: -7.59200000762939
to: 23.4079999923706 [s; relative to TRIGTIME]
T50: 9 +/- 3.60555127546399
Measured from: -1.59200000762939
to: 7.40799999237061 [s; relative to TRIGTIME]
Fluence
Peak Flux (peak 1 second)
Measured from: 0.407999992370605
to: 1.40799999237061 [s; relative to TRIGTIME]
Total Fluence
Measured from: -8.59200000762939
to: 28.4079999923706 [s; relative to TRIGTIME]
Band 1 Band 2 Band 3 Band 4
15-25 25-50 50-100 100-350 keV
Total 0.977331 1.121308 0.626428 0.194698
0.086534 0.089428 0.077911 0.067997 [error]
Peak 0.086999 0.109645 0.071394 0.025048
0.016476 0.017617 0.015693 0.012279 [error]
[ fluence units of on-axis counts / fully illuminated detector ]
======================================================================
====== Table of the duration information =============================
Value tstart tstop
T100 37.000 -8.592 28.408
T90 31.000 -7.592 23.408
T50 9.000 -1.592 7.408
Peak 1.000 0.408 1.408
====== Spectral Analysis Summary =====================================
Model : spectral model: simple power-law (PL) and cutoff power-law (CPL)
Ph_index : photon index: E^{Ph_index}
Ph_90err : 90% error of the photon index
Epeak : Epeak in keV
Epeak_90err: 90% error of Epeak
Norm : normalization at 50 keV in both the PL model and CPL model
Nomr_90err : 90% error of the normalization
chi2 : Chi-Squared
dof : degree of freedo
=== Time-averaged spectral analysis ===
(Best model with acceptable fit: PL)
Model Ph_index Ph_90err_low Ph_90err_hi Epeak Epeak_90err_low Epeak_90err_hi Norm Nomr_90err_low Norm_90err_hi chi2 dof
PL -1.878 -0.171 0.166 - - - 4.96e-03 -5.33e-04 5.24e-04 55.060 57
CPL -1.633 -0.589 0.740 65.703 -65.645 -65.703 6.82e-03 -3.98e-03 1.09e-02 54.640 56
=== 1-s peak spectral analysis ===
(Best model with acceptable fit: PL)
Model Ph_index Ph_90err_low Ph_90err_hi Epeak Epeak_90err_low Epeak_90err_hi Norm Nomr_90err_low Norm_90err_hi chi2 dof
PL -1.837 -0.319 0.299 - - - 1.68e-02 -3.58e-03 3.49e-03 61.900 57
CPL -1.069 -1.093 1.545 54.064 -52.241 -54.064 4.52e-02 -4.52e-02 3.12e-01 60.580 56
=== Fluence/Peak Flux Summary ===
Model Band1 Band2 Band3 Band4 Band5 Total
15-25 25-50 50-100 100-350 15-150 15-350 keV
Fluence PL 3.35e-07 4.89e-07 5.32e-07 1.08e-06 1.69e-06 2.44e-06 erg/cm2
90%_error_low -4.66e-08 -4.53e-08 -7.66e-08 -2.86e-07 -1.78e-07 -3.70e-07 erg/cm2
90%_error_hi 4.79e-08 4.54e-08 7.70e-08 3.47e-07 1.81e-07 4.15e-07 erg/cm2
Peak flux PL 9.55e-01 7.88e-01 4.41e-01 3.64e-01 2.34e+00 2.55e+00 ph/cm2/s
90%_error_low -2.56e-01 -1.50e-01 -1.17e-01 -1.56e-01 -4.48e-01 -4.83e-01 ph/cm2/s
90%_error_hi 2.70e-01 1.50e-01 1.17e-01 2.07e-01 4.49e-01 4.83e-01 ph/cm2/s
Fluence CPL 3.27e-07 5.04e-07 5.32e-07 6.97e-07 1.65e-06 2.06e-06 erg/cm2
90%_error_low -5.17e-08 -2.85e-08 -8.18e-08 -4.62e-07 -2.07e-07 -5.17e-07 erg/cm2
90%_error_hi 5.20e-08 6.21e-08 8.03e-08 7.23e-07 2.02e-07 5.37e-07 erg/cm2
Peak flux CPL 8.82e-01 8.71e-01 4.57e-01 1.52e-01 2.32e+00 2.36e+00 ph/cm2/s
90%_error_low -2.84e-01 -1.92e-01 -1.44e-01 -1.52e-01 -4.50e-01 -4.75e-01 ph/cm2/s
90%_error_hi 2.92e-01 2.07e-01 1.36e-01 2.91e-01 4.51e-01 5.30e-01 ph/cm2/s
======================================================================
Image
Pre-slew 15.0-350.0 keV image (Event data)
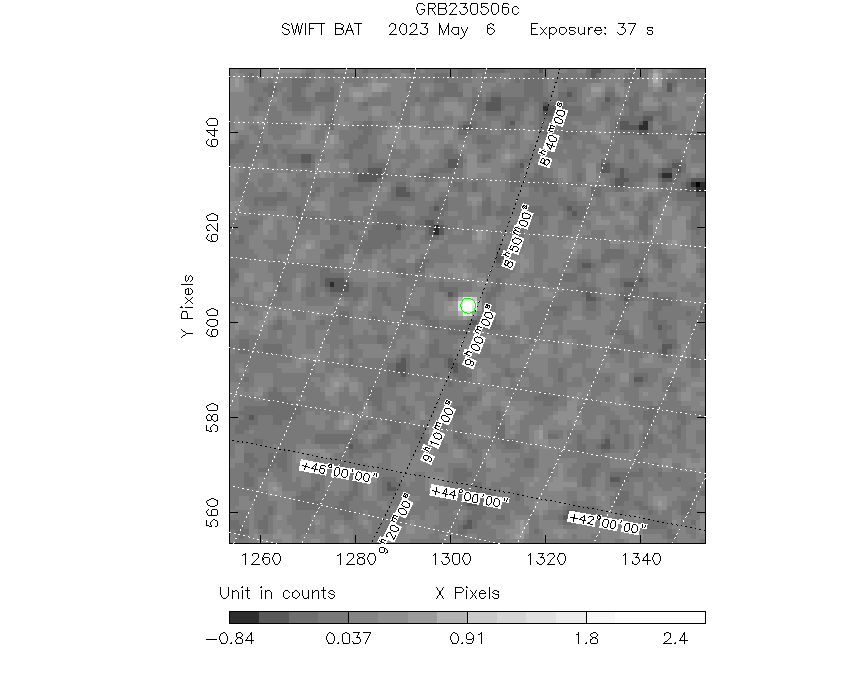
#   RAcent    DECcent   POSerr    Theta     Phi              Peak Cts       SNR   Name
  134.3743    45.1299   0.0106    42.9200  -163.3342         3.1377838     18.098 TRIG_01167288

Foreground time interval of the image:
 -8.592  28.408 (delta_t =  37.000 [sec])
Background time interval of the image:
-239.592  -8.592 (delta_t = 231.000 [sec])
Light Curves
Note: The mask-weighted lightcurves have units of either count/det or counts/sec/det, where a det is 0.4 x 0.4 = 0.16 sq cm.
Full-time range; 1 s binning
Other quick-look light curves:
- 64 ms binning (zoomed)
- 16 ms binning (zoomed)
- 8 ms binning (zoomed)
- 2 ms binning (zoomed)
- SN=5 or 10 s binning (full-time range)
- Raw light curve
Spectra
- 64 ms binning (zoomed)
- 16 ms binning (zoomed)
- 8 ms binning (zoomed)
- 2 ms binning (zoomed)
- SN=5 or 10 s binning (full-time range)
- Raw light curve
Spectra
Notes:
- 1) The fitting includes the systematic errors.
- 2) When the burst includes telescope slew time periods, the fitting uses an average response file made from multiple 5-s response files through out the slew time plus single time preiod for the non-slew times, and weighted by the total counts in the corresponding time period using addrmf. An average response file is needed becuase a spectral fit using the pre-slew DRM will introduce some errors in both a spectral shape and a normalization if the PHA file contains a lot of the slew/post-slew time interval.
- 3) For fits to more complicated models (e.g. a power-law over a cutoff power-law), the BAT team has decided to require a chi-square improvement of more than 6 for each extra dof.
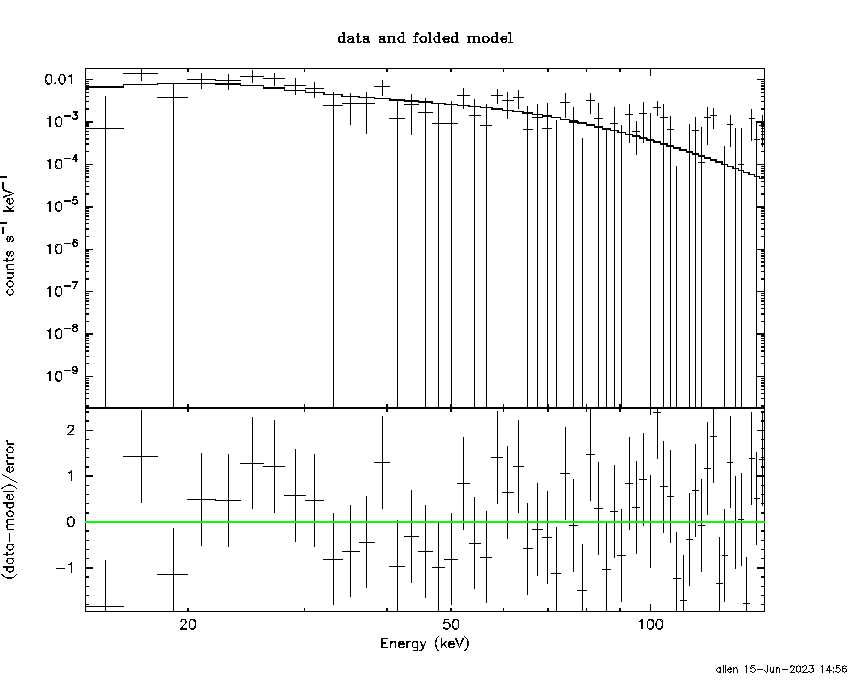
Time averaged spectrum fit using the average DRM
Power-law model
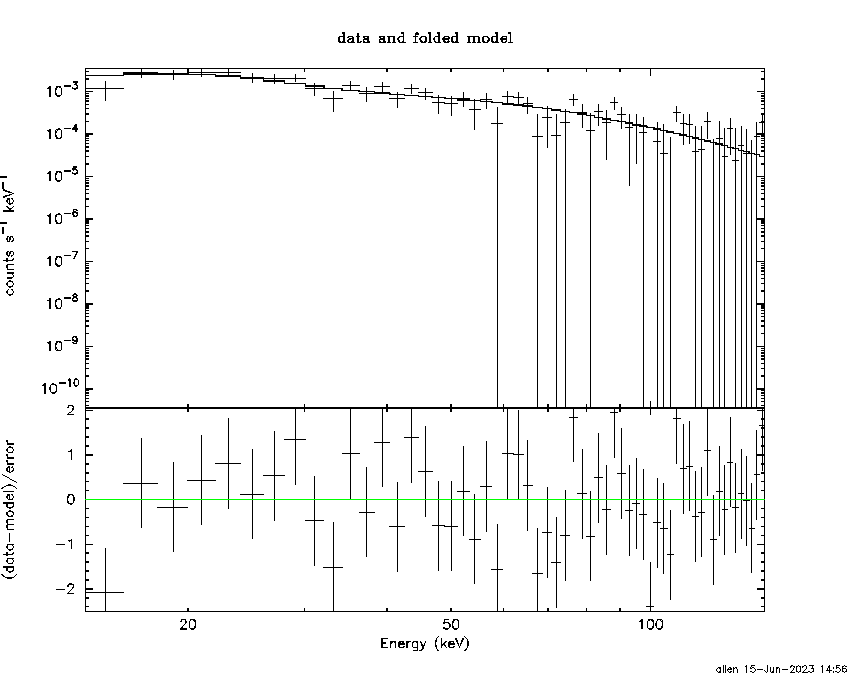
Time interval is from   -8.592 sec. to   28.408 sec.

Spectral model in power-law:
------------------------------------------------------------
Parameters  : value       lower 90%   higher 90%
Photon index: -1.87835     ( -0.171081   0.165757 )
Norm@50keV  : 4.96279E-03    ( -0.00053255   0.000523641 )
------------------------------------------------------------
#Fit statistic  : Chi-Squared                   55.06     using 59 bins.
 Reduced chi-squared = 0.965965
# Null hypothesis probability of 5.48e-01 with 57 degrees of freedom

Photon flux (15-150 keV)    in 37 sec: 0.705798 ( -0.066568  0.066632 ) ph/cm2/s
Energy fluence (15-150 keV)             : 1.68831e-06 ( -1.78224e-07  1.80528e-07 ) ergs/cm2
Cutoff power-law model
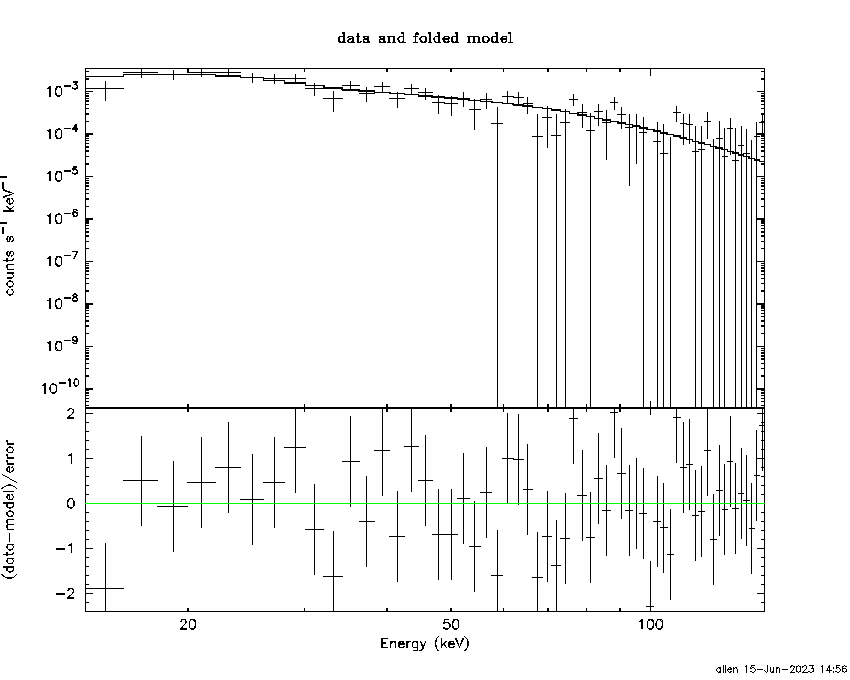
Time interval is from   -8.592 sec. to   28.408 sec.
Spectral model in the cutoff power-law:
------------------------------------------------------------
Parameters  : value       lower 90%   higher 90%
Photon index: -1.63262     ( -0.588884   0.740119 )
Epeak [keV] : 65.7029      ( -65.6507 -65.7086 )
Norm@50keV  : 6.81962E-03    ( -0.00397493   0.0108563 )
------------------------------------------------------------
#Fit statistic  : Chi-Squared                   54.64     using 59 bins.
 Reduced chi-squared = 0.975714
# Null hypothesis probability of 5.26e-01 with 56 degrees of freedom

Photon flux (15-150 keV)    in 37 sec: 0.699423 ( -0.068724  0.068615 ) ph/cm2/s
Energy fluence (15-150 keV)             : 1.64881e-06 ( -2.0709e-07  2.0204e-07 ) ergs/cm2
1-s peak spectrum fit
Power-law model
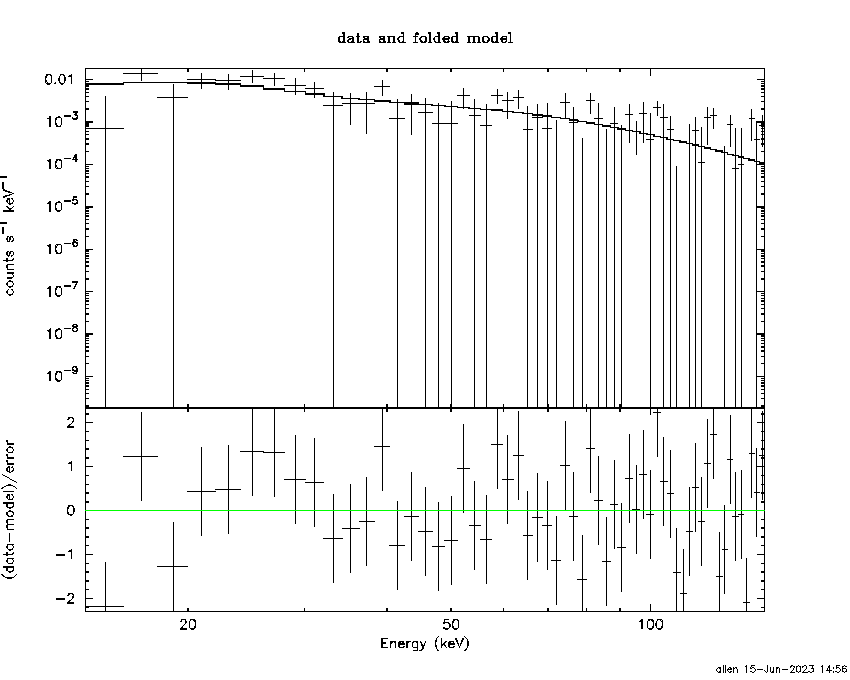
Time interval is from    0.408 sec. to    1.408 sec.

Spectral model in power-law:
------------------------------------------------------------
Parameters  : value       lower 90%   higher 90%
Photon index: -1.8375     ( -0.318828   0.298571 )
Norm@50keV  : 1.67627E-02    ( -0.00357628   0.00348882 )
------------------------------------------------------------
#Fit statistic  : Chi-Squared                   61.90     using 59 bins.
 Reduced chi-squared = 1.08596
# Null hypothesis probability of 3.05e-01 with 57 degrees of freedom

Photon flux (15-150 keV)    in 1 sec: 2.34443 ( -0.44843  0.44891 ) ph/cm2/s
Energy fluence (15-150 keV)             : 1.54188e-07 ( -3.2519e-08  3.29707e-08 ) ergs/cm2
Cutoff power-law model
Time interval is from    0.408 sec. to    1.408 sec.
Spectral model in the cutoff power-law:
------------------------------------------------------------
Parameters  : value       lower 90%   higher 90%
Photon index: -1.06921     ( -1.09266   1.54544 )
Epeak [keV] : 54.0638      ( -52.2415 -54.0641 )
Norm@50keV  : 4.52232E-02    ( -0.0452173   0.311601 )
------------------------------------------------------------
#Fit statistic  : Chi-Squared                   60.58     using 59 bins.
 Reduced chi-squared = 1.08179
# Null hypothesis probability of 3.14e-01 with 56 degrees of freedom

Photon flux (15-150 keV)    in 1 sec: 2.31630 ( -0.45035  0.45097 ) ph/cm2/s
Energy fluence (15-150 keV)             : 1.46991e-07 ( -3.49389e-08  3.50294e-08 ) ergs/cm2
Time-resolved spectra
Distribution
T90 vs. Hardness ratio plot
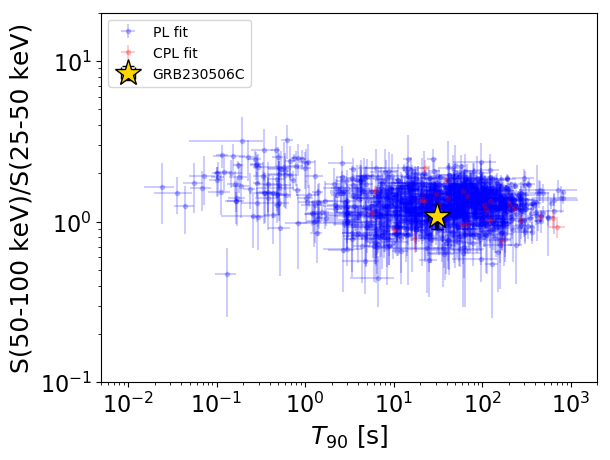
T90                                   = 31.0 sec.
Hardness ratio (energy fluence ratio) = 1.08802789534
S(15-50 keV) vs. S(50-150 keV) plot
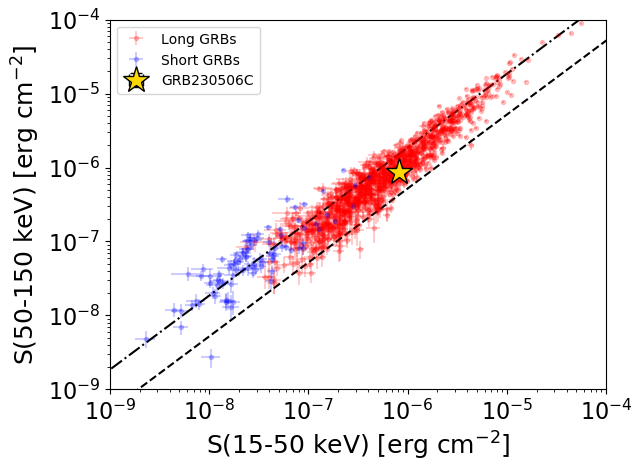
S(15-50 keV)  = 8.237643e-07
S(50-150 keV) = 8.645508e-07
The dash-dotted line and the dashed line traces the fluences calculated from the Band function with Epeak = 15 and 150 keV, respectively. Both lines assume a canonical values of alpha = -1 and beta = -2.5.
Mask shadow pattern
IMX = -8.908462002951257E-01, IMY = 2.666875510581019E-01
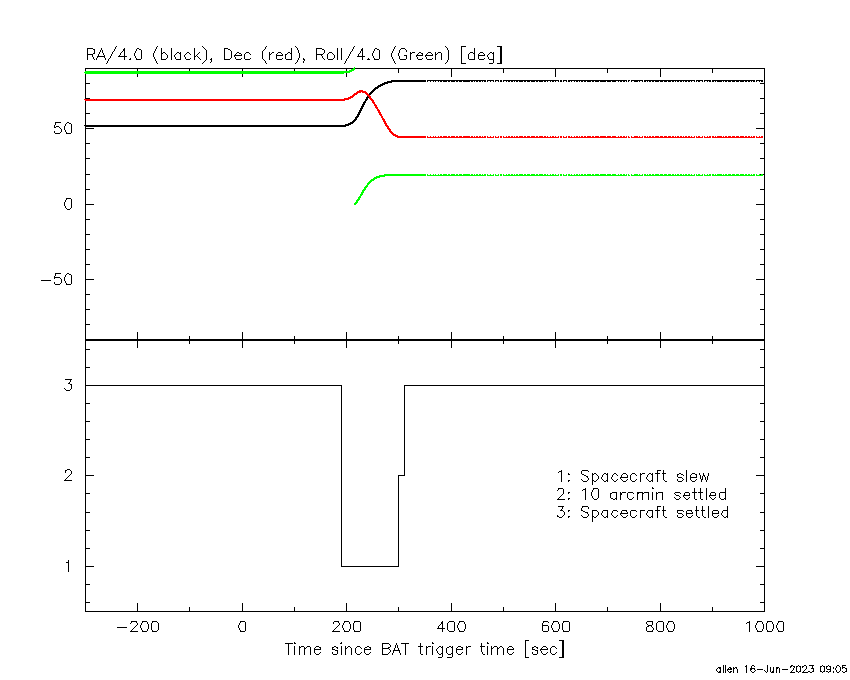
Spacecraft aspect plot
Bright source in the pre-burst/pre-slew/post-slew images
Pre-burst image of 15-350 keV band
Time interval of the image:
-239.592000 -8.592000

# RAcent  DECcent POSerr Theta    Phi  PeakCts   SNR AngSep     Name
#  [deg]    [deg]    ['] [deg]  [deg]                   [']
254.3279  35.2638   13.2  42.2   39.9   0.5707   0.9    7.9	Her X-1
308.1395  40.9605    5.7  55.5  -14.4   2.3946   2.0    1.4	Cyg X-3
211.9550  31.6524    2.4  37.7   95.8   4.4975   4.8 ------	UNKNOWN
108.3925  43.5058    2.6  53.1 -142.3   8.3258   4.5 ------	UNKNOWN
Pre-slew background subtracted image of 15-350 keV band
Time interval of the image:
-8.592000 28.408000

# RAcent  DECcent POSerr Theta    Phi  PeakCts   SNR AngSep     Name
#  [deg]    [deg]    ['] [deg]  [deg]                   [']
254.4003  35.3787   21.8  42.2   39.8  -0.1240  -0.5    3.5	Her X-1
307.9941  40.7727    0.0  55.6  -14.2  -1.0483  -2.4   12.0	Cyg X-3
235.3928  83.7639    2.9  15.4  -68.2   0.5114   4.0 ------	UNKNOWN
134.3743  45.1299    0.6  42.9 -163.3   3.1376  18.1 ------	UNKNOWN
333.5411  69.7525    2.6  36.2  -50.4   0.9276   4.5 ------	UNKNOWN
 68.3795  76.1000    2.0  32.5  -95.7   1.3010   5.9 ------	UNKNOWN
336.1046  54.9102    2.2  50.2  -42.8   2.9095   5.4 ------	UNKNOWN
Post-slew image of 15-350 keV band
Time interval of the image:
299.108610 708.741400
720.408000 774.798000
780.408000 839.078100
840.408000 962.481000

# RAcent  DECcent POSerr Theta    Phi  PeakCts   SNR AngSep     Name
#  [deg]    [deg]    ['] [deg]  [deg]                   [']
299.5933  35.1744    1.4  22.9   88.5   9.8511   8.0    1.6	Cyg X-1
308.1125  40.9543  180.2  14.3   95.2   0.0744   0.1    0.1	Cyg X-3
326.1779  38.1876   16.6   6.4   19.1   0.7751   0.7    8.0	Cyg X-2
294.0081  15.2008    2.7  40.5   67.1  14.0100   4.3 ------	UNKNOWN
340.0289   4.9117    2.1  41.2   -6.9   8.6502   5.7 ------	UNKNOWN
350.7910  45.0177    3.1  16.8  -87.1   4.3515   3.7 ------	UNKNOWN
  9.1705  55.7338    2.5  28.7 -115.1   6.1802   4.7 ------	UNKNOWN
 51.8005  72.0761    2.7  46.6 -142.0  10.5776   4.3 ------	UNKNOWN
 23.9440  48.3651    4.8  38.5 -103.6   8.1264   2.4 ------	UNKNOWN
 18.4684  32.8494    3.1  41.1  -78.7  15.5938   3.8 ------	UNKNOWN