Analysis Summary
Notes:
- 1) No attempt has been made to eliminate the non-significant decimal places.
- 2) This batgrbproduct analysis is done using the HEASARC data.
- 3) This batgrbproduct analysis is using the flight position for the mask-weighting calculation.
======================================================================
BAT GRB EVENT DATA PROCESSING REPORT
Process Script Ver: batgrbproduct v2.48
Process Start Time: Fri Oct 13 22:02:14 EDT 2023
Host Name: batproc1
Current Working Dir: /local/data/bat1/alien/Swift_3rdBATcatalog/event/batevent_reproc/trigger1167973
======================================================================
Trigger: 01167973 Segment: 000
BAT Trigger Time: 705413219.84 [s; MET]
Trigger Stop: 705413220.864 [s; MET]
UTC: 2023-05-10T12:06:28.582740 [includes UTCF correction]
Where From?: TDRSS position message
BAT
RA: 318.155739208481 Dec: 34.4426846404614 [deg; J2000]
Catalogged Source?: NO
Point Source?: YES
GRB Indicated?: YES [ by BAT flight software ]
Image S/N Ratio: 10.66
Image Trigger?: NO
Rate S/N Ratio: 21.7485631709315 [ if not an image trigger ]
Image S/N Ratio: 10.66
Analysis Position: [ source = BAT ]
RA: 318.155739208481 Dec: 34.4426846404614 [deg; J2000]
Refined Position: [ source = BAT pre-slew burst ]
RA: 318.136041854508 Dec: 34.4342091674516 [deg; J2000]
{ 21h 12m 32.7s , +34d 26' 03.2" }
+/- 0.876726902986284 [arcmin] (estimated 90% radius based on SNR)
+/- 0.234886008920805 [arcmin] (formal 1-sigma fit error)
SNR: 36.7063127697341
Angular difference between the analysis and refined position is 1.099387 arcmin
Partial Coding Fraction: 1.015625 [ including projection effects ]
Duration
T90: 178.367999911308 +/- 6.93123251560823
Measured from: -138.976000070572
to: 39.3919998407364 [s; relative to TRIGTIME]
T50: 22.7199999094009 +/- 5.63090894757922
Measured from: -1.37600004673004
to: 21.3439998626709 [s; relative to TRIGTIME]
Fluence
Peak Flux (peak 1 second)
Measured from: 15.8839999437332
to: 16.8839999437332 [s; relative to TRIGTIME]
Total Fluence
Measured from: -145.632000088692
to: 56.095999956131 [s; relative to TRIGTIME]
Band 1 Band 2 Band 3 Band 4
15-25 25-50 50-100 100-350 keV
Total 6.018531 6.165685 4.935458 1.168790
0.269637 0.280848 0.241296 0.198083 [error]
Peak 0.204935 0.274253 0.234908 0.065214
0.013268 0.014622 0.013485 0.009948 [error]
[ fluence units of on-axis counts / fully illuminated detector ]
======================================================================
====== Table of the duration information =============================
Value tstart tstop
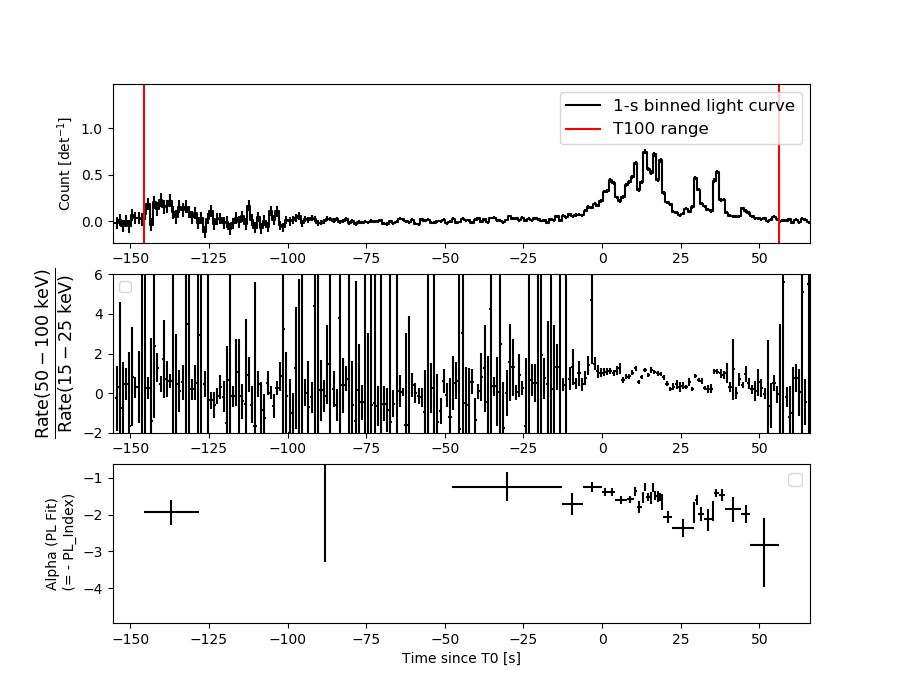
T100 201.728 -145.632 56.096
T90 178.368 -138.976 39.392
T50 22.720 -1.376 21.344
Peak 1.000 15.884 16.884
====== Spectral Analysis Summary =====================================
Model : spectral model: simple power-law (PL) and cutoff power-law (CPL)
Ph_index : photon index: E^{Ph_index}
Ph_90err : 90% error of the photon index
Epeak : Epeak in keV
Epeak_90err: 90% error of Epeak
Norm : normalization at 50 keV in both the PL model and CPL model
Nomr_90err : 90% error of the normalization
chi2 : Chi-Squared
dof : degree of freedo
=== Time-averaged spectral analysis ===
(Best model with acceptable fit: PL)
Model Ph_index Ph_90err_low Ph_90err_hi Epeak Epeak_90err_low Epeak_90err_hi Norm Nomr_90err_low Norm_90err_hi chi2 dof
PL -1.635 -0.095 0.094 - - - 5.57e-03 -2.80e-04 2.79e-04 67.970 57
CPL -1.615 -0.115 0.260 972.797 -972.797 -972.797 5.70e-03 -3.99e-04 1.51e-04 68.070 56
=== 1-s peak spectral analysis ===
(Best model with acceptable fit: PL)
Model Ph_index Ph_90err_low Ph_90err_hi Epeak Epeak_90err_low Epeak_90err_hi Norm Nomr_90err_low Norm_90err_hi chi2 dof
PL -1.334 -0.105 0.104 - - - 4.90e-02 -2.83e-03 2.83e-03 51.480 57
CPL -1.322 -0.116 0.350 9978.300 -9978.300 -9978.300 4.96e-02 -3.29e-03 2.24e-02 51.560 56
=== Fluence/Peak Flux Summary ===
Model Band1 Band2 Band3 Band4 Band5 Total
15-25 25-50 50-100 100-350 15-150 15-350 keV
Fluence PL 1.63e-06 2.76e-06 3.55e-06 9.21e-06 1.05e-05 1.71e-05 erg/cm2
90%_error_low -1.42e-07 -1.42e-07 -2.41e-07 -1.31e-06 -5.61e-07 -1.49e-06 erg/cm2
90%_error_hi 1.47e-07 1.41e-07 2.40e-07 1.46e-06 5.64e-07 1.61e-06 erg/cm2
Peak flux PL 1.72e+00 1.91e+00 1.52e+00 1.99e+00 5.88e+00 7.14e+00 ph/cm2/s
90%_error_low -1.82e-01 -1.23e-01 -1.09e-01 -2.89e-01 -3.44e-01 -4.27e-01 ph/cm2/s
90%_error_hi 1.88e-01 1.22e-01 1.08e-01 3.19e-01 3.44e-01 4.31e-01 ph/cm2/s
Fluence CPL 1.64e-06 2.75e-06 3.53e-06 1.01e-05 1.05e-05 1.68e-05 erg/cm2
90%_error_low -1.62e-07 -1.47e-07 -2.24e-07 N/A -6.43e-07 -2.89e-06 erg/cm2
90%_error_hi 1.51e-07 1.64e-07 2.58e-07 N/A 5.91e-07 1.86e-06 erg/cm2
Peak flux CPL 1.72e+00 1.91e+00 1.51e+00 2.04e+00 5.89e+00 7.20e+00 ph/cm2/s
90%_error_low -1.87e-01 -1.22e-01 -1.10e-01 -7.29e-01 -3.66e-01 -8.92e-01 ph/cm2/s
90%_error_hi 1.87e-01 1.34e-01 1.28e-01 1.27e-01 3.49e-01 3.66e-01 ph/cm2/s
======================================================================
Image
Pre-slew 15.0-350.0 keV image (Event data)
#   RAcent    DECcent   POSerr    Theta     Phi              Peak Cts       SNR   Name
  318.1360    34.4342   0.0052     8.6178   -17.2314         6.4120871     36.706 TRIG_01167973

Foreground time interval of the image:
-32.939  11.461 (delta_t =  44.400 [sec])
Background time interval of the image:
Light Curves
Note: The mask-weighted lightcurves have units of either count/det or counts/sec/det, where a det is 0.4 x 0.4 = 0.16 sq cm.
Full-time range; 1 s binning
Other quick-look light curves:
Spectra
Notes:
- 1) The fitting includes the systematic errors.
- 2) When the burst includes telescope slew time periods, the fitting uses an average response file made from multiple 5-s response files through out the slew time plus single time preiod for the non-slew times, and weighted by the total counts in the corresponding time period using addrmf. An average response file is needed becuase a spectral fit using the pre-slew DRM will introduce some errors in both a spectral shape and a normalization if the PHA file contains a lot of the slew/post-slew time interval.
- 3) For fits to more complicated models (e.g. a power-law over a cutoff power-law), the BAT team has decided to require a chi-square improvement of more than 6 for each extra dof.
Time averaged spectrum fit using the average DRM
Power-law model
Time interval is from -145.632 sec. to   56.096 sec.

Spectral model in power-law:
------------------------------------------------------------
Parameters  : value       lower 90%   higher 90%
Photon index: -1.63502     ( -0.0945728   0.0935679 )
Norm@50keV  : 5.57112E-03    ( -0.000279858   0.000278728 )
------------------------------------------------------------
#Fit statistic  : Chi-Squared                   67.97     using 59 bins.
 Reduced chi-squared = 1.19246
# Null hypothesis probability of 1.52e-01 with 57 degrees of freedom

Photon flux (15-150 keV)    in 201.7 sec: 0.723927 ( -0.036862  0.037001 ) ph/cm2/s
Energy fluence (15-150 keV)             : 1.04685e-05 ( -5.6099e-07  5.64018e-07 ) ergs/cm2
Cutoff power-law model

Time interval is from -145.632 sec. to   56.096 sec.
Spectral model in the cutoff power-law:
------------------------------------------------------------
Parameters  : value       lower 90%   higher 90%
Photon index: -1.63318     ( -0.11489   0.260268 )
Epeak [keV] : 1.00000E+04      ( -10000 -10000 )
Norm@50keV  : 5.58324E-03    ( -0.000281024   0.000269058 )
------------------------------------------------------------
#Fit statistic  : Chi-Squared                   67.98     using 59 bins.
 Reduced chi-squared = 1.21393
# Null hypothesis probability of 1.31e-01 with 56 degrees of freedom

Photon flux (15-150 keV)    in 201.7 sec: 0.725923 ( -0.043466  0.038627 ) ph/cm2/s
Energy fluence (15-150 keV)             : 1.04951e-05 ( -6.42588e-07  5.90695e-07 ) ergs/cm2
1-s peak spectrum fit
Power-law model
Time interval is from   15.884 sec. to   16.884 sec.

Spectral model in power-law:
------------------------------------------------------------
Parameters  : value       lower 90%   higher 90%
Photon index: -1.334     ( -0.104631   0.104483 )
Norm@50keV  : 4.90013E-02    ( -0.00283176   0.0028252 )
------------------------------------------------------------
#Fit statistic  : Chi-Squared                   51.48     using 59 bins.
 Reduced chi-squared = 0.903158
# Null hypothesis probability of 6.81e-01 with 57 degrees of freedom

Photon flux (15-150 keV)    in 1 sec: 5.88425 ( -0.34357  0.34401 ) ph/cm2/s
Energy fluence (15-150 keV)             : 4.80386e-07 ( -3.14132e-08  3.16258e-08 ) ergs/cm2
Cutoff power-law model

Time interval is from   15.884 sec. to   16.884 sec.
Spectral model in the cutoff power-law:
------------------------------------------------------------
Parameters  : value       lower 90%   higher 90%
Photon index: -1.32169     ( -0.10621   0.359534 )
Epeak [keV] : 9978.30      ( -9999.34 -9999.34 )
Norm@50keV  : 4.96448E-02    ( -0.00284154   0.02284 )
------------------------------------------------------------
#Fit statistic  : Chi-Squared                   51.56     using 59 bins.
 Reduced chi-squared = 0.920714
# Null hypothesis probability of 6.43e-01 with 56 degrees of freedom

Photon flux (15-150 keV)    in 1 sec: 5.89159 ( -0.36602  0.34858 ) ph/cm2/s
Energy fluence (15-150 keV)             : 4.81271e-07 ( -3.59533e-08  3.24768e-08 ) ergs/cm2
Time-resolved spectra
Distribution
T90 vs. Hardness ratio plot
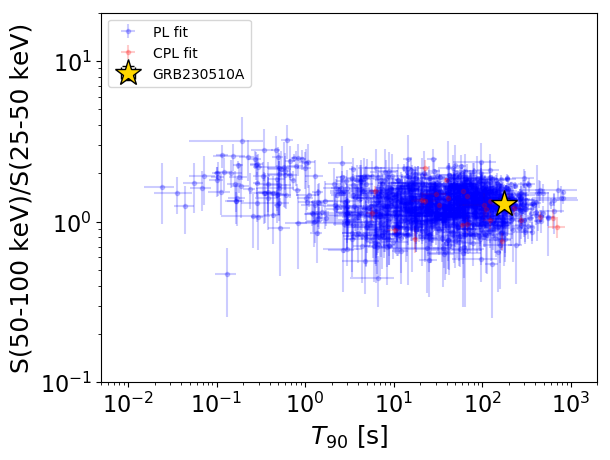
T90                                   = 178.368 sec.
Hardness ratio (energy fluence ratio) = 1.28789324963
S(15-50 keV) vs. S(50-150 keV) plot
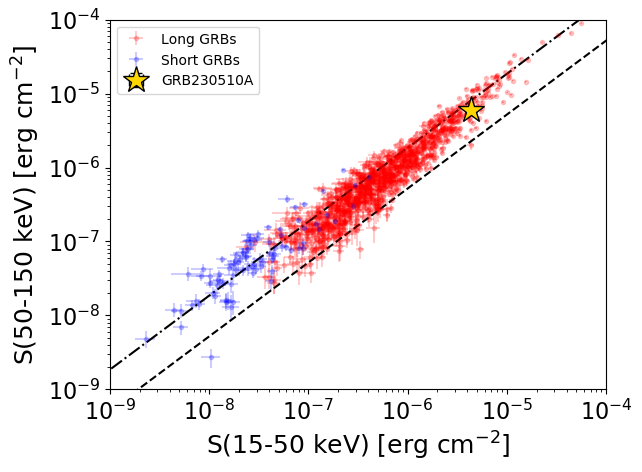
S(15-50 keV)  = 4.385355e-06
S(50-150 keV) = 6.083181e-06
The dash-dotted line and the dashed line traces the fluences calculated from the Band function with Epeak = 15 and 150 keV, respectively. Both lines assume a canonical values of alpha = -1 and beta = -2.5.
Mask shadow pattern
IMX = 1.447515832337387E-01, IMY = 4.489497646591305E-02
Spacecraft aspect plot
Bright source in the pre-burst/pre-slew/post-slew images
Pre-burst image of 15-350 keV band
Time interval of the image:
Pre-slew background subtracted image of 15-350 keV band
Time interval of the image:
-32.939400 11.460600

# RAcent  DECcent POSerr Theta    Phi  PeakCts   SNR AngSep     Name
#  [deg]    [deg]    ['] [deg]  [deg]                   [']
254.4928  35.4718    4.3  44.0  127.5  -2.3031  -2.7    7.9	Her X-1
288.9273  11.0207    8.5  35.7   64.8   0.4793   1.4    8.8	GRS 1915+105
299.5427  35.2115    1.6  10.7   86.6   1.2347   7.3    2.4	Cyg X-1
308.2082  40.9131    6.3   2.1  114.4   0.2932   1.8    5.0	Cyg X-3
325.9936  38.2874    8.9  11.8  -56.1  -0.2132  -1.3    8.6	Cyg X-2
299.4753  15.6480    2.5  27.3   50.5   0.8664   4.5 ------	UNKNOWN
318.1361  34.4342    0.3   8.6  -17.2   6.4121  36.7 ------	UNKNOWN
Post-slew image of 15-350 keV band
Time interval of the image:
51.060600 782.430000
900.160000 934.860600

# RAcent  DECcent POSerr Theta    Phi  PeakCts   SNR AngSep     Name
#  [deg]    [deg]    ['] [deg]  [deg]                   [']
288.8158  11.0724    7.3  35.5   70.3  -2.9087  -1.6    7.7	GRS 1915+105
299.5309  35.1887    1.0  15.3  112.5  11.2988  11.2    3.0	Cyg X-1
307.9130  40.9282   10.4  10.4  146.1   1.0255   1.1    9.1	Cyg X-3
325.9576  38.4126   13.0   7.4 -110.2  -0.8684  -0.9   11.5	Cyg X-2
286.5464  19.6293    2.8  31.6   84.7   6.3829   4.1 ------	UNKNOWN
308.9518  -8.9020    3.7  44.2   27.5   4.3989   3.1 ------	UNKNOWN