Analysis Summary
Notes:
- 1) No attempt has been made to eliminate the non-significant decimal places.
- 2) This batgrbproduct analysis is done using the HEASARC data.
- 3) This batgrbproduct analysis is using the flight position for the mask-weighting calculation.
======================================================================
BAT GRB EVENT DATA PROCESSING REPORT
Process Script Ver: batgrbproduct v2.48
Process Start Time: Fri Sep 29 23:46:08 EDT 2023
Host Name: batproc1
Current Working Dir: /local/data/bat1/alien/Swift_3rdBATcatalog/event/batevent_reproc/trigger1173731
======================================================================
Trigger: 01173731 Segment: 000
BAT Trigger Time: 707703308.736 [s; MET]
Trigger Stop: 707703310.784 [s; MET]
UTC: 2023-06-06T00:14:37.322360 [includes UTCF correction]
Where From?: TDRSS position message
BAT
RA: 166.816687835473 Dec: 36.4846778033881 [deg; J2000]
Catalogged Source?: NO
Point Source?: YES
GRB Indicated?: YES [ by BAT flight software ]
Image S/N Ratio: 7.88
Image Trigger?: NO
Rate S/N Ratio: 9.59166304662544 [ if not an image trigger ]
Image S/N Ratio: 7.88
Analysis Position: [ source = BAT ]
RA: 166.816687835473 Dec: 36.4846778033881 [deg; J2000]
Refined Position: [ source = BAT pre-slew burst ]
RA: 166.776906637782 Dec: 36.5037979692158 [deg; J2000]
{ 11h 07m 06.5s , +36d 30' 13.7" }
+/- 2.46745048146596 [arcmin] (estimated 90% radius based on SNR)
+/- 1.0679767706449 [arcmin] (formal 1-sigma fit error)
SNR: 8.37073238382393
Angular difference between the analysis and refined position is 2.235634 arcmin
Partial Coding Fraction: 0.1523438 [ including projection effects ]
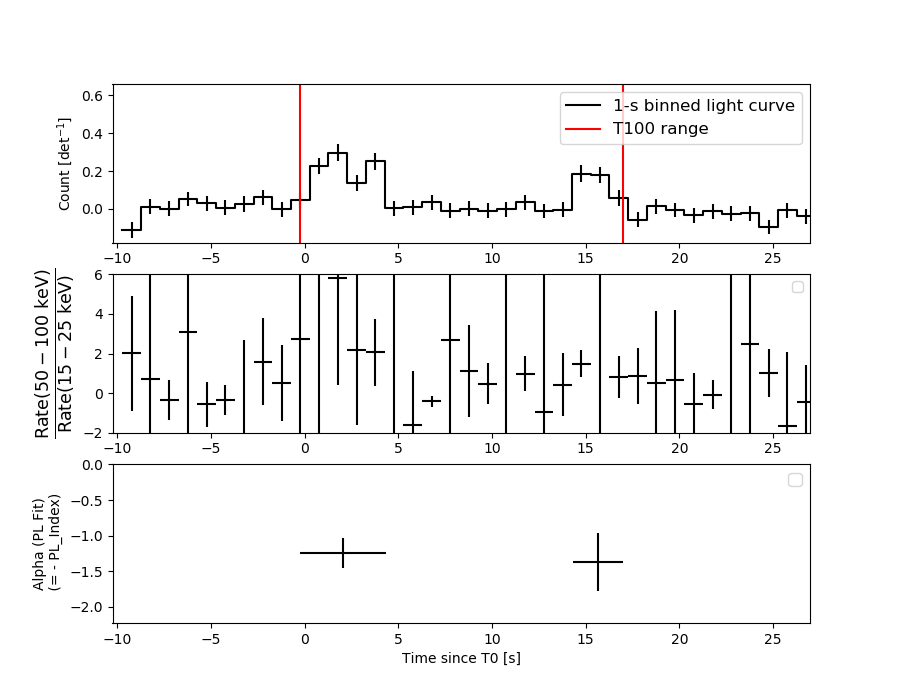
Duration
T90: 16.2560000419617 +/- 1.30701494300898
Measured from: 0.0880000591278076
to: 16.3440001010895 [s; relative to TRIGTIME]
T50: 13.0080000162125 +/- 10.3557952505818
Measured from: 1.49600005149841
to: 14.5040000677109 [s; relative to TRIGTIME]
Fluence
Peak Flux (peak 1 second)
Measured from: 0.924000024795532
to: 1.92400002479553 [s; relative to TRIGTIME]
Total Fluence
Measured from: -0.263999938964844
to: 16.9680000543594 [s; relative to TRIGTIME]
Band 1 Band 2 Band 3 Band 4
15-25 25-50 50-100 100-350 keV
Total 0.306375 0.483378 0.552017 0.172361
0.085266 0.091446 0.085416 0.080158 [error]
Peak 0.044864 0.101783 0.139296 0.033223
0.021240 0.023325 0.021975 0.020292 [error]
[ fluence units of on-axis counts / fully illuminated detector ]
======================================================================
====== Table of the duration information =============================
Value tstart tstop
T100 17.232 -0.264 16.968
T90 16.256 0.088 16.344
T50 13.008 1.496 14.504
Peak 1.000 0.924 1.924
====== Spectral Analysis Summary =====================================
Model : spectral model: simple power-law (PL) and cutoff power-law (CPL)
Ph_index : photon index: E^{Ph_index}
Ph_90err : 90% error of the photon index
Epeak : Epeak in keV
Epeak_90err: 90% error of Epeak
Norm : normalization at 50 keV in both the PL model and CPL model
Nomr_90err : 90% error of the normalization
chi2 : Chi-Squared
dof : degree of freedo
=== Time-averaged spectral analysis ===
(Best model with acceptable fit: PL)
Model Ph_index Ph_90err_low Ph_90err_hi Epeak Epeak_90err_low Epeak_90err_hi Norm Nomr_90err_low Norm_90err_hi chi2 dof
PL -1.177 -0.298 0.311 - - - 6.93e-03 -1.18e-03 1.17e-03 34.380 57
CPL -0.964 -4.329 0.950 287.272 N/A N/A 8.58e-03 N/A N/A 34.420 56
=== 1-s peak spectral analysis ===
(Best model with acceptable fit: PL)
Model Ph_index Ph_90err_low Ph_90err_hi Epeak Epeak_90err_low Epeak_90err_hi Norm Nomr_90err_low Norm_90err_hi chi2 dof
PL -1.296 -0.353 0.355 - - - 2.25e-02 -4.90e-03 4.90e-03 67.030 57
CPL 1.643 -2.252 4.835 73.655 -13.928 47.539 3.68e-01 -3.68e-01 1.84e+01 61.300 56
=== Fluence/Peak Flux Summary ===
Model Band1 Band2 Band3 Band4 Band5 Total
15-25 25-50 50-100 100-350 15-150 15-350 keV
Fluence PL 1.13e-07 2.53e-07 4.47e-07 1.86e-06 1.22e-06 2.67e-06 erg/cm2
90%_error_low -3.74e-08 -5.39e-08 -8.31e-08 -6.84e-07 -2.12e-07 -7.38e-07 erg/cm2
90%_error_hi 4.23e-08 5.23e-08 8.14e-08 9.24e-07 2.12e-07 9.35e-07 erg/cm2
Peak flux PL 7.62e-01 8.66e-01 7.06e-01 9.60e-01 2.69e+00 3.29e+00 ph/cm2/s
90%_error_low -2.86e-01 -2.25e-01 -1.70e-01 -4.00e-01 -6.15e-01 -7.18e-01 ph/cm2/s
90%_error_hi 3.35e-01 2.23e-01 1.68e-01 5.33e-01 6.24e-01 7.24e-01 ph/cm2/s
Fluence CPL 1.11e-07 2.53e-07 4.50e-07 1.73e-06 1.22e-06 2.51e-06 erg/cm2
90%_error_low -5.09e-08 -5.36e-08 -8.48e-08 -1.30e-06 -2.20e-07 -1.28e-06 erg/cm2
90%_error_hi 3.10e-08 5.70e-08 1.08e-07 6.12e-07 2.14e-07 1.03e-06 erg/cm2
Peak flux CPL 2.98e-01 8.69e-01 9.15e-01 2.26e-01 2.27e+00 2.31e+00 ph/cm2/s
90%_error_low -2.98e-01 -3.60e-01 -2.37e-01 -2.26e-01 -6.70e-01 -6.99e-01 ph/cm2/s
90%_error_hi 4.35e-01 2.93e-01 2.56e-01 4.00e-01 6.96e-01 7.96e-01 ph/cm2/s
======================================================================
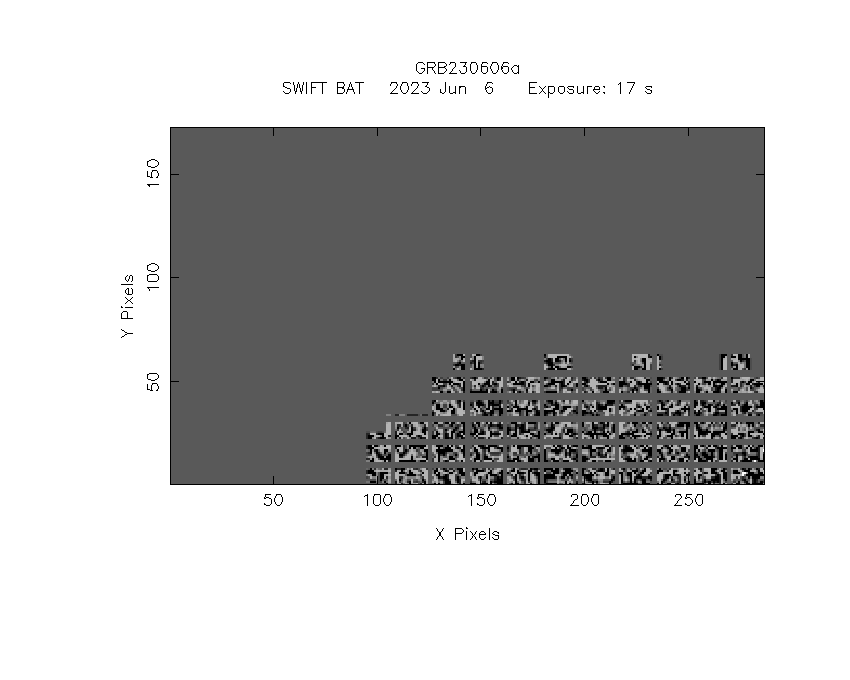
Image
Pre-slew 15.0-350.0 keV image (Event data)
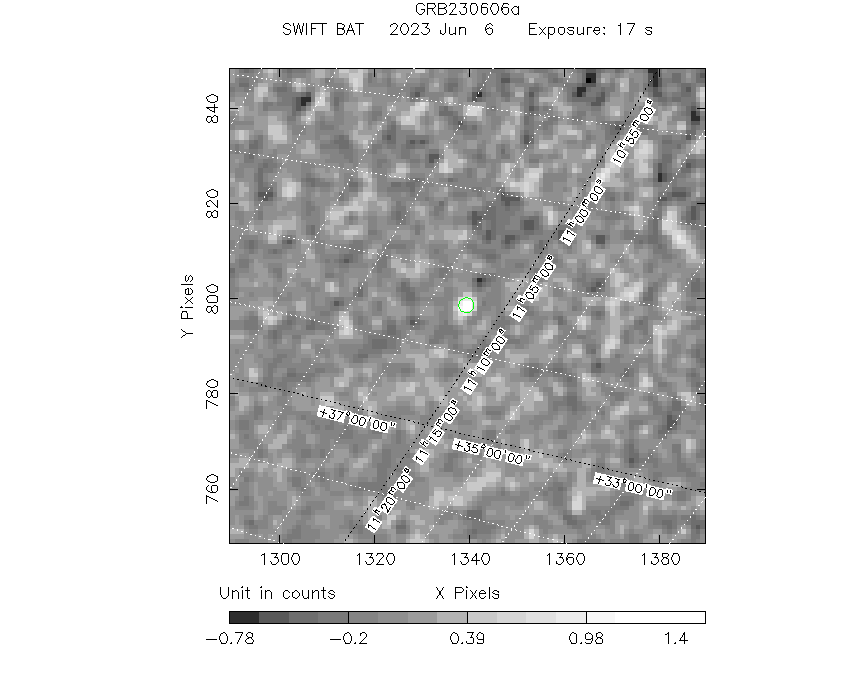
#   RAcent    DECcent   POSerr    Theta     Phi              Peak Cts       SNR   Name
  166.7769    36.5038   0.0230    49.6989  -144.9846         1.7724579      8.371 TRIG_01173731

Foreground time interval of the image:
 -0.264  16.968 (delta_t =  17.232 [sec])
Background time interval of the image:
-208.835  -0.264 (delta_t = 208.571 [sec])
Light Curves
Note: The mask-weighted lightcurves have units of either count/det or counts/sec/det, where a det is 0.4 x 0.4 = 0.16 sq cm.
Full-time range; 1 s binning
Other quick-look light curves:
- 64 ms binning (zoomed)
- 16 ms binning (zoomed)
- 8 ms binning (zoomed)
- 2 ms binning (zoomed)
- SN=5 or 10 s binning (full-time range)
- Raw light curve
Spectra
- 64 ms binning (zoomed)
- 16 ms binning (zoomed)
- 8 ms binning (zoomed)
- 2 ms binning (zoomed)
- SN=5 or 10 s binning (full-time range)
- Raw light curve
Spectra
Notes:
- 1) The fitting includes the systematic errors.
- 2) When the burst includes telescope slew time periods, the fitting uses an average response file made from multiple 5-s response files through out the slew time plus single time preiod for the non-slew times, and weighted by the total counts in the corresponding time period using addrmf. An average response file is needed becuase a spectral fit using the pre-slew DRM will introduce some errors in both a spectral shape and a normalization if the PHA file contains a lot of the slew/post-slew time interval.
- 3) For fits to more complicated models (e.g. a power-law over a cutoff power-law), the BAT team has decided to require a chi-square improvement of more than 6 for each extra dof.
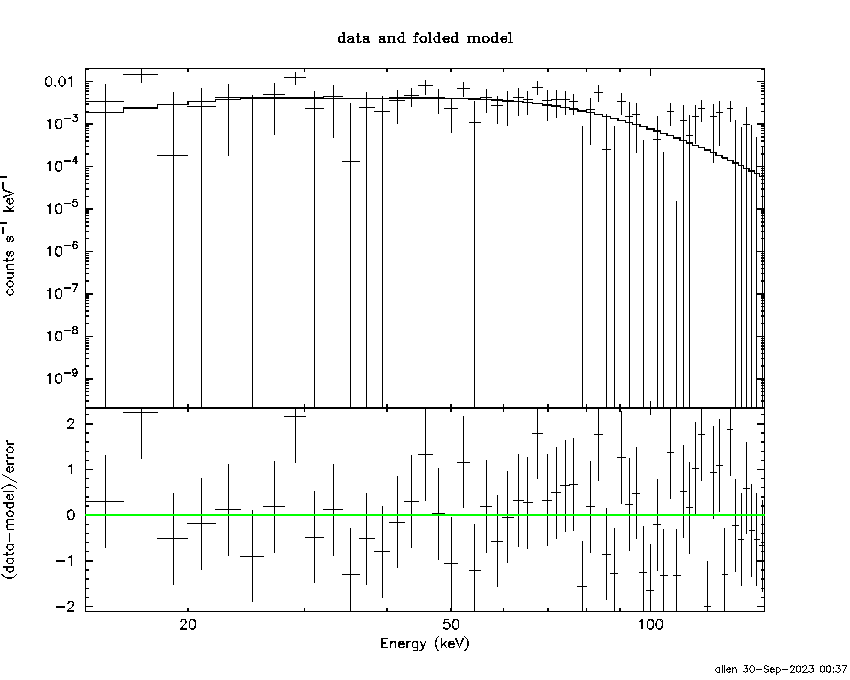
Time averaged spectrum fit using the average DRM
Power-law model
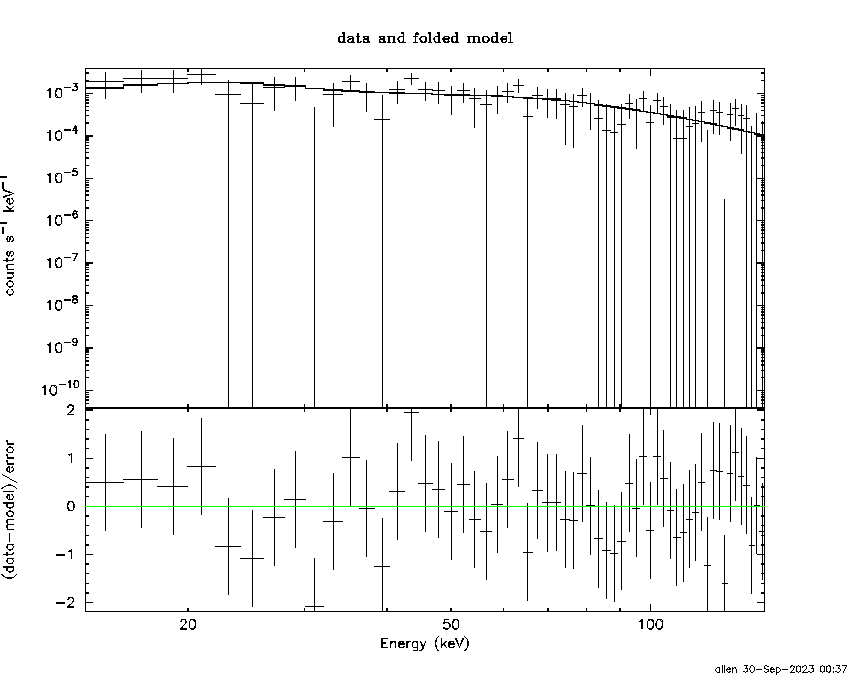
Time interval is from   -0.264 sec. to   16.968 sec.

Spectral model in power-law:
------------------------------------------------------------
Parameters  : value       lower 90%   higher 90%
Photon index: -1.17664     ( -0.298174   0.31082 )
Norm@50keV  : 6.93141E-03    ( -0.0011809   0.00117099 )
------------------------------------------------------------
#Fit statistic  : Chi-Squared                   34.38     using 59 bins.
 Reduced chi-squared = 0.603158
# Null hypothesis probability of 9.92e-01 with 57 degrees of freedom

Photon flux (15-150 keV)    in 17.23 sec: 0.811035 ( -0.146431  0.14784 ) ph/cm2/s
Energy fluence (15-150 keV)             : 1.21993e-06 ( -2.11827e-07  2.12473e-07 ) ergs/cm2
Cutoff power-law model
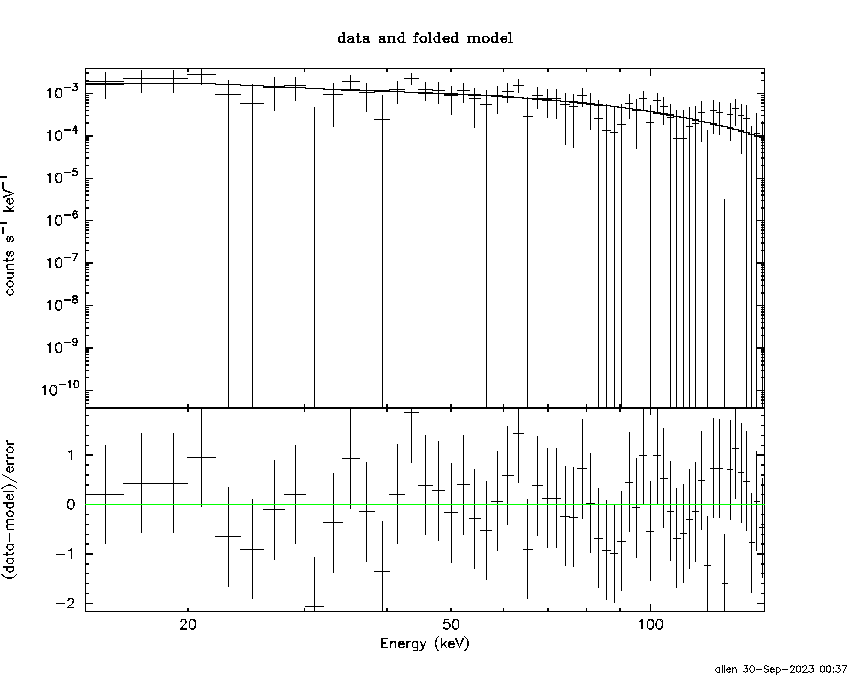
Time interval is from   -0.264 sec. to   16.968 sec.
Spectral model in the cutoff power-law:
------------------------------------------------------------
Parameters  : value       lower 90%   higher 90%
Photon index: -2.15555     ( -3.13715   2.14147 )
Epeak [keV] : 55.4589      (   )
Norm@50keV  : 1.05589E-03    (     )
------------------------------------------------------------
#Fit statistic  : Chi-Squared                   33.30     using 59 bins.
 Reduced chi-squared = 0.594643
# Null hypothesis probability of 9.93e-01 with 56 degrees of freedom

Photon flux (15-150 keV)    in 17.23 sec: 0.810418 ( -0.156731  0.148253 ) ph/cm2/s
Energy fluence (15-150 keV)             : 1.21783e-06 ( -2.19793e-07  2.13621e-07 ) ergs/cm2
1-s peak spectrum fit
Power-law model
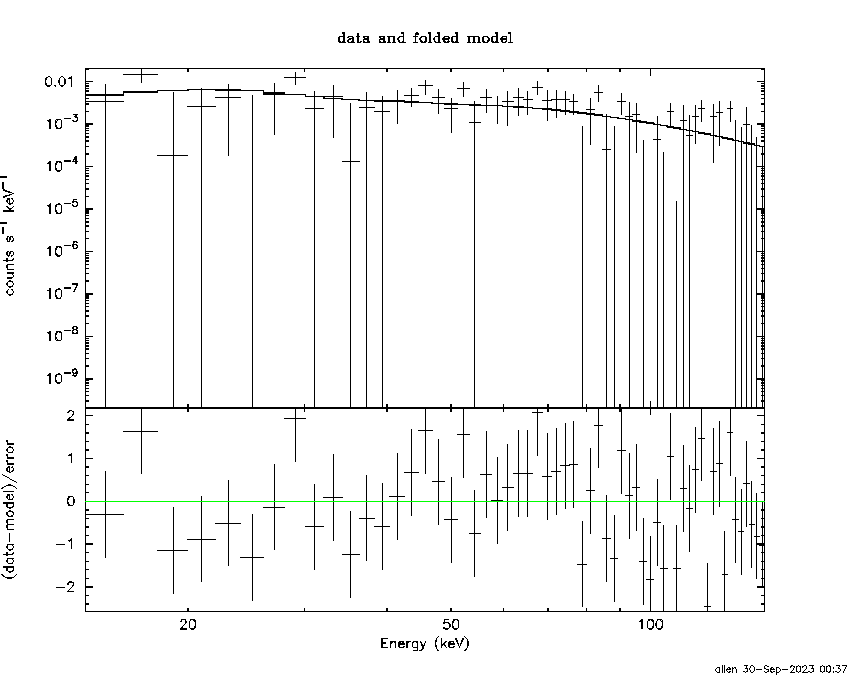
Time interval is from    0.924 sec. to    1.924 sec.

Spectral model in power-law:
------------------------------------------------------------
Parameters  : value       lower 90%   higher 90%
Photon index: -1.29563     ( -0.352483   0.355852 )
Norm@50keV  : 2.25240E-02    ( -0.0049028   0.00489841 )
------------------------------------------------------------
#Fit statistic  : Chi-Squared                   67.03     using 59 bins.
 Reduced chi-squared = 1.17596
# Null hypothesis probability of 1.71e-01 with 57 degrees of freedom

Photon flux (15-150 keV)    in 1 sec: 2.68525 ( -0.615  0.62367 ) ph/cm2/s
Energy fluence (15-150 keV)             : 2.22828e-07 ( -5.05261e-08  5.09068e-08 ) ergs/cm2
Cutoff power-law model
Time interval is from    0.924 sec. to    1.924 sec.
Spectral model in the cutoff power-law:
------------------------------------------------------------
Parameters  : value       lower 90%   higher 90%
Photon index: 1.64305     ( -2.26041   4.82659 )
Epeak [keV] : 73.6551      ( -13.9022 47.5646 )
Norm@50keV  : 0.367729    ( -0.371797   18.3521 )
------------------------------------------------------------
#Fit statistic  : Chi-Squared                   61.30     using 59 bins.
 Reduced chi-squared = 1.09464
# Null hypothesis probability of 2.92e-01 with 56 degrees of freedom

Photon flux (15-150 keV)    in 1 sec: 2.27455 ( -0.66997  0.69601 ) ph/cm2/s
Energy fluence (15-150 keV)             : 2.00106e-07 ( -5.29595e-08  5.48587e-08 ) ergs/cm2
Time-resolved spectra
Distribution
T90 vs. Hardness ratio plot
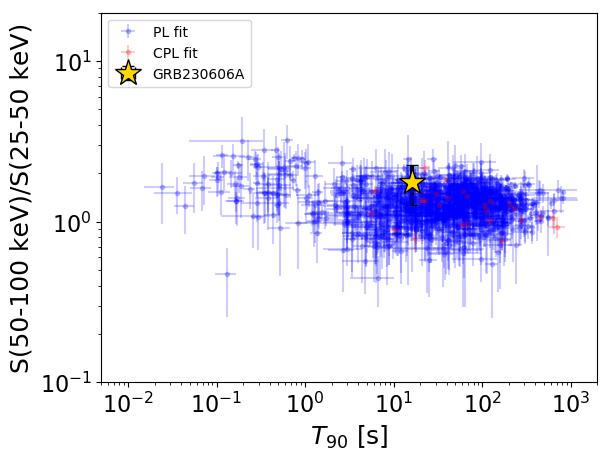
T90                                   = 16.256 sec.
Hardness ratio (energy fluence ratio) = 1.76957928546
S(15-50 keV) vs. S(50-150 keV) plot
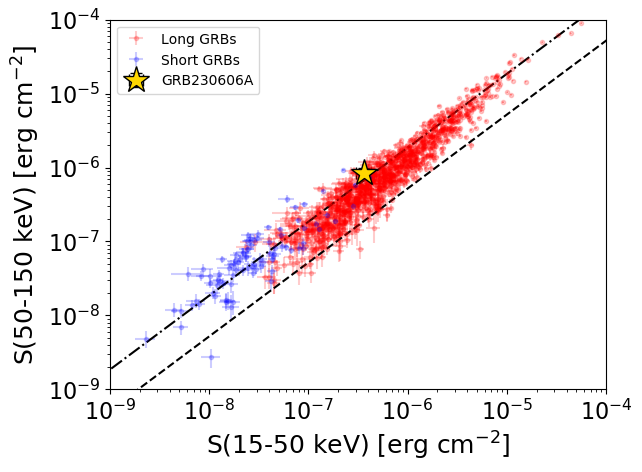
S(15-50 keV)  = 3.653876e-07
S(50-150 keV) = 8.54532e-07
The dash-dotted line and the dashed line traces the fluences calculated from the Band function with Epeak = 15 and 150 keV, respectively. Both lines assume a canonical values of alpha = -1 and beta = -2.5.
Mask shadow pattern
IMX = -9.656927480165931E-01, IMY = 6.765720113939392E-01
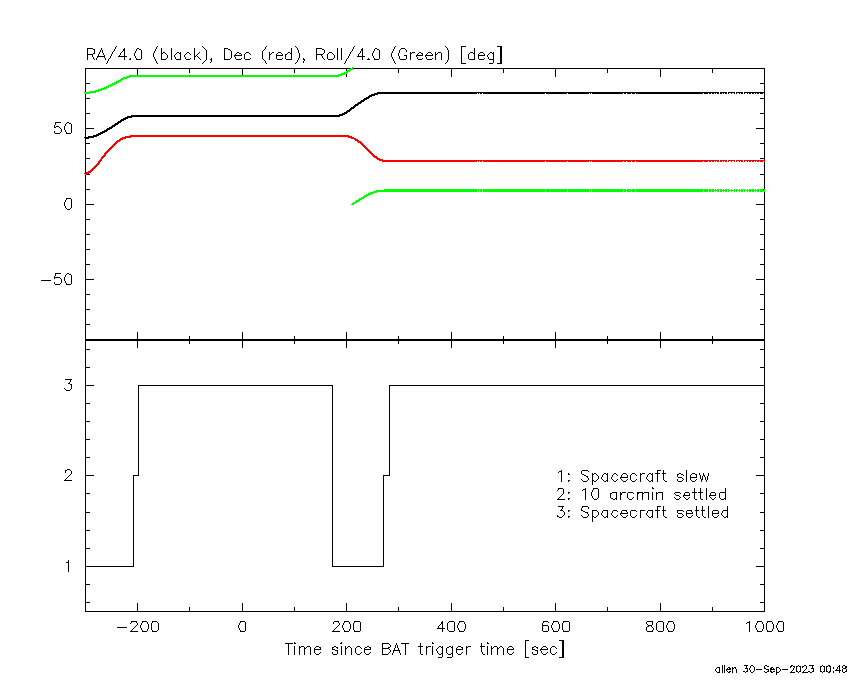
Spacecraft aspect plot
Bright source in the pre-burst/pre-slew/post-slew images
Pre-burst image of 15-350 keV band
Time interval of the image:
-208.835400 -0.264000

# RAcent  DECcent POSerr Theta    Phi  PeakCts   SNR AngSep     Name
#  [deg]    [deg]    ['] [deg]  [deg]                   [']
254.2692  35.4208   28.9  18.6   44.1  -0.2750  -0.4   10.3	Her X-1
299.5501  35.2386    5.6  50.1    7.1   2.5278   2.0    3.0	Cyg X-1
308.2022  40.7859    0.0  53.0   -3.5   0.8549   0.7   10.8	Cyg X-3
303.2599  29.3670    2.3  56.1   10.9  13.2213   5.0 ------	UNKNOWN
263.9029  42.6526    2.3  22.0   15.5   3.1977   4.9 ------	UNKNOWN
210.6405  50.6148    3.0  16.2 -131.3   2.2740   3.9 ------	UNKNOWN
163.0248  41.3799    2.6  49.7 -137.5  10.7328   4.4 ------	UNKNOWN
Pre-slew background subtracted image of 15-350 keV band
Time interval of the image:
-0.264000 16.968000

# RAcent  DECcent POSerr Theta    Phi  PeakCts   SNR AngSep     Name
#  [deg]    [deg]    ['] [deg]  [deg]                   [']
254.3207  35.1792    4.4  18.7   44.6   0.1781   2.6   11.9	Her X-1
299.5252  35.1182   10.5  50.2    7.2  -0.1801  -1.1    5.9	Cyg X-1
308.3139  40.9493    5.3  53.0   -3.8  -0.3720  -2.2    9.2	Cyg X-3
182.4943  22.3064    2.1  47.0 -171.2   0.6598   5.4 ------	UNKNOWN
166.7769  36.5038    1.4  49.7 -145.0   1.7727   8.4 ------	UNKNOWN
318.8484  71.3689    2.0  46.5  -43.7   1.0780   5.7 ------	UNKNOWN
Post-slew image of 15-350 keV band
Time interval of the image:
270.364590 962.386000

# RAcent  DECcent POSerr Theta    Phi  PeakCts   SNR AngSep     Name
#  [deg]    [deg]    ['] [deg]  [deg]                   [']
254.6541  35.4078  191.9  35.4  165.5   0.0996   0.1   10.4	Her X-1
268.3816  -1.5543   11.9  40.2   99.8  -3.0200  -1.0    6.2	SW J1753.5-0127
288.7593  10.7923   14.1  19.2   76.1  -1.1711  -0.8    9.5	GRS 1915+105
299.5790  35.2334    1.5   7.2 -102.2   8.3899   7.9    2.0	Cyg X-1
308.1887  41.0204    4.6  15.8  -90.4   3.0563   2.5    5.4	Cyg X-3
326.1555  38.4885    9.8  26.8  -65.4   1.7547   1.2   10.0	Cyg X-2
280.4666   0.8434    3.1  31.6   84.7   8.3882   3.7 ------	UNKNOWN
239.3151  44.3668    3.2  47.1  179.3  10.3638   3.6 ------	UNKNOWN
229.2214  54.2839    2.7  53.7 -167.9  14.7862   4.3 ------	UNKNOWN