Analysis Summary
Notes:
- 1) No attempt has been made to eliminate the non-significant decimal places.
- 2) This batgrbproduct analysis is done using the HEASARC data.
- 3) This batgrbproduct analysis is using the flight position for the mask-weighting calculation.
======================================================================
BAT GRB EVENT DATA PROCESSING REPORT
Process Script Ver: batgrbproduct v2.48
Process Start Time: Fri Sep 29 23:44:40 EDT 2023
Host Name: batproc1
Current Working Dir: /local/data/bat1/alien/Swift_3rdBATcatalog/event/batevent_reproc/trigger1175438
======================================================================
Trigger: 01175438 Segment: 000
BAT Trigger Time: 708753104 [s; MET]
Trigger Stop: 708753168 [s; MET]
UTC: 2023-06-18T03:51:12.514680 [includes UTCF correction]
Where From?: TDRSS position message
BAT
RA: 196.587853653914 Dec: 3.30563521685384 [deg; J2000]
Catalogged Source?: NO
Point Source?: YES
GRB Indicated?: YES [ by BAT flight software ]
Image S/N Ratio: 9.51
Image Trigger?: YES
Rate S/N Ratio: 0 [ if not an image trigger ]
Image S/N Ratio: 9.51
Analysis Position: [ source = BAT ]
RA: 196.587853653914 Dec: 3.30563521685384 [deg; J2000]
Refined Position: [ source = BAT pre-slew burst ]
RA: 196.642173771207 Dec: 3.27763596434458 [deg; J2000]
{ 13h 06m 34.1s , +03d 16' 39.5" }
+/- 1.74288169421218 [arcmin] (estimated 90% radius based on SNR)
+/- 0.585596477885003 [arcmin] (formal 1-sigma fit error)
SNR: 13.7546625260131
Angular difference between the analysis and refined position is 3.661920 arcmin
Partial Coding Fraction: 1 [ including projection effects ]
Duration
T90: 104.051999926567 +/- 22.861103937456
Measured from: -18.2480000257492
to: 85.8039999008179 [s; relative to TRIGTIME]
T50: 42.7999999523163 +/- 14.8709461041166
Measured from: -8.6599999666214
to: 34.1399999856949 [s; relative to TRIGTIME]
Fluence
Peak Flux (peak 1 second)
Measured from: 9.03999996185303
to: 10.039999961853 [s; relative to TRIGTIME]
Total Fluence
Measured from: -27.7840000391006
to: 107.003999948502 [s; relative to TRIGTIME]
Band 1 Band 2 Band 3 Band 4
15-25 25-50 50-100 100-350 keV
Total 0.602872 0.902874 0.768033 0.114716
0.073540 0.076038 0.066132 0.057699 [error]
Peak 0.020939 0.009625 0.030498 0.007920
0.006316 0.006698 0.005775 0.005069 [error]
[ fluence units of on-axis counts / fully illuminated detector ]
======================================================================
====== Table of the duration information =============================
Value tstart tstop
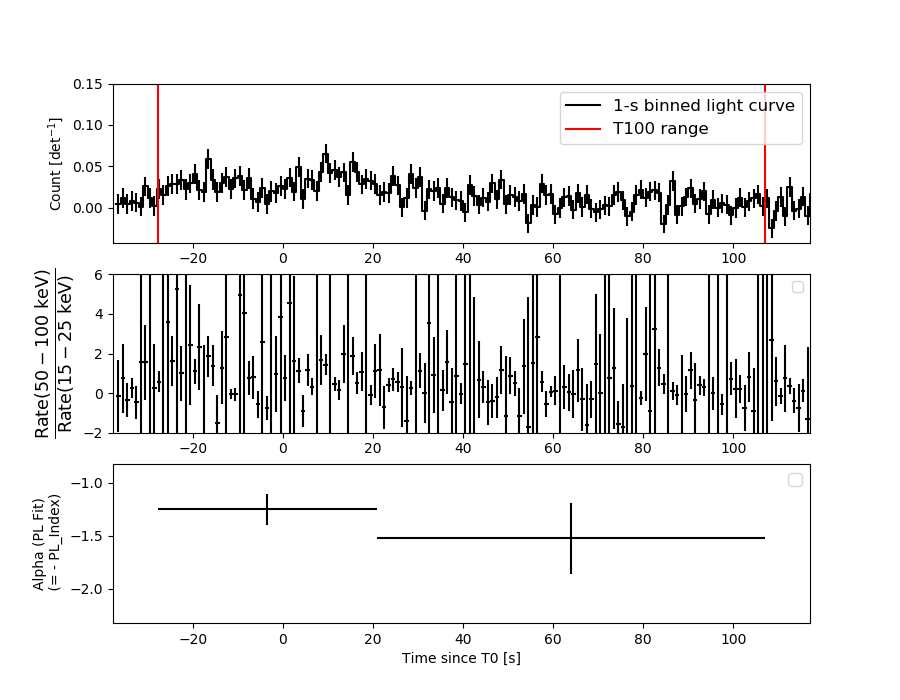
T100 134.788 -27.784 107.004
T90 104.052 -18.248 85.804
T50 42.800 -8.660 34.140
Peak 1.000 9.040 10.040
====== Spectral Analysis Summary =====================================
Model : spectral model: simple power-law (PL) and cutoff power-law (CPL)
Ph_index : photon index: E^{Ph_index}
Ph_90err : 90% error of the photon index
Epeak : Epeak in keV
Epeak_90err: 90% error of Epeak
Norm : normalization at 50 keV in both the PL model and CPL model
Nomr_90err : 90% error of the normalization
chi2 : Chi-Squared
dof : degree of freedo
=== Time-averaged spectral analysis ===
(Best model with acceptable fit: PL)
Model Ph_index Ph_90err_low Ph_90err_hi Epeak Epeak_90err_low Epeak_90err_hi Norm Nomr_90err_low Norm_90err_hi chi2 dof
PL -1.350 -0.154 0.154 - - - 1.17e-03 -1.05e-04 1.04e-04 49.390 57
CPL -0.887 -0.570 0.671 122.730 -45.694 -122.730 1.98e-03 -8.71e-04 2.17e-03 47.580 56
=== 1-s peak spectral analysis ===
(Best model with acceptable fit: PL)
Model Ph_index Ph_90err_low Ph_90err_hi Epeak Epeak_90err_low Epeak_90err_hi Norm Nomr_90err_low Norm_90err_hi chi2 dof
PL -0.796 -0.522 0.601 - - - 4.28e-03 -1.35e-03 1.25e-03 59.600 57
CPL -0.710 0.710 3.093 995.801 -995.801 -995.801 4.61e-03 -1.65e-03 -4.61e-03 59.660 56
=== Fluence/Peak Flux Summary ===
Model Band1 Band2 Band3 Band4 Band5 Total
15-25 25-50 50-100 100-350 15-150 15-350 keV
Fluence PL 1.75e-07 3.52e-07 5.53e-07 1.92e-06 1.54e-06 3.00e-06 erg/cm2
90%_error_low -2.68e-08 -3.36e-08 -6.28e-08 -4.31e-07 -1.54e-07 -4.84e-07 erg/cm2
90%_error_hi 2.79e-08 3.34e-08 6.24e-08 5.13e-07 1.56e-07 5.51e-07 erg/cm2
Peak flux PL 9.00e-02 1.38e-01 1.59e-01 3.52e-01 4.92e-01 7.39e-01 ph/cm2/s
90%_error_low -5.28e-02 -5.78e-02 -4.37e-02 -1.82e-01 -1.41e-01 -2.14e-01 ph/cm2/s
90%_error_hi 7.05e-02 5.57e-02 4.30e-02 2.95e-01 1.43e-01 2.53e-01 ph/cm2/s
Fluence CPL 1.61e-07 3.69e-07 5.70e-07 9.84e-07 1.49e-06 2.08e-06 erg/cm2
90%_error_low -3.21e-08 -3.97e-08 -6.84e-08 -5.23e-07 -1.69e-07 -5.47e-07 erg/cm2
90%_error_hi 3.27e-08 4.09e-08 6.98e-08 1.09e-06 1.70e-07 1.10e-06 erg/cm2
Peak flux CPL 8.99e-02 1.38e-01 1.59e-01 3.49e-01 4.91e-01 7.37e-01 ph/cm2/s
90%_error_low -5.30e-02 -5.79e-02 -4.38e-02 -9.26e-02 -1.41e-01 -1.96e-01 ph/cm2/s
90%_error_hi 7.04e-02 5.57e-02 4.31e-02 2.92e-01 1.43e-01 2.49e-01 ph/cm2/s
======================================================================
Image
Pre-slew 15.0-350.0 keV image (Event data)
#   RAcent    DECcent   POSerr    Theta     Phi              Peak Cts       SNR   Name
  196.6422     3.2776   0.0139     5.4456    89.7705         1.9491461     13.755 TRIG_01175438

Foreground time interval of the image:
-27.784  73.301 (delta_t = 101.085 [sec])
Background time interval of the image:
-275.000 -27.784 (delta_t = 247.216 [sec])
Light Curves
Note: The mask-weighted lightcurves have units of either count/det or counts/sec/det, where a det is 0.4 x 0.4 = 0.16 sq cm.
Full-time range; 1 s binning
Other quick-look light curves:
- 64 ms binning (zoomed)
- 16 ms binning (zoomed)
- 8 ms binning (zoomed)
- 2 ms binning (zoomed)
- SN=5 or 10 s binning (full-time range)
- Raw light curve
Spectra
- 64 ms binning (zoomed)
- 16 ms binning (zoomed)
- 8 ms binning (zoomed)
- 2 ms binning (zoomed)
- SN=5 or 10 s binning (full-time range)
- Raw light curve
Spectra
Notes:
- 1) The fitting includes the systematic errors.
- 2) When the burst includes telescope slew time periods, the fitting uses an average response file made from multiple 5-s response files through out the slew time plus single time preiod for the non-slew times, and weighted by the total counts in the corresponding time period using addrmf. An average response file is needed becuase a spectral fit using the pre-slew DRM will introduce some errors in both a spectral shape and a normalization if the PHA file contains a lot of the slew/post-slew time interval.
- 3) For fits to more complicated models (e.g. a power-law over a cutoff power-law), the BAT team has decided to require a chi-square improvement of more than 6 for each extra dof.
Time averaged spectrum fit using the average DRM
Power-law model
Time interval is from  -27.784 sec. to  107.004 sec.

Spectral model in power-law:
------------------------------------------------------------
Parameters  : value       lower 90%   higher 90%
Photon index: -1.35014     ( -0.153726   0.153983 )
Norm@50keV  : 1.16885E-03    ( -0.000104842   0.000104435 )
------------------------------------------------------------
#Fit statistic  : Chi-Squared                   49.39     using 59 bins.
 Reduced chi-squared = 0.866491
# Null hypothesis probability of 7.53e-01 with 57 degrees of freedom

Photon flux (15-150 keV)    in 134.8 sec: 0.140819 ( -0.012675  0.012688 ) ph/cm2/s
Energy fluence (15-150 keV)             : 1.539e-06 ( -1.53934e-07  1.55612e-07 ) ergs/cm2
Cutoff power-law model
Time interval is from  -27.784 sec. to  107.004 sec.
Spectral model in the cutoff power-law:
------------------------------------------------------------
Parameters  : value       lower 90%   higher 90%
Photon index: -0.887185     ( -0.569645   0.671297 )
Epeak [keV] : 122.730      ( -45.6931 -122.73 )
Norm@50keV  : 1.98472E-03    ( -0.000871428   0.00217435 )
------------------------------------------------------------
#Fit statistic  : Chi-Squared                   47.58     using 59 bins.
 Reduced chi-squared = 0.849643
# Null hypothesis probability of 7.81e-01 with 56 degrees of freedom

Photon flux (15-150 keV)    in 134.8 sec: 0.137931 ( -0.01323  0.013205 ) ph/cm2/s
Energy fluence (15-150 keV)             : 1.48501e-06 ( -1.69302e-07  1.69921e-07 ) ergs/cm2
1-s peak spectrum fit
Power-law model
Time interval is from    9.040 sec. to   10.040 sec.

Spectral model in power-law:
------------------------------------------------------------
Parameters  : value       lower 90%   higher 90%
Photon index: -0.795654     ( -0.522368   0.601262 )
Norm@50keV  : 4.27706E-03    ( -0.00134963   0.00124564 )
------------------------------------------------------------
#Fit statistic  : Chi-Squared                   59.60     using 59 bins.
 Reduced chi-squared = 1.04561
# Null hypothesis probability of 3.81e-01 with 57 degrees of freedom

Photon flux (15-150 keV)    in 1 sec: 0.491641 ( -0.141227  0.14307 ) ph/cm2/s
Energy fluence (15-150 keV)             : 5.00783e-08 ( -1.40362e-08  1.40884e-08 ) ergs/cm2
Cutoff power-law model

Time interval is from    9.040 sec. to   10.040 sec.
Spectral model in the cutoff power-law:
------------------------------------------------------------
Parameters  : value       lower 90%   higher 90%
Photon index: -0.787048     ( 0.710087   3.09313 )
Epeak [keV] : 1.00000E+04      ( -10000 -10000 )
Norm@50keV  : 4.30562E-03    ( -0.00135447   -0.00430633 )
------------------------------------------------------------
#Fit statistic  : Chi-Squared                   59.61     using 59 bins.
 Reduced chi-squared = 1.06446
# Null hypothesis probability of 3.46e-01 with 56 degrees of freedom

Photon flux (15-150 keV)    in 1 sec: 0.491476 ( -0.141253  0.143032 ) ph/cm2/s
Energy fluence (15-150 keV)             : 5.00553e-08 ( -1.40215e-08  1.40996e-08 ) ergs/cm2
Time-resolved spectra
Distribution
T90 vs. Hardness ratio plot

T90                                   = 104.052 sec.
Hardness ratio (energy fluence ratio) = 1.56906139939
S(15-50 keV) vs. S(50-150 keV) plot
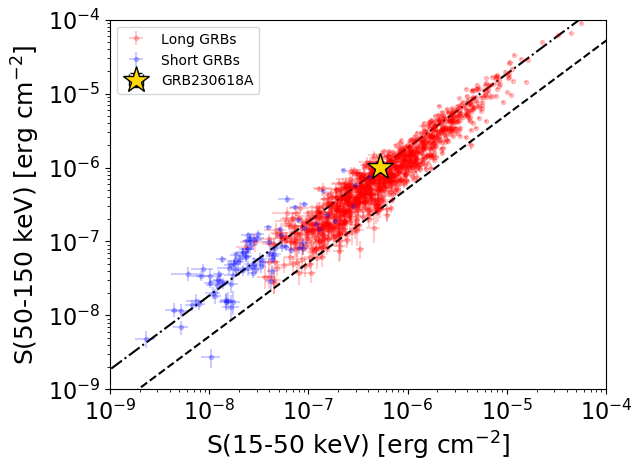
S(15-50 keV)  = 5.270481e-07
S(50-150 keV) = 1.011968e-06
The dash-dotted line and the dashed line traces the fluences calculated from the Band function with Epeak = 15 and 150 keV, respectively. Both lines assume a canonical values of alpha = -1 and beta = -2.5.
Mask shadow pattern
IMX = 3.817690076934504E-04, IMY = -9.533068798711747E-02
Spacecraft aspect plot
Bright source in the pre-burst/pre-slew/post-slew images
Pre-burst image of 15-350 keV band
Time interval of the image:
-275.000000 -27.784000

# RAcent  DECcent POSerr Theta    Phi  PeakCts   SNR AngSep     Name
#  [deg]    [deg]    ['] [deg]  [deg]                   [']
221.7400  -6.3782    3.5  32.2   77.6   2.5484   3.3 ------	UNKNOWN
239.7130  45.9997    2.4  56.9    2.4   7.0688   4.7 ------	UNKNOWN
144.2993 -21.1214    3.3  54.5 -157.1   4.7235   3.5 ------	UNKNOWN
Pre-slew background subtracted image of 15-350 keV band
Time interval of the image:
-27.784000 73.300600

# RAcent  DECcent POSerr Theta    Phi  PeakCts   SNR AngSep     Name
#  [deg]    [deg]    ['] [deg]  [deg]                   [']
196.6421   3.2776    0.8   5.4   89.8   1.9490  13.8 ------	UNKNOWN
Post-slew image of 15-350 keV band
Time interval of the image:
114.500610 289.513000
291.000000 963.012400

# RAcent  DECcent POSerr Theta    Phi  PeakCts   SNR AngSep     Name
#  [deg]    [deg]    ['] [deg]  [deg]                   [']
227.8539  -4.0281    3.8  32.1   77.5   7.7413   3.1 ------	UNKNOWN
226.3339  -7.5675    2.3  31.6   84.7  12.0379   4.9 ------	UNKNOWN
219.7701   8.9129    2.8  23.7   49.8   6.3529   4.1 ------	UNKNOWN