Analysis Summary
Notes:
- 1) No attempt has been made to eliminate the non-significant decimal places.
- 2) This batgrbproduct analysis is done using the HEASARC data.
- 3) This batgrbproduct analysis is using the flight position for the mask-weighting calculation.
======================================================================
                  BAT GRB EVENT DATA PROCESSING REPORT
    Process Script Ver: batgrbproduct v2.48
    Process Start Time: Fri Sep 29 23:41:34 EDT 2023
             Host Name: batproc1
   Current Working Dir: /local/data/bat1/alien/Swift_3rdBATcatalog/event/batevent_reproc/trigger1176135
======================================================================

  Trigger: 01176135      Segment: 000

  BAT Trigger Time: 709121092.8   [s; MET]
      Trigger Stop: 709121093.312   [s; MET]
               UTC: 2023-06-22T10:04:21.289560    [includes UTCF correction]
       Where From?: TDRSS position message

  BAT
    RA: 292.532303762044   Dec: -32.9215292302855  [deg; J2000]

     Catalogged Source?: NO
     Point Source?:      YES
     GRB Indicated?:     YES    [ by BAT flight software ]
     Image S/N Ratio:    7.44
     Image Trigger?:     NO
     Rate S/N Ratio:     15.0996688705415  [ if not an image trigger ]
     Image S/N Ratio:    7.44

  Analysis Position:   [ source = BAT ]
    RA: 292.532303762044   Dec: -32.9215292302855  [deg; J2000]

  Refined Position:   [ source = BAT pre-slew burst ]
    RA: 292.502760160136   Dec: -32.9803340829587  [deg; J2000]
        { 19h 30m 00.7s , -32d 58' 49.2" }
         +/- 2.15640907849766 [arcmin] (estimated 90% radius based on SNR)
         +/- 1.06812416062953 [arcmin] (formal 1-sigma fit error)
    SNR: 10.1475124322736

  Angular difference between the analysis and refined position is 3.829020 arcmin

  Partial Coding Fraction: 0.3085938    [ including projection effects ]

  Duration
     T90: 23.5519998073578 +/- 17.7298482053297
        Measured from: 0.160000085830688
                   to: 23.7119998931885     [s; relative to TRIGTIME]
     T50: 13.1839998960495 +/- 12.0682432974597
        Measured from: 0.544000029563904
                   to: 13.7279999256134     [s; relative to TRIGTIME]


  Fluence
     Peak Flux  (peak 1 second)
        Measured from: 0.0760000944137573
                   to: 1.07600009441376     [s; relative to TRIGTIME]
     Total Fluence
        Measured from: -0.031999945640564
                   to: 24.1600000858307     [s; relative to TRIGTIME]

             Band 1     Band 2     Band 3     Band 4
              15-25      25-50     50-100    100-350     keV
 Total     0.500068   0.265982   0.119510   0.082973
           0.059994   0.061444   0.052107   0.049503 [error]
 Peak      0.121938   0.134785   0.062735   0.018784
           0.015348   0.016747   0.013148   0.010648 [error]

     [ fluence units of on-axis counts / fully illuminated detector ]

======================================================================


====== Table of the duration information =============================

        Value   tstart    tstop
T100   24.192   -0.032   24.160
T90    23.552    0.160   23.712
T50    13.184    0.544   13.728
Peak    1.000    0.076    1.076


====== Spectral Analysis Summary =====================================

Model      : spectral model: simple power-law (PL) and cutoff power-law (CPL)
Ph_index   : photon index: E^{Ph_index}
Ph_90err   : 90% error of the photon index
Epeak      : Epeak in keV
Epeak_90err: 90% error of Epeak
Norm       : normalization at 50 keV in both the PL model and CPL model
Nomr_90err : 90% error of the normalization
chi2       : Chi-Squared
dof        : degree of freedo

=== Time-averaged spectral analysis ===
(Best model with acceptable fit: PL)

Model Ph_index Ph_90err_low Ph_90err_hi  Epeak  Epeak_90err_low  Epeak_90err_hi  Norm       Nomr_90err_low    Norm_90err_hi    chi2    dof
PL      -2.547    -0.459      0.386       -           -               -         1.69e-03     -5.61e-04          5.66e-04      62.330   57
CPL     -1.919     N/A        N/A           4.254      N/A           N/A         4.42e-03        N/A               N/A         61.950   56


=== 1-s peak spectral analysis ===
(Best model with acceptable fit: PL)

Model Ph_index Ph_90err_low Ph_90err_hi  Epeak  Epeak_90err_low  Epeak_90err_hi  Norm       Nomr_90err_low    Norm_90err_hi    chi2    dof
PL      -2.129     -0.256     0.234       -           -               -         1.74e-02     -3.26e-03          3.18e-03      48.250   57
CPL     -0.666     -1.072     1.355       37.436      -9.253        10.523      1.27e-01     -1.27e-01          6.87e-01      42.460   56


=== Fluence/Peak Flux Summary ===

              Model    Band1     Band2     Band3     Band4     Band5     Total
                       15-25     25-50    50-100    100-350    15-150    15-350    keV
Fluence         PL   1.41e-07  1.38e-07  9.42e-08  1.01e-07  4.13e-07  4.74e-07   erg/cm2
      90%_error_low -2.98e-08 -3.17e-08 -3.93e-08 -6.19e-08 -9.76e-08 -1.33e-07   erg/cm2
      90%_error_hi   3.00e-08  3.03e-08  4.57e-08  1.10e-07  1.05e-07  1.70e-07   erg/cm2
Peak flux       PL   1.32e+00  9.15e-01  4.19e-01  2.67e-01  2.78e+00  2.92e+00   ph/cm2/s
      90%_error_low -2.36e-01 -1.31e-01 -9.85e-02 -1.01e-01 -3.90e-01 -4.13e-01   ph/cm2/s
      90%_error_hi   2.42e-01  1.30e-01  1.01e-01  1.29e-01  3.90e-01  4.14e-01   ph/cm2/s

Fluence        CPL   1.40e-07  1.46e-07  8.04e-08  2.61e-08  3.86e-07  3.94e-07   erg/cm2
      90%_error_low -2.79e-08 -3.30e-08 -5.92e-08 -2.27e-08 -1.03e-07 -1.11e-07   erg/cm2
      90%_error_hi   3.00e-08  3.97e-08  5.41e-08  1.07e-07  1.11e-07  1.63e-07   erg/cm2
Peak flux      CPL   1.17e+00  1.10e+00  4.14e-01  5.49e-02  2.73e+00  2.74e+00   ph/cm2/s
      90%_error_low -2.72e-01 -1.85e-01 -1.28e-01 -5.49e-02 -3.89e-01 -3.93e-01   ph/cm2/s
      90%_error_hi   2.71e-01  1.92e-01  1.23e-01  1.18e-01  3.90e-01  3.96e-01   ph/cm2/s

======================================================================
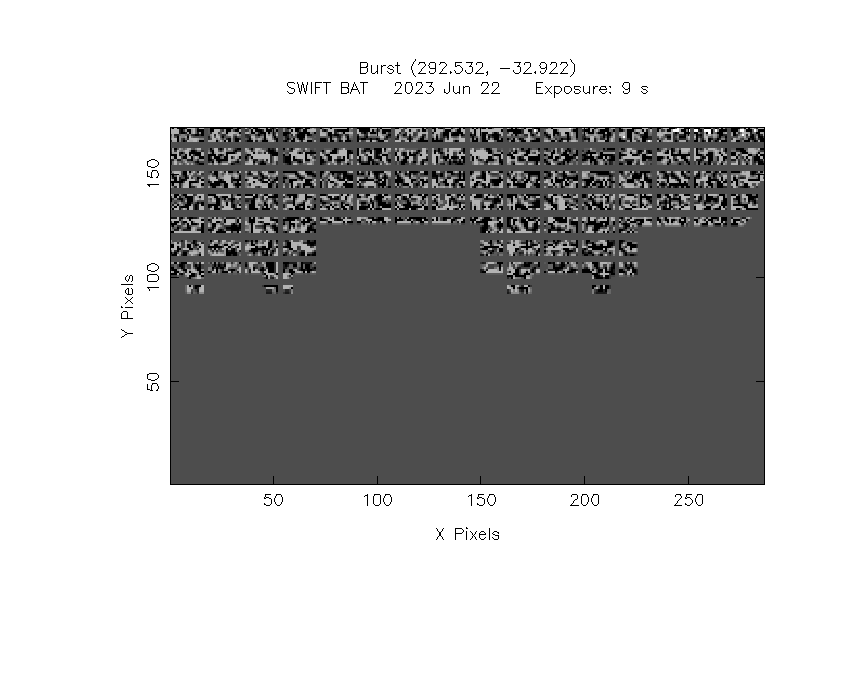
Image
Pre-slew 15.0-350.0 keV image (Event data)
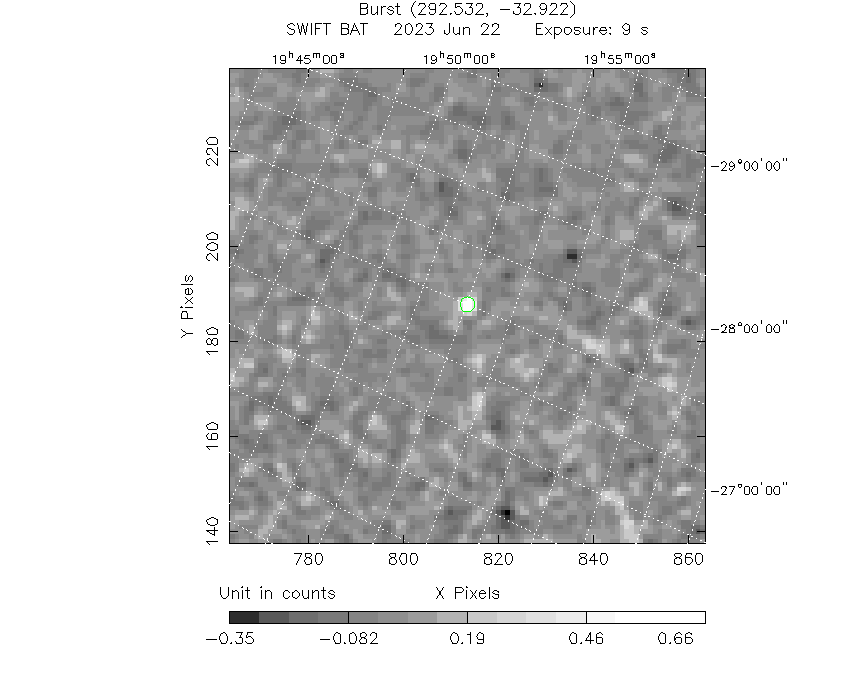
#   RAcent    DECcent   POSerr    Theta     Phi              Peak Cts       SNR   Name
  292.5028   -32.9803   0.0189    31.9015    77.1033         0.7647154     10.148 TRIG_01176135

Foreground time interval of the image:
 -0.032   9.101 (delta_t =   9.133 [sec])
Background time interval of the image:
-368.800 -278.688 (delta_t =  90.112 [sec])
-239.800  -0.032 (delta_t = 239.768 [sec])
Light Curves
Note: The mask-weighted lightcurves have units of either count/det or counts/sec/det, where a det is 0.4 x 0.4 = 0.16 sq cm.
Full-time range; 1 s binning
Other quick-look light curves:
- 64 ms binning (zoomed)
- 16 ms binning (zoomed)
- 8 ms binning (zoomed)
- 2 ms binning (zoomed)
- SN=5 or 10 s binning (full-time range)
- Raw light curve
Spectra
- 64 ms binning (zoomed)
- 16 ms binning (zoomed)
- 8 ms binning (zoomed)
- 2 ms binning (zoomed)
- SN=5 or 10 s binning (full-time range)
- Raw light curve
Spectra
Notes:
- 1) The fitting includes the systematic errors.
- 2) When the burst includes telescope slew time periods, the fitting uses an average response file made from multiple 5-s response files through out the slew time plus single time preiod for the non-slew times, and weighted by the total counts in the corresponding time period using addrmf. An average response file is needed becuase a spectral fit using the pre-slew DRM will introduce some errors in both a spectral shape and a normalization if the PHA file contains a lot of the slew/post-slew time interval.
- 3) For fits to more complicated models (e.g. a power-law over a cutoff power-law), the BAT team has decided to require a chi-square improvement of more than 6 for each extra dof.
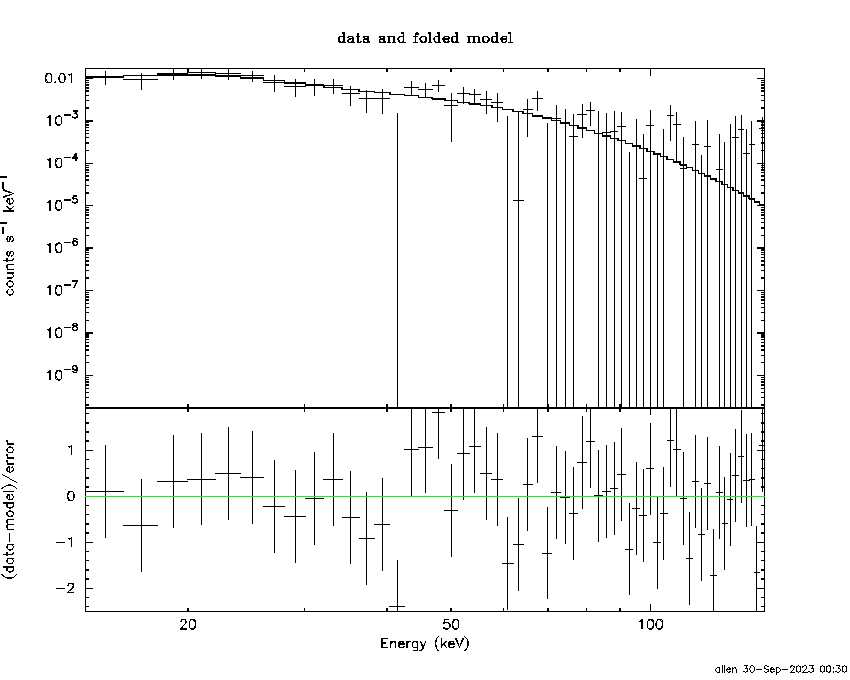
Time averaged spectrum fit using the average DRM
Power-law model
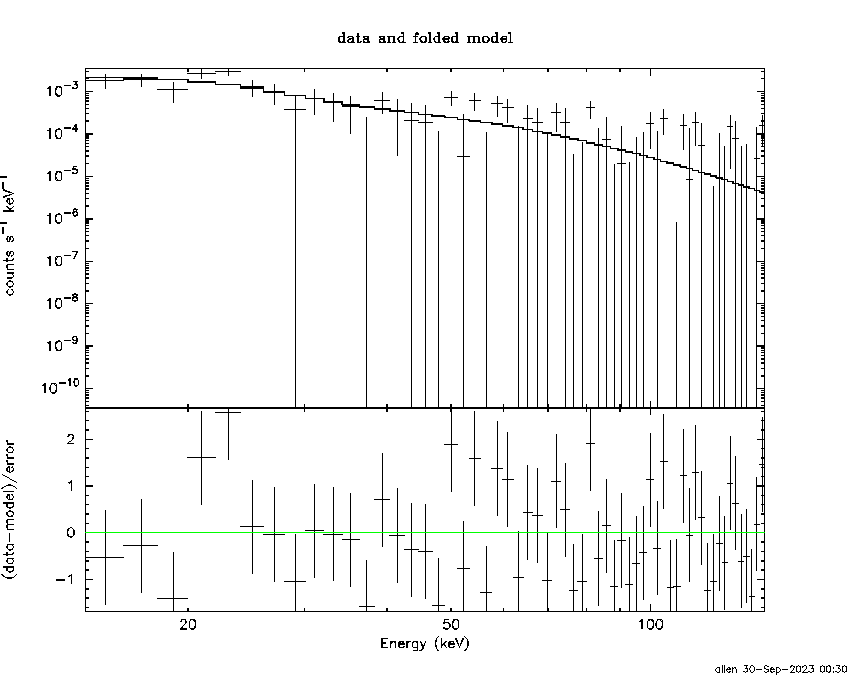
Time interval is from   -0.032 sec. to   24.160 sec.

Spectral model in power-law:
------------------------------------------------------------
Parameters  : value       lower 90%   higher 90%
Photon index: -2.54707     ( -0.458662   0.385614 )
Norm@50keV  : 1.68585E-03    ( -0.000561454   0.000566093 )
------------------------------------------------------------
#Fit statistic  : Chi-Squared                   62.33     using 59 bins.
 Reduced chi-squared = 1.09351
# Null hypothesis probability of 2.92e-01 with 57 degrees of freedom

Photon flux (15-150 keV)    in 24.19 sec: 0.341014 ( -0.062321  0.062389 ) ph/cm2/s
Energy fluence (15-150 keV)             : 4.13272e-07 ( -9.75851e-08  1.04664e-07 ) ergs/cm2
Cutoff power-law model
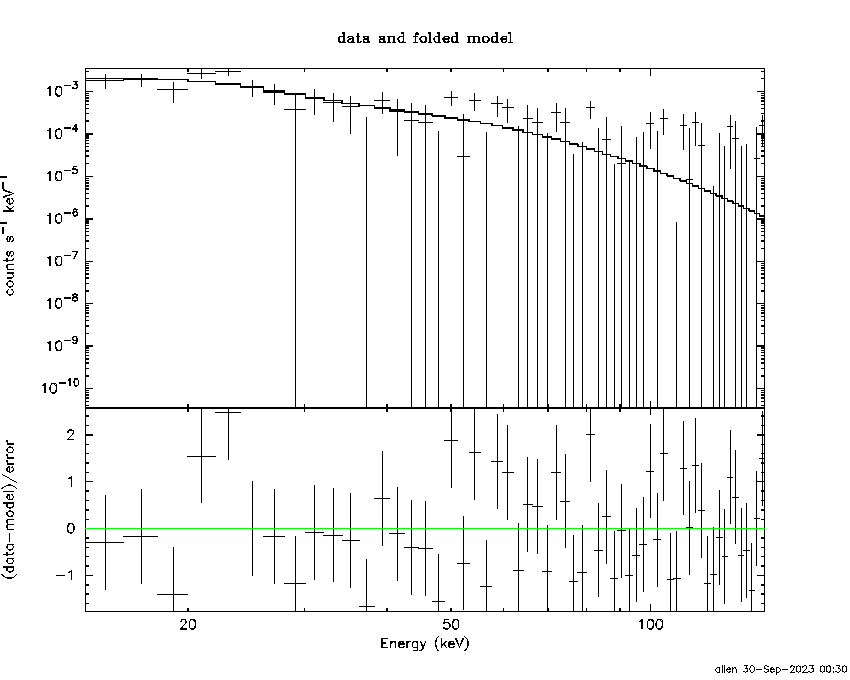
Time interval is from   -0.032 sec. to   24.160 sec.
Spectral model in the cutoff power-law:
------------------------------------------------------------
Parameters  : value       lower 90%   higher 90%
Photon index: -1.9192     (       )
Epeak [keV] : 4.25402      (   )
Norm@50keV  : 4.42107E-03    (     )
------------------------------------------------------------
#Fit statistic  : Chi-Squared                   61.95     using 59 bins.
 Reduced chi-squared = 1.10625
# Null hypothesis probability of 2.72e-01 with 56 degrees of freedom

Photon flux (15-150 keV)    in 24.19 sec: 0.336717 ( -0.062465  0.061851 ) ph/cm2/s
Energy fluence (15-150 keV)             : 3.8608e-07 ( -1.03282e-07  1.11492e-07 ) ergs/cm2
1-s peak spectrum fit
Power-law model
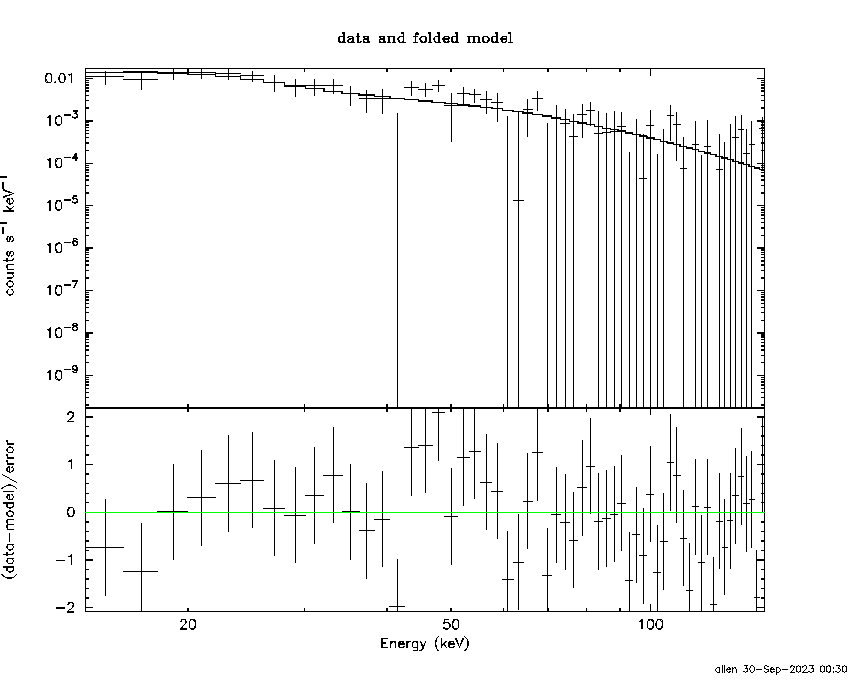
Time interval is from    0.076 sec. to    1.076 sec.

Spectral model in power-law:
------------------------------------------------------------
Parameters  : value       lower 90%   higher 90%
Photon index: -2.12881     ( -0.256458   0.23367 )
Norm@50keV  : 1.74103E-02    ( -0.00326116   0.00317836 )
------------------------------------------------------------
#Fit statistic  : Chi-Squared                   48.25     using 59 bins.
 Reduced chi-squared = 0.846491
# Null hypothesis probability of 7.89e-01 with 57 degrees of freedom

Photon flux (15-150 keV)    in 1 sec: 2.77893 ( -0.38986  0.38987 ) ph/cm2/s
Energy fluence (15-150 keV)             : 1.62271e-07 ( -2.70575e-08  2.76268e-08 ) ergs/cm2
Cutoff power-law model
Time interval is from    0.076 sec. to    1.076 sec.
Spectral model in the cutoff power-law:
------------------------------------------------------------
Parameters  : value       lower 90%   higher 90%
Photon index: -0.665665     ( -1.07231   1.35465 )
Epeak [keV] : 37.4362      ( -9.25337 10.5231 )
Norm@50keV  : 0.126558    ( -0.126562   0.686918 )
------------------------------------------------------------
#Fit statistic  : Chi-Squared                   42.46     using 59 bins.
 Reduced chi-squared = 0.758214
# Null hypothesis probability of 9.09e-01 with 56 degrees of freedom

Photon flux (15-150 keV)    in 1 sec: 2.73345 ( -0.38878  0.38951 ) ph/cm2/s
Energy fluence (15-150 keV)             : 1.50546e-07 ( -2.5888e-08  2.76837e-08 ) ergs/cm2
Time-resolved spectra
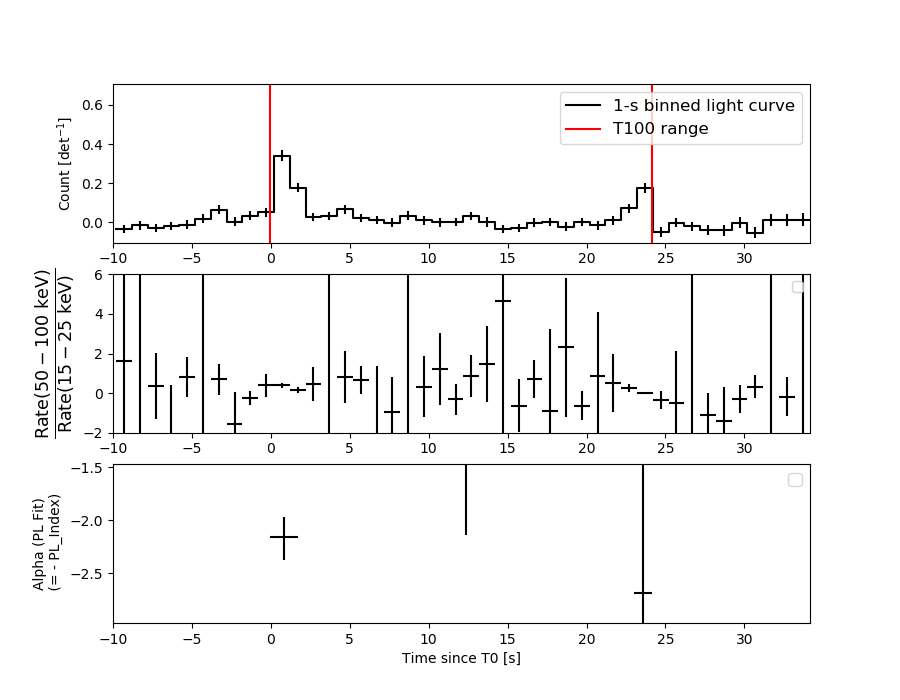
Distribution
T90 vs. Hardness ratio plot
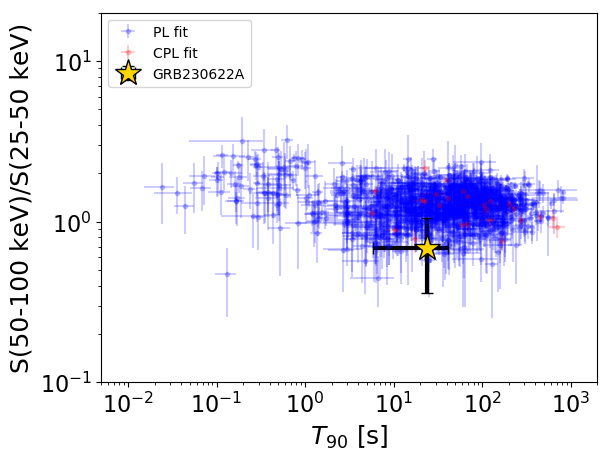
T90                                   = 23.552 sec.
Hardness ratio (energy fluence ratio) = 0.684462975457
S(15-50 keV) vs. S(50-150 keV) plot
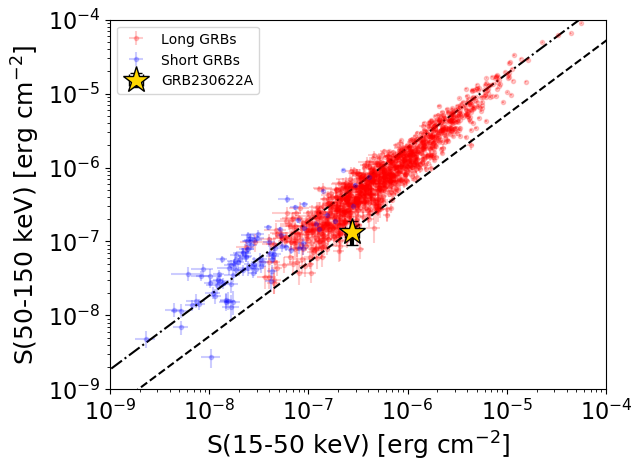
S(15-50 keV)  = 2.783755e-07
S(50-150 keV) = 1.3490337e-07
The dash-dotted line and the dashed line traces the fluences calculated from the Band function with Epeak = 15 and 150 keV, respectively. Both lines assume a canonical values of alpha = -1 and beta = -2.5.
Mask shadow pattern
IMX = 1.389340615369184E-01, IMY = -6.067783706846753E-01
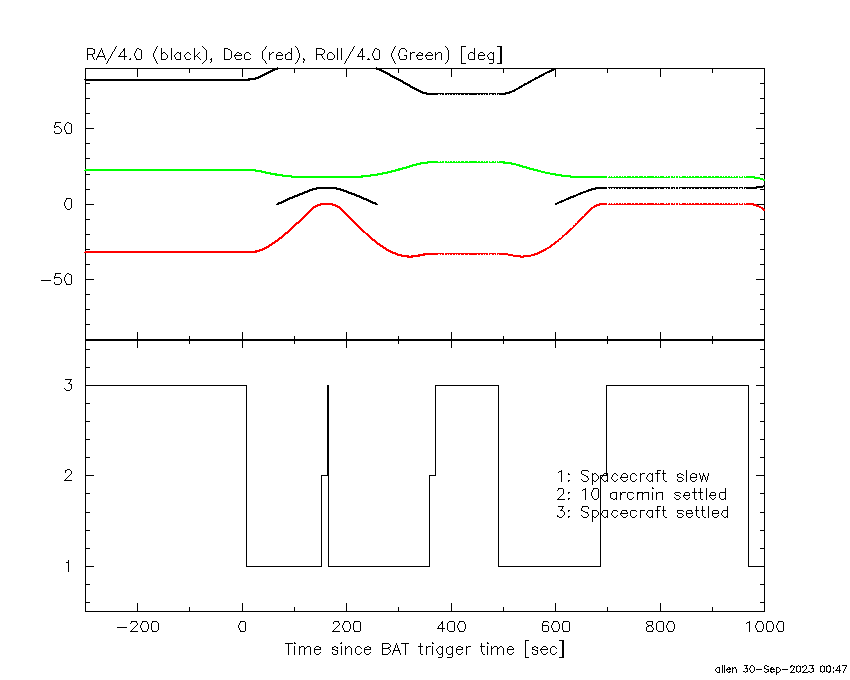
Spacecraft aspect plot
Bright source in the pre-burst/pre-slew/post-slew images
Pre-burst image of 15-350 keV band
Time interval of the image:
-368.800000 -278.688000
-239.800000 -0.032000

# RAcent  DECcent POSerr Theta    Phi  PeakCts   SNR AngSep     Name
#  [deg]    [deg]    ['] [deg]  [deg]                   [']
293.7393 -29.1468    2.4  31.6   84.6   5.0752   4.8 ------	UNKNOWN
330.2348  15.3056    2.7  47.1  179.2   5.9647   4.2 ------	UNKNOWN
333.9901 -10.9167    3.2  21.2 -170.8   1.9743   3.6 ------	UNKNOWN
 33.4781 -77.1283    3.0  53.1  -14.8   4.7478   3.8 ------	UNKNOWN
  2.2548 -52.4314    2.5  30.9  -39.2   3.2475   4.7 ------	UNKNOWN
 25.5539 -41.8737    2.5  44.4  -61.2  12.4095   4.6 ------	UNKNOWN
Pre-slew background subtracted image of 15-350 keV band
Time interval of the image:
-0.032000 9.100600

# RAcent  DECcent POSerr Theta    Phi  PeakCts   SNR AngSep     Name
#  [deg]    [deg]    ['] [deg]  [deg]                   [']
271.2239 -50.3311    2.6  46.9   48.2   0.8513   4.4 ------	UNKNOWN
292.5027 -32.9803    1.1  31.9   77.1   0.7646  10.1 ------	UNKNOWN
285.9251 -46.9139    2.7  37.0   52.3   0.3676   4.3 ------	UNKNOWN
326.9779 -14.8374    2.3  17.3  168.1   0.1844   5.0 ------	UNKNOWN
 16.9938 -56.6907    2.4  40.4  -38.4   0.3097   4.7 ------	UNKNOWN
 31.7771 -59.8135    2.2  48.6  -36.4   0.5277   5.2 ------	UNKNOWN
 20.4592 -33.2625    2.2  41.8  -74.5   0.7807   5.3 ------	UNKNOWN
Post-slew image of 15-350 keV band
Time interval of the image:
151.900620 165.500590

# RAcent  DECcent POSerr Theta    Phi  PeakCts   SNR AngSep     Name
#  [deg]    [deg]    ['] [deg]  [deg]                   [']
 84.4882 -13.7185    2.5  43.0  -50.9   0.5631   4.6 ------	UNKNOWN
 81.1664  17.7423    2.2  41.2  -98.8   1.0130   5.3 ------	UNKNOWN