Analysis Summary
Notes:
- 1) No attempt has been made to eliminate the non-significant decimal places.
- 2) This batgrbproduct analysis is done using the HEASARC data.
- 3) This batgrbproduct analysis is using the flight position for the mask-weighting calculation.
======================================================================
                  BAT GRB EVENT DATA PROCESSING REPORT
    Process Script Ver: batgrbproduct v2.48
    Process Start Time: Fri Sep 29 23:39:54 EDT 2023
             Host Name: batproc1
   Current Working Dir: /local/data/bat1/alien/Swift_3rdBATcatalog/event/batevent_reproc/trigger1177054
======================================================================

  Trigger: 01177054      Segment: 000

  BAT Trigger Time: 709684002.24   [s; MET]
      Trigger Stop: 709684004.288   [s; MET]
               UTC: 2023-06-28T22:26:10.691020    [includes UTCF correction]
       Where From?: TDRSS position message

  BAT
    RA: 171.841393571743   Dec: -11.4466429476081  [deg; J2000]

     Catalogged Source?: NO
     Point Source?:      YES
     GRB Indicated?:     YES    [ by BAT flight software ]
     Image S/N Ratio:    7.38
     Image Trigger?:     NO
     Rate S/N Ratio:     11.13552872566  [ if not an image trigger ]
     Image S/N Ratio:    7.38

  Analysis Position:   [ source = BAT ]
    RA: 171.841393571743   Dec: -11.4466429476081  [deg; J2000]

  Refined Position:   [ source = BAT pre-slew burst ]
    RA: 171.851442044153   Dec: -11.4292119988944  [deg; J2000]
        { 11h 27m 24.3s , -11d 25' 45.2" }
         +/- 2.44877836513895 [arcmin] (estimated 90% radius based on SNR)
         +/- 0.957763734067845 [arcmin] (formal 1-sigma fit error)
    SNR: 8.46206323188088

  Angular difference between the analysis and refined position is 1.201258 arcmin

  Partial Coding Fraction: 0.4101562    [ including projection effects ]

  Duration
     T90: 4.72000014781952 +/- 1.07569521885032
        Measured from: -0.328000068664551
                   to: 4.39200007915497     [s; relative to TRIGTIME]
     T50: 2.03200006484985 +/- 1.25844345524082
        Measured from: 0.631999969482422
                   to: 2.66400003433228     [s; relative to TRIGTIME]


  Fluence
     Peak Flux  (peak 1 second)
        Measured from: 0.332000017166138
                   to: 1.33200001716614     [s; relative to TRIGTIME]
     Total Fluence
        Measured from: -0.504000067710876
                   to: 4.80799996852875     [s; relative to TRIGTIME]

             Band 1     Band 2     Band 3     Band 4
              15-25      25-50     50-100    100-350     keV
 Total     0.089705   0.172862   0.166492   0.015965
           0.029860   0.030020   0.025758   0.021641 [error]
 Peak      0.025631   0.033884   0.056454   0.028956
           0.013735   0.013602   0.011911   0.010060 [error]

     [ fluence units of on-axis counts / fully illuminated detector ]

======================================================================


====== Table of the duration information =============================

        Value   tstart    tstop
T100    5.312   -0.504    4.808
T90     4.720   -0.328    4.392
T50     2.032    0.632    2.664
Peak    1.000    0.332    1.332


====== Spectral Analysis Summary =====================================

Model      : spectral model: simple power-law (PL) and cutoff power-law (CPL)
Ph_index   : photon index: E^{Ph_index}
Ph_90err   : 90% error of the photon index
Epeak      : Epeak in keV
Epeak_90err: 90% error of Epeak
Norm       : normalization at 50 keV in both the PL model and CPL model
Nomr_90err : 90% error of the normalization
chi2       : Chi-Squared
dof        : degree of freedo

=== Time-averaged spectral analysis ===
(Best model with acceptable fit: PL)

Model Ph_index Ph_90err_low Ph_90err_hi  Epeak  Epeak_90err_low  Epeak_90err_hi  Norm       Nomr_90err_low    Norm_90err_hi    chi2    dof
PL      -1.446    -0.296      0.299       -           -               -         6.47e-03     -1.13e-03          1.13e-03      60.880   57
CPL     -0.661    -1.000      1.682       93.769     -37.424       -93.769      1.50e-02     -9.31e-03          6.59e-02      59.770   56


=== 1-s peak spectral analysis ===
(Best model with acceptable fit: PL)

Model Ph_index Ph_90err_low Ph_90err_hi  Epeak  Epeak_90err_low  Epeak_90err_hi  Norm       Nomr_90err_low    Norm_90err_hi    chi2    dof
PL      -0.987     -0.498     0.585       -           -               -         9.67e-03     -3.03e-03          2.81e-03      42.730   57
CPL     -0.912      0.912     2.685      908.310    -908.310      -908.310      1.04e-02     -3.70e-03          -1.04e-02      42.770   56


=== Fluence/Peak Flux Summary ===

              Model    Band1     Band2     Band3     Band4     Band5     Total
                       15-25     25-50    50-100    100-350    15-150    15-350    keV
Fluence         PL   4.17e-08  7.93e-08  1.16e-07  3.66e-07  3.29e-07  6.03e-07   erg/cm2
      90%_error_low -1.27e-08 -1.57e-08 -2.43e-08 -1.41e-07 -6.02e-08 -1.62e-07   erg/cm2
      90%_error_hi   1.40e-08  1.54e-08  2.38e-08  1.89e-07  6.05e-08  1.99e-07   erg/cm2
Peak flux       PL   2.44e-01  3.34e-01  3.37e-01  6.16e-01  1.11e+00  1.53e+00   ph/cm2/s
      90%_error_low -1.42e-01 -1.39e-01 -8.93e-02 -3.02e-01 -3.38e-01 -4.05e-01   ph/cm2/s
      90%_error_hi   1.88e-01  1.36e-01  8.88e-02  4.75e-01  3.49e-01  4.16e-01   ph/cm2/s

Fluence        CPL   3.50e-08  8.40e-08  1.26e-07  1.53e-07  3.18e-07  3.98e-07   erg/cm2
      90%_error_low -1.62e-08 -1.78e-08 -2.85e-08 -1.08e-07 -6.35e-08 -1.27e-07   erg/cm2
      90%_error_hi   1.75e-08  1.86e-08  3.00e-08  1.39e-07  6.35e-08  2.79e-07   erg/cm2
Peak flux      CPL   2.44e-01  3.34e-01  3.37e-01  6.12e-01  1.11e+00  1.57e+00   ph/cm2/s
      90%_error_low -1.42e-01 -1.43e-01 -8.95e-02 -1.60e-01 -3.38e-01 -1.57e+00   ph/cm2/s
      90%_error_hi   1.88e-01  1.38e-01  8.81e-02  4.70e-01  3.49e-01  3.82e-01   ph/cm2/s

======================================================================
Image
Pre-slew 15.0-350.0 keV image (Event data)
#   RAcent    DECcent   POSerr    Theta     Phi              Peak Cts       SNR   Name
  171.8514   -11.4292   0.0227    46.2422    -6.9428         0.5040978      8.462 TRIG_01177054

Foreground time interval of the image:
 -0.504   4.808 (delta_t =   5.312 [sec])
Background time interval of the image:
-239.240  -0.504 (delta_t = 238.736 [sec])
Light Curves
Note: The mask-weighted lightcurves have units of either count/det or counts/sec/det, where a det is 0.4 x 0.4 = 0.16 sq cm.
Full-time range; 1 s binning
Other quick-look light curves:
- 64 ms binning (zoomed)
- 16 ms binning (zoomed)
- 8 ms binning (zoomed)
- 2 ms binning (zoomed)
- SN=5 or 10 s binning (full-time range)
- Raw light curve
Spectra
- 64 ms binning (zoomed)
- 16 ms binning (zoomed)
- 8 ms binning (zoomed)
- 2 ms binning (zoomed)
- SN=5 or 10 s binning (full-time range)
- Raw light curve
Spectra
Notes:
- 1) The fitting includes the systematic errors.
- 2) When the burst includes telescope slew time periods, the fitting uses an average response file made from multiple 5-s response files through out the slew time plus single time preiod for the non-slew times, and weighted by the total counts in the corresponding time period using addrmf. An average response file is needed becuase a spectral fit using the pre-slew DRM will introduce some errors in both a spectral shape and a normalization if the PHA file contains a lot of the slew/post-slew time interval.
- 3) For fits to more complicated models (e.g. a power-law over a cutoff power-law), the BAT team has decided to require a chi-square improvement of more than 6 for each extra dof.
Time averaged spectrum fit using the average DRM
Power-law model
Time interval is from   -0.504 sec. to    4.808 sec.

Spectral model in power-law:
------------------------------------------------------------
Parameters  : value       lower 90%   higher 90%
Photon index: -1.44601     ( -0.29592   0.298578 )
Norm@50keV  : 6.47195E-03    ( -0.00112655   0.00112635 )
------------------------------------------------------------
#Fit statistic  : Chi-Squared                   60.88     using 59 bins.
 Reduced chi-squared = 1.06807
# Null hypothesis probability of 3.38e-01 with 57 degrees of freedom

Photon flux (15-150 keV)    in 5.312 sec: 0.796807 ( -0.148234  0.149496 ) ph/cm2/s
Energy fluence (15-150 keV)             : 3.29267e-07 ( -6.02014e-08  6.05026e-08 ) ergs/cm2
Cutoff power-law model
Time interval is from   -0.504 sec. to    4.808 sec.
Spectral model in the cutoff power-law:
------------------------------------------------------------
Parameters  : value       lower 90%   higher 90%
Photon index: -0.661499     ( -1.00074   1.68171 )
Epeak [keV] : 93.7694      ( -37.3984 -93.744 )
Norm@50keV  : 1.49569E-02    ( -0.00932545   0.0659143 )
------------------------------------------------------------
#Fit statistic  : Chi-Squared                   59.77     using 59 bins.
 Reduced chi-squared = 1.06732
# Null hypothesis probability of 3.40e-01 with 56 degrees of freedom

Photon flux (15-150 keV)    in 5.312 sec: 0.766862 ( -0.157489  0.157407 ) ph/cm2/s
Energy fluence (15-150 keV)             : 3.18228e-07 ( -6.354e-08  6.34513e-08 ) ergs/cm2
1-s peak spectrum fit
Power-law model
Time interval is from    0.332 sec. to    1.332 sec.

Spectral model in power-law:
------------------------------------------------------------
Parameters  : value       lower 90%   higher 90%
Photon index: -0.987246     ( -0.498225   0.584695 )
Norm@50keV  : 9.66727E-03    ( -0.00303335   0.00281126 )
------------------------------------------------------------
#Fit statistic  : Chi-Squared                   42.73     using 59 bins.
 Reduced chi-squared = 0.749649
# Null hypothesis probability of 9.20e-01 with 57 degrees of freedom

Photon flux (15-150 keV)    in 1 sec: 1.11227 ( -0.338016  0.34935 ) ph/cm2/s
Energy fluence (15-150 keV)             : 1.05024e-07 ( -2.78324e-08  2.78745e-08 ) ergs/cm2
Cutoff power-law model

Time interval is from    0.332 sec. to    1.332 sec.
Spectral model in the cutoff power-law:
------------------------------------------------------------
Parameters  : value       lower 90%   higher 90%
Photon index: -0.980778     ( 0.914471   2.68747 )
Epeak [keV] : 1.00000E+04      ( -10000 -10000 )
Norm@50keV  : 9.72449E-03    ( -0.00304188   -0.00972494 )
------------------------------------------------------------
#Fit statistic  : Chi-Squared                   42.73     using 59 bins.
 Reduced chi-squared = 0.763036
# Null hypothesis probability of 9.04e-01 with 56 degrees of freedom

Photon flux (15-150 keV)    in 1 sec: 1.11198 ( -0.3376  0.3494 ) ph/cm2/s
Energy fluence (15-150 keV)             : 1.05264e-07 ( -2.89911e-08  2.84694e-08 ) ergs/cm2
Time-resolved spectra
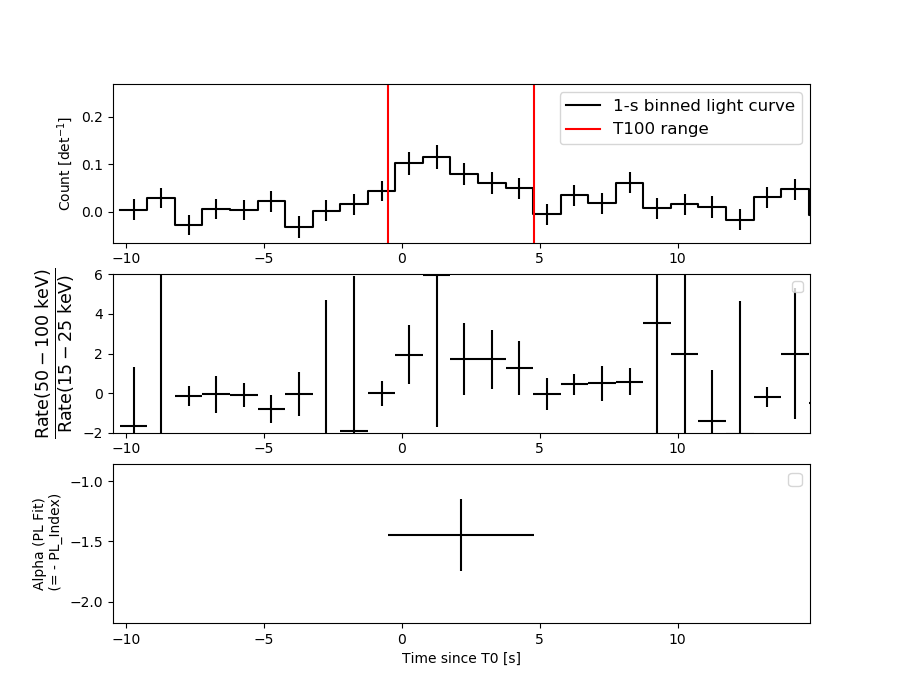
Distribution
T90 vs. Hardness ratio plot
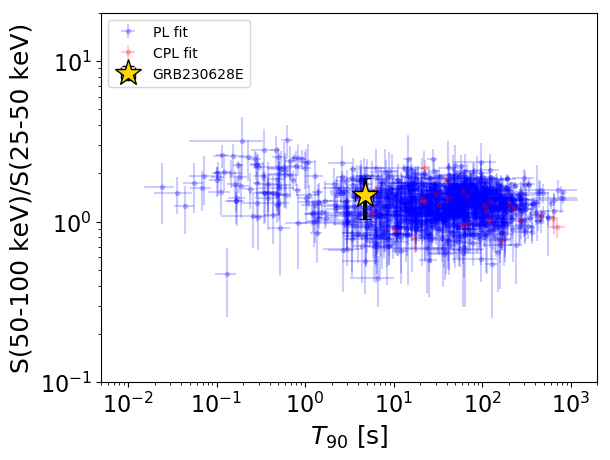
T90                                   = 4.72 sec.
Hardness ratio (energy fluence ratio) = 1.46818175166
S(15-50 keV) vs. S(50-150 keV) plot
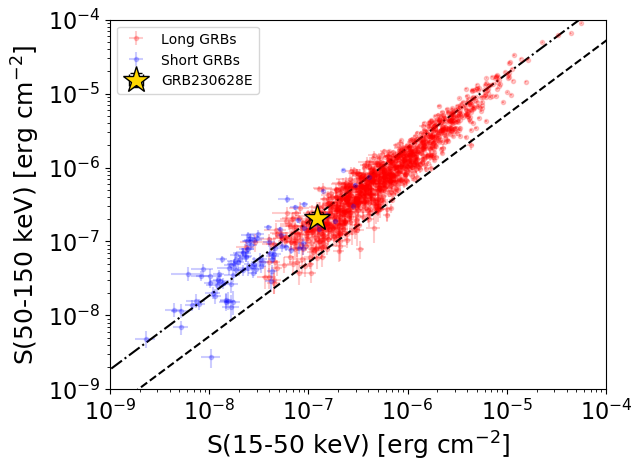
S(15-50 keV)  = 1.2099177e-07
S(50-150 keV) = 2.0827552e-07
The dash-dotted line and the dashed line traces the fluences calculated from the Band function with Epeak = 15 and 150 keV, respectively. Both lines assume a canonical values of alpha = -1 and beta = -2.5.
Mask shadow pattern
IMX = 1.036670064867644E+00, IMY = 1.262367500860944E-01
Spacecraft aspect plot
Bright source in the pre-burst/pre-slew/post-slew images
Pre-burst image of 15-350 keV band
Time interval of the image:
-239.240000 -0.504000

# RAcent  DECcent POSerr Theta    Phi  PeakCts   SNR AngSep     Name
#  [deg]    [deg]    ['] [deg]  [deg]                   [']
135.5421 -40.5605    1.8  13.7  -77.5   2.7269   6.4    0.7	Vela X-1
170.1455 -60.7441   11.2  15.8   87.1  -0.4957  -1.0    8.8	Cen X-3
186.6551 -62.7805    0.7  23.9   87.5   9.4108  16.0    0.6	GX 301-2
202.0346 -57.2014    3.4  32.0   77.2   2.9582   3.5 ------	UNKNOWN
127.7390 -41.6860    3.4  16.0  -99.0   1.3881   3.4 ------	UNKNOWN
133.4035  -9.1287    2.8  44.4  -61.2   9.2974   4.2 ------	UNKNOWN
131.5088 -10.1431    4.6  43.8  -64.1   5.5151   2.5 ------	UNKNOWN
Pre-slew background subtracted image of 15-350 keV band
Time interval of the image:
-0.504000 4.808000

# RAcent  DECcent POSerr Theta    Phi  PeakCts   SNR AngSep     Name
#  [deg]    [deg]    ['] [deg]  [deg]                   [']
135.3595 -40.5236   28.2  13.8  -77.9  -0.0124  -0.4    7.9	Vela X-1
170.4821 -60.8149    0.0  16.0   87.1  -0.0695  -2.0   12.5	Cen X-3
187.0234 -62.6577    0.0  24.0   87.2   0.0526   1.3   12.1	GX 301-2
171.8515 -11.4292    1.4  46.2   -6.9   0.5041   8.5 ------	UNKNOWN
 72.7258 -48.6002    2.2  44.3 -159.7   0.2813   5.2 ------	UNKNOWN
Post-slew image of 15-350 keV band
Time interval of the image:
138.060600 151.460600

# RAcent  DECcent POSerr Theta    Phi  PeakCts   SNR AngSep     Name
#  [deg]    [deg]    ['] [deg]  [deg]                   [']
135.4956 -40.3477    0.0  53.9 -161.4  -0.4995  -3.3   12.5	Vela X-1
183.3917 -10.1798    2.1  14.5  122.1   0.2641   5.5 ------	UNKNOWN
148.7759 -26.2210    2.5  36.2 -157.2   0.3010   4.6 ------	UNKNOWN
127.5304 -18.1262    2.1  49.3 -132.2   1.1940   5.6 ------	UNKNOWN