Analysis Summary
Notes:
- 1) No attempt has been made to eliminate the non-significant decimal places.
- 2) This batgrbproduct analysis is done using the HEASARC data.
- 3) This batgrbproduct analysis is using the flight position for the mask-weighting calculation.
======================================================================
                  BAT GRB EVENT DATA PROCESSING REPORT
    Process Script Ver: batgrbproduct v2.48
    Process Start Time: Fri Oct  6 18:53:26 EDT 2023
             Host Name: batproc1
   Current Working Dir: /local/data/bat1/alien/Swift_3rdBATcatalog/event/batevent_reproc/trigger1180410
======================================================================

  Trigger: 01180410      Segment: 000

  BAT Trigger Time: 711805384.576   [s; MET]
      Trigger Stop: 711805385.088   [s; MET]
               UTC: 2023-07-23T11:42:32.881800    [includes UTCF correction]
       Where From?: TDRSS position message

  BAT
    RA: 250.378850607907   Dec: -5.3272728850738  [deg; J2000]

     Catalogged Source?: NO
     Point Source?:      YES
     GRB Indicated?:     YES    [ by BAT flight software ]
     Image S/N Ratio:    8.27
     Image Trigger?:     NO
     Rate S/N Ratio:     14.247806848775  [ if not an image trigger ]
     Image S/N Ratio:    8.27

  Analysis Position:   [ source = BAT ]
    RA: 250.378850607907   Dec: -5.3272728850738  [deg; J2000]

  Refined Position:   [ source = BAT pre-slew burst ]
    RA: 250.390286464428   Dec: -5.31940688710297  [deg; J2000]
        { 16h 41m 33.7s , -05d 19' 09.9" }
         +/- 1.00654104356603 [arcmin] (estimated 90% radius based on SNR)
         +/- 0.371707017118001 [arcmin] (formal 1-sigma fit error)
    SNR: 30.135152673139

  Angular difference between the analysis and refined position is 0.830360 arcmin

  Partial Coding Fraction: 0.3984375    [ including projection effects ]

  Duration
     T90: 5.75599992275238 +/- 0.85248116255725
        Measured from: 0.116000056266785
                   to: 5.87199997901917     [s; relative to TRIGTIME]
     T50: 2.67199993133545 +/- 0.354039587178118
        Measured from: 1.24000000953674
                   to: 3.91199994087219     [s; relative to TRIGTIME]


  Fluence
     Peak Flux  (peak 1 second)
        Measured from: 1.6360000371933
                   to: 2.6360000371933     [s; relative to TRIGTIME]
     Total Fluence
        Measured from: -0.215999960899353
                   to: 7.93599998950958     [s; relative to TRIGTIME]

             Band 1     Band 2     Band 3     Band 4
              15-25      25-50     50-100    100-350     keV
 Total     0.728244   1.108567   0.708448   0.146779
           0.050948   0.048669   0.039867   0.028660 [error]
 Peak      0.142584   0.276029   0.153727   0.033304
           0.019304   0.020048   0.016134   0.010812 [error]

     [ fluence units of on-axis counts / fully illuminated detector ]

======================================================================


====== Table of the duration information =============================

        Value   tstart    tstop
T100    8.152   -0.216    7.936
T90     5.756    0.116    5.872
T50     2.672    1.240    3.912
Peak    1.000    1.636    2.636


====== Spectral Analysis Summary =====================================

Model      : spectral model: simple power-law (PL) and cutoff power-law (CPL)
Ph_index   : photon index: E^{Ph_index}
Ph_90err   : 90% error of the photon index
Epeak      : Epeak in keV
Epeak_90err: 90% error of Epeak
Norm       : normalization at 50 keV in both the PL model and CPL model
Nomr_90err : 90% error of the normalization
chi2       : Chi-Squared
dof        : degree of freedo

=== Time-averaged spectral analysis ===
(Best model with acceptable fit: CPL)

Model Ph_index Ph_90err_low Ph_90err_hi  Epeak  Epeak_90err_low  Epeak_90err_hi  Norm       Nomr_90err_low    Norm_90err_hi    chi2    dof
PL      -1.807    -0.093      0.091       -           -               -         2.28e-02     -1.26e-03          1.25e-03      58.290   57
CPL     -1.062    -0.408      0.447       63.907      -8.721        19.261      5.34e-02     -1.96e-02          3.49e-02      47.980   56


=== 1-s peak spectral analysis ===
(Best model with acceptable fit: CPL)

Model Ph_index Ph_90err_low Ph_90err_hi  Epeak  Epeak_90err_low  Epeak_90err_hi  Norm       Nomr_90err_low    Norm_90err_hi    chi2    dof
PL      -1.861     -0.149     0.144       -           -               -         3.88e-02     -3.88e-03          3.86e-03      68.540   57
CPL     -0.227     -0.782     0.983       53.771      -6.673         9.895      2.66e-01     -1.59e-01          5.94e-01      53.320   56


=== Fluence/Peak Flux Summary ===

              Model    Band1     Band2     Band3     Band4     Band5     Total
                       15-25     25-50    50-100    100-350    15-150    15-350    keV
Fluence         PL   3.17e-07  4.83e-07  5.52e-07  1.21e-06  1.71e-06  2.56e-06   erg/cm2
      90%_error_low -2.81e-08 -2.70e-08 -3.90e-08 -1.70e-07 -9.54e-08 -2.05e-07   erg/cm2
      90%_error_hi   2.90e-08  2.70e-08  3.89e-08  1.86e-07  9.57e-08  2.16e-07   erg/cm2
Peak flux       PL   2.26e+00  1.84e+00  1.01e+00  8.19e-01  5.48e+00  5.94e+00   ph/cm2/s
      90%_error_low -3.22e-01 -1.81e-01 -1.24e-01 -1.76e-01 -5.43e-01 -5.64e-01   ph/cm2/s
      90%_error_hi   3.35e-01  1.80e-01  1.23e-01  1.98e-01  5.44e-01  5.65e-01   ph/cm2/s

Fluence        CPL   2.76e-07  5.16e-07  5.81e-07  4.98e-07  1.64e-06  1.87e-06   erg/cm2
      90%_error_low -3.46e-08 -3.29e-08 -4.43e-08 -1.74e-07 -1.03e-07 -2.01e-07   erg/cm2
      90%_error_hi   3.54e-08  3.35e-08  4.49e-08  2.86e-07  1.03e-07  2.94e-07   erg/cm2
Peak flux      CPL   1.71e+00  2.15e+00  1.17e+00  2.41e-01  5.23e+00  5.27e+00   ph/cm2/s
      90%_error_low -3.81e-01 -2.38e-01 -1.59e-01 -1.24e-01 -5.52e-01 -5.70e-01   ph/cm2/s
      90%_error_hi   4.01e-01  2.48e-01  1.60e-01  1.88e-01  5.55e-01  5.79e-01   ph/cm2/s

======================================================================
Image
Pre-slew 15.0-350.0 keV image (Event data)
#   RAcent    DECcent   POSerr    Theta     Phi              Peak Cts       SNR   Name
  250.3903    -5.3194   0.0064    44.6764   -21.3511         2.8187548     30.135 TRIG_01180410

Foreground time interval of the image:
 -0.216   7.936 (delta_t =   8.152 [sec])
Background time interval of the image:
-239.576  -0.216 (delta_t = 239.360 [sec])
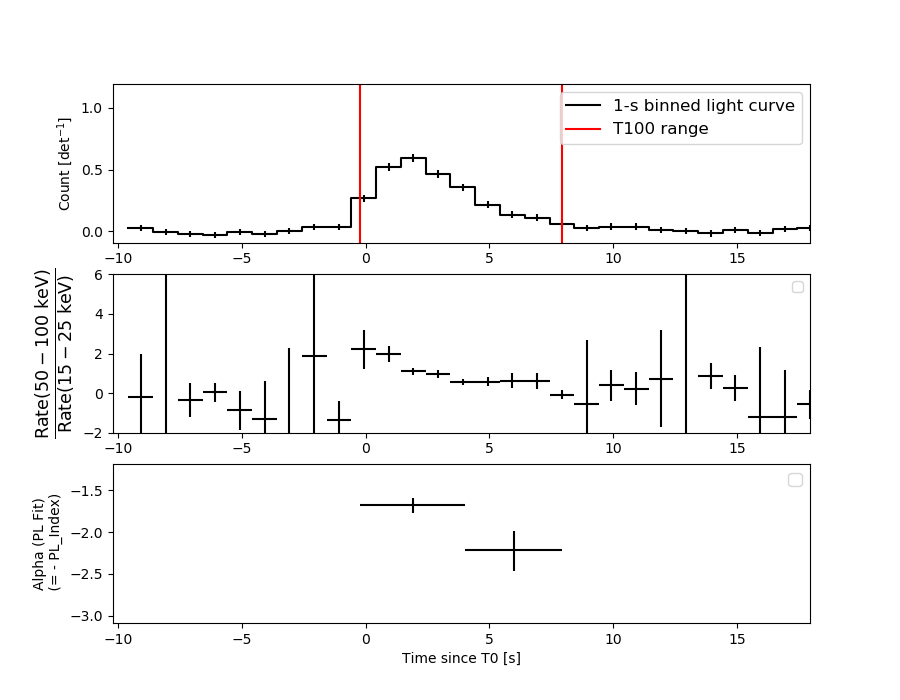
Light Curves
Note: The mask-weighted lightcurves have units of either count/det or counts/sec/det, where a det is 0.4 x 0.4 = 0.16 sq cm.
Full-time range; 1 s binning
Other quick-look light curves:
- 64 ms binning (zoomed)
- 16 ms binning (zoomed)
- 8 ms binning (zoomed)
- 2 ms binning (zoomed)
- SN=5 or 10 s binning (full-time range)
- Raw light curve
Spectra
- 64 ms binning (zoomed)
- 16 ms binning (zoomed)
- 8 ms binning (zoomed)
- 2 ms binning (zoomed)
- SN=5 or 10 s binning (full-time range)
- Raw light curve
Spectra
Notes:
- 1) The fitting includes the systematic errors.
- 2) When the burst includes telescope slew time periods, the fitting uses an average response file made from multiple 5-s response files through out the slew time plus single time preiod for the non-slew times, and weighted by the total counts in the corresponding time period using addrmf. An average response file is needed becuase a spectral fit using the pre-slew DRM will introduce some errors in both a spectral shape and a normalization if the PHA file contains a lot of the slew/post-slew time interval.
- 3) For fits to more complicated models (e.g. a power-law over a cutoff power-law), the BAT team has decided to require a chi-square improvement of more than 6 for each extra dof.
Time averaged spectrum fit using the average DRM
Power-law model
Time interval is from   -0.216 sec. to    7.936 sec.

Spectral model in power-law:
------------------------------------------------------------
Parameters  : value       lower 90%   higher 90%
Photon index: -1.80652     ( -0.0926036   0.091441 )
Norm@50keV  : 2.27983E-02    ( -0.0012568   0.00125303 )
------------------------------------------------------------
#Fit statistic  : Chi-Squared                   58.29     using 59 bins.
 Reduced chi-squared = 1.02263
# Null hypothesis probability of 4.28e-01 with 57 degrees of freedom

Photon flux (15-150 keV)    in 8.152 sec: 3.14970 ( -0.18106  0.18168 ) ph/cm2/s
Energy fluence (15-150 keV)             : 1.71086e-06 ( -9.54452e-08  9.56654e-08 ) ergs/cm2
Cutoff power-law model
Time interval is from   -0.216 sec. to    7.936 sec.
Spectral model in the cutoff power-law:
------------------------------------------------------------
Parameters  : value       lower 90%   higher 90%
Photon index: -1.06206     ( -0.408281   0.447159 )
Epeak [keV] : 63.9075      ( -8.72115 19.2608 )
Norm@50keV  : 5.34469E-02    ( -0.0196012   0.0349084 )
------------------------------------------------------------
#Fit statistic  : Chi-Squared                   47.98     using 59 bins.
 Reduced chi-squared = 0.856786
# Null hypothesis probability of 7.68e-01 with 56 degrees of freedom

Photon flux (15-150 keV)    in 8.152 sec: 3.02626 ( -0.19139  0.19221 ) ph/cm2/s
Energy fluence (15-150 keV)             : 1.64329e-06 ( -1.02956e-07  1.02952e-07 ) ergs/cm2
1-s peak spectrum fit
Power-law model
Time interval is from    1.636 sec. to    2.636 sec.

Spectral model in power-law:
------------------------------------------------------------
Parameters  : value       lower 90%   higher 90%
Photon index: -1.86106     ( -0.149026   0.143873 )
Norm@50keV  : 3.88250E-02    ( -0.00388363   0.00385805 )
------------------------------------------------------------
#Fit statistic  : Chi-Squared                   68.54     using 59 bins.
 Reduced chi-squared = 1.20246
# Null hypothesis probability of 1.41e-01 with 57 degrees of freedom

Photon flux (15-150 keV)    in 1 sec: 5.48232 ( -0.54253  0.54395 ) ph/cm2/s
Energy fluence (15-150 keV)             : 3.57001e-07 ( -3.56645e-08  3.57524e-08 ) ergs/cm2
Cutoff power-law model
Time interval is from    1.636 sec. to    2.636 sec.
Spectral model in the cutoff power-law:
------------------------------------------------------------
Parameters  : value       lower 90%   higher 90%
Photon index: -0.226801     ( -0.781635   0.982822 )
Epeak [keV] : 53.7711      ( -6.67283 9.8958 )
Norm@50keV  : 0.265552    ( -0.15865   0.593599 )
------------------------------------------------------------
#Fit statistic  : Chi-Squared                   53.32     using 59 bins.
 Reduced chi-squared = 0.952143
# Null hypothesis probability of 5.77e-01 with 56 degrees of freedom

Photon flux (15-150 keV)    in 1 sec: 5.22752 ( -0.55235  0.55465 ) ph/cm2/s
Energy fluence (15-150 keV)             : 3.40706e-07 ( -3.76869e-08  3.77366e-08 ) ergs/cm2
Time-resolved spectra
Distribution
T90 vs. Hardness ratio plot
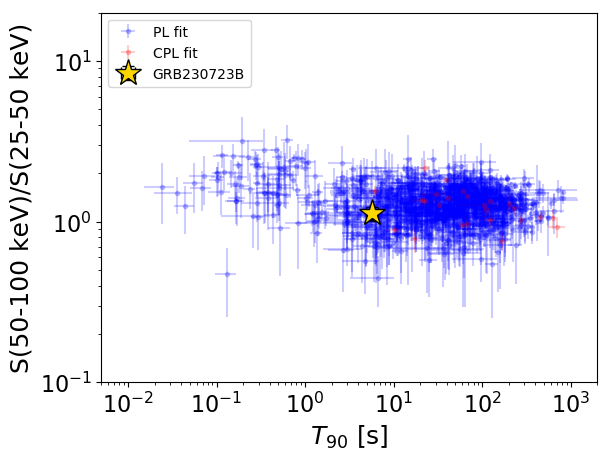
T90                                   = 5.756 sec.
Hardness ratio (energy fluence ratio) = 1.1250193618
S(15-50 keV) vs. S(50-150 keV) plot
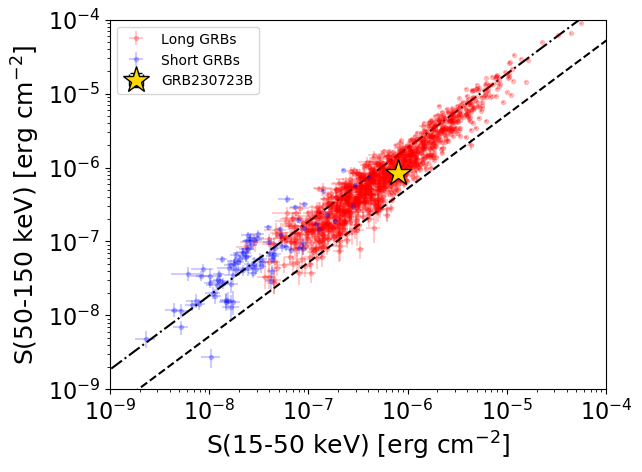
S(15-50 keV)  = 7.925031e-07
S(50-150 keV) = 8.507778e-07
The dash-dotted line and the dashed line traces the fluences calculated from the Band function with Epeak = 15 and 150 keV, respectively. Both lines assume a canonical values of alpha = -1 and beta = -2.5.
Mask shadow pattern
IMX = 9.209038686364036E-01, IMY = 3.599928070229617E-01
Spacecraft aspect plot
Bright source in the pre-burst/pre-slew/post-slew images
Pre-burst image of 15-350 keV band
Time interval of the image:
-239.576000 -0.216000

# RAcent  DECcent POSerr Theta    Phi  PeakCts   SNR AngSep     Name
#  [deg]    [deg]    ['] [deg]  [deg]                   [']
244.9875 -15.6341    0.4  40.9  -37.5  24.9596  26.5    0.6	Sco X-1
255.8390 -38.0189    0.0  22.2  -68.8   0.5193   0.7   12.6	4U 1700-377
256.4505 -36.4652    4.9  21.9  -64.5   1.5163   2.3    2.6	GX 349+2
262.9512 -24.9236   31.5  22.1  -29.8   0.1906   0.4   11.1	GX 1+4
264.7525 -44.5991   10.5  15.9  -90.7   0.6153   1.1    9.0	4U 1735-44
268.4411  -1.4217    9.1  39.2    5.2   0.9006   1.3    4.8	SW J1753.5-0127
270.3075 -25.1094    4.2  17.3  -16.0   1.3913   2.8    2.2	GX 5-1
270.3399 -25.5650    5.6  16.9  -16.9   1.0559   2.1   10.9	GRS 1758-258
274.1034 -13.9614    4.2  25.5    7.5   1.6146   2.7    7.2	GX 17+2
275.7188 -30.3371    8.0  10.2  -14.5   0.7224   1.4   10.8	H1820-303
285.0774 -24.7342  249.0  13.2   34.5  -0.0225  -0.0   11.4	HT1900.1-2455
288.7772  10.7940    0.0  48.9   36.5  -1.5782  -1.1    9.2	GRS 1915+105
262.9437 -33.8518    3.7  17.5  -52.8   1.8095   3.2    2.5	GX 354-0
325.2034 -19.9182    2.7  39.8  105.3   6.6723   4.3 ------	UNKNOWN
307.8410 -13.4907    3.5  32.3   77.6   3.2390   3.3 ------	UNKNOWN
310.3498 -16.3596    2.9  31.6   84.6   3.6718   3.9 ------	UNKNOWN
329.5471 -42.6233    2.5  34.6  142.9   3.8698   4.7 ------	UNKNOWN
  1.2526 -58.1947    2.2  52.1  169.7   8.2054   5.2 ------	UNKNOWN
 11.6439 -86.8568    2.6  52.0 -153.6   6.4828   4.4 ------	UNKNOWN
Pre-slew background subtracted image of 15-350 keV band
Time interval of the image:
-0.216000 7.936000

# RAcent  DECcent POSerr Theta    Phi  PeakCts   SNR AngSep     Name
#  [deg]    [deg]    ['] [deg]  [deg]                   [']
245.1089 -15.5841   15.0  40.9  -37.4   0.0699   0.8    8.2	Sco X-1
255.9531 -37.7058    5.5  22.1  -67.9  -0.1197  -2.1    8.4	4U 1700-377
256.2931 -36.6001    0.0  22.0  -64.9   0.0951   1.6   12.6	GX 349+2
263.1955 -24.8121    4.6  22.0  -29.2  -0.1327  -2.5   10.9	GX 1+4
264.8636 -44.5741   24.3  15.8  -90.7   0.0262   0.5    9.1	4U 1735-44
268.4296  -1.3141    4.6  39.3    5.2  -0.2155  -2.5    9.1	SW J1753.5-0127
270.3329 -25.2230   17.2  17.2  -16.2   0.0346   0.7    9.0	GX 5-1
270.2186 -25.9393    0.0  16.7  -18.0   0.1329   2.6   12.6	GRS 1758-258
273.9191 -14.0852   10.4  25.4    7.0  -0.0654  -1.1    5.8	GX 17+2
275.8353 -30.5482    7.0  10.0  -14.8   0.0854   1.7   11.8	H1820-303
284.9948 -24.8501    4.2  13.1   34.2  -0.1407  -2.7    4.8	HT1900.1-2455
288.8259  10.9649   74.5  49.1   36.6  -0.0357  -0.2    2.0	GRS 1915+105
262.7997 -33.8229   19.5  17.6  -52.8   0.0328   0.6    9.5	GX 354-0
347.2320 -50.3460    2.5  45.6  157.5   0.5026   4.6 ------	UNKNOWN
346.6344 -51.7342    2.3  45.0  159.3   0.5467   5.0 ------	UNKNOWN
250.3903  -5.3194    0.4  44.7  -21.4   2.8185  30.1 ------	UNKNOWN
Post-slew image of 15-350 keV band
Time interval of the image: