Analysis Summary
Notes:
- 1) No attempt has been made to eliminate the non-significant decimal places.
- 2) This batgrbproduct analysis is done using the HEASARC data.
- 3) This batgrbproduct analysis is using the flight position for the mask-weighting calculation.
======================================================================
                  BAT GRB EVENT DATA PROCESSING REPORT
    Process Script Ver: batgrbproduct v2.48
    Process Start Time: Fri Sep 29 23:35:55 EDT 2023
             Host Name: batproc1
   Current Working Dir: /local/data/bat1/alien/Swift_3rdBATcatalog/event/batevent_reproc/trigger1181187
======================================================================

  Trigger: 01181187      Segment: 000

  BAT Trigger Time: 712205434.944   [s; MET]
      Trigger Stop: 712205435.968   [s; MET]
               UTC: 2023-07-28T02:50:03.222400    [includes UTCF correction]
       Where From?: TDRSS position message

  BAT
    RA: 343.538953466444   Dec: 28.1508318660294  [deg; J2000]

     Catalogged Source?: NO
     Point Source?:      YES
     GRB Indicated?:     YES    [ by BAT flight software ]
     Image S/N Ratio:    9.66
     Image Trigger?:     NO
     Rate S/N Ratio:     15.556349186104  [ if not an image trigger ]
     Image S/N Ratio:    9.66

  Analysis Position:   [ source = BAT ]
    RA: 343.538953466444   Dec: 28.1508318660294  [deg; J2000]

  Refined Position:   [ source = BAT pre-slew burst ]
    RA: 343.514139413016   Dec: 28.1695139122038  [deg; J2000]
        { 22h 54m 03.4s , +28d 10' 10.3" }
         +/- 1.30088819788565 [arcmin] (estimated 90% radius based on SNR)
         +/- 0.525027114136543 [arcmin] (formal 1-sigma fit error)
    SNR: 20.8890369280975

  Angular difference between the analysis and refined position is 1.726099 arcmin

  Partial Coding Fraction: 0.4960938    [ including projection effects ]

  Duration
     T90: 14.7599999904633 +/- 0.892307208733889
        Measured from: -4.85199999809265
                   to: 9.90799999237061     [s; relative to TRIGTIME]
     T50: 5.54799997806549 +/- 3.44707409608694
        Measured from: 0.363999962806702
                   to: 5.91199994087219     [s; relative to TRIGTIME]


  Fluence
     Peak Flux  (peak 1 second)
        Measured from: 0.407999992370605
                   to: 1.40799999237061     [s; relative to TRIGTIME]
     Total Fluence
        Measured from: -5.62000000476837
                   to: 10.7400000095367     [s; relative to TRIGTIME]

             Band 1     Band 2     Band 3     Band 4
              15-25      25-50     50-100    100-350     keV
 Total     0.547540   0.710483   0.508162   0.076881
           0.045459   0.047884   0.041728   0.036886 [error]
 Peak      0.081328   0.117314   0.094351   0.005505
           0.012280   0.013879   0.011885   0.008954 [error]

     [ fluence units of on-axis counts / fully illuminated detector ]

======================================================================


====== Table of the duration information =============================

        Value   tstart    tstop
T100   16.360   -5.620   10.740
T90    14.760   -4.852    9.908
T50     5.548    0.364    5.912
Peak    1.000    0.408    1.408


====== Spectral Analysis Summary =====================================

Model      : spectral model: simple power-law (PL) and cutoff power-law (CPL)
Ph_index   : photon index: E^{Ph_index}
Ph_90err   : 90% error of the photon index
Epeak      : Epeak in keV
Epeak_90err: 90% error of Epeak
Norm       : normalization at 50 keV in both the PL model and CPL model
Nomr_90err : 90% error of the normalization
chi2       : Chi-Squared
dof        : degree of freedo

=== Time-averaged spectral analysis ===
(Best model with acceptable fit: PL)

Model Ph_index Ph_90err_low Ph_90err_hi  Epeak  Epeak_90err_low  Epeak_90err_hi  Norm       Nomr_90err_low    Norm_90err_hi    chi2    dof
PL      -1.580    -0.133      0.131       -           -               -         7.33e-03     -5.84e-04          5.80e-04      52.730   57
CPL     -1.088    -0.503      0.570       89.325     -25.964      3148.915      1.32e-02     -5.86e-03          1.26e-02      49.940   56


=== 1-s peak spectral analysis ===
(Best model with acceptable fit: PL)

Model Ph_index Ph_90err_low Ph_90err_hi  Epeak  Epeak_90err_low  Epeak_90err_hi  Norm       Nomr_90err_low    Norm_90err_hi    chi2    dof
PL      -1.581     -0.207     0.200       -           -               -         1.92e-02     -2.62e-03          2.59e-03      56.060   57
CPL     -0.295     -0.902     1.123       64.376     -12.813        40.680      8.94e-02     -8.94e-02          2.44e-01      49.730   56


=== Fluence/Peak Flux Summary ===

              Model    Band1     Band2     Band3     Band4     Band5     Total
                       15-25     25-50    50-100    100-350    15-150    15-350    keV
Fluence         PL   1.65e-07  2.89e-07  3.87e-07  1.06e-06  1.13e-06  1.90e-06   erg/cm2
      90%_error_low -2.01e-08 -2.23e-08 -4.06e-08 -2.16e-07 -9.66e-08 -2.54e-07   erg/cm2
      90%_error_hi   2.07e-08  2.23e-08  4.06e-08  2.51e-07  9.76e-08  2.81e-07   erg/cm2
Peak flux       PL   8.52e-01  8.17e-01  5.46e-01  5.70e-01  2.45e+00  2.79e+00   ph/cm2/s
      90%_error_low -1.62e-01 -1.07e-01 -9.31e-02 -1.68e-01 -3.13e-01 -3.63e-01   ph/cm2/s
      90%_error_hi   1.69e-01  1.06e-01  9.26e-02  2.03e-01  3.14e-01  3.66e-01   ph/cm2/s

Fluence        CPL   1.54e-07  3.05e-07  3.95e-07  5.08e-07  1.08e-06  1.36e-06   erg/cm2
      90%_error_low -2.35e-08 -2.77e-08 -4.37e-08 -2.53e-07 -1.07e-07 -2.75e-07   erg/cm2
      90%_error_hi   2.37e-08  2.85e-08  4.42e-08  5.72e-07  1.08e-07  5.70e-07   erg/cm2
Peak flux      CPL   8.26e-01  6.39e-01  3.46e-01  3.21e-01  1.94e+00  2.13e+00   ph/cm2/s
      90%_error_low -2.18e-01 -1.54e-01 -9.11e-02 -7.87e-02 -4.43e-01 -3.56e-01   ph/cm2/s
      90%_error_hi   1.88e-01  1.19e-01  8.29e-02  6.14e-02  3.40e-01  3.14e-01   ph/cm2/s

======================================================================
Image
Pre-slew 15.0-350.0 keV image (Event data)
#   RAcent    DECcent   POSerr    Theta     Phi              Peak Cts       SNR   Name
  343.5141    28.1695   0.0093    25.5432    80.6202         1.9449755     20.889 TRIG_01181187

Foreground time interval of the image:
 -5.620  10.740 (delta_t =  16.360 [sec])
Background time interval of the image:
-188.043  -5.620 (delta_t = 182.423 [sec])
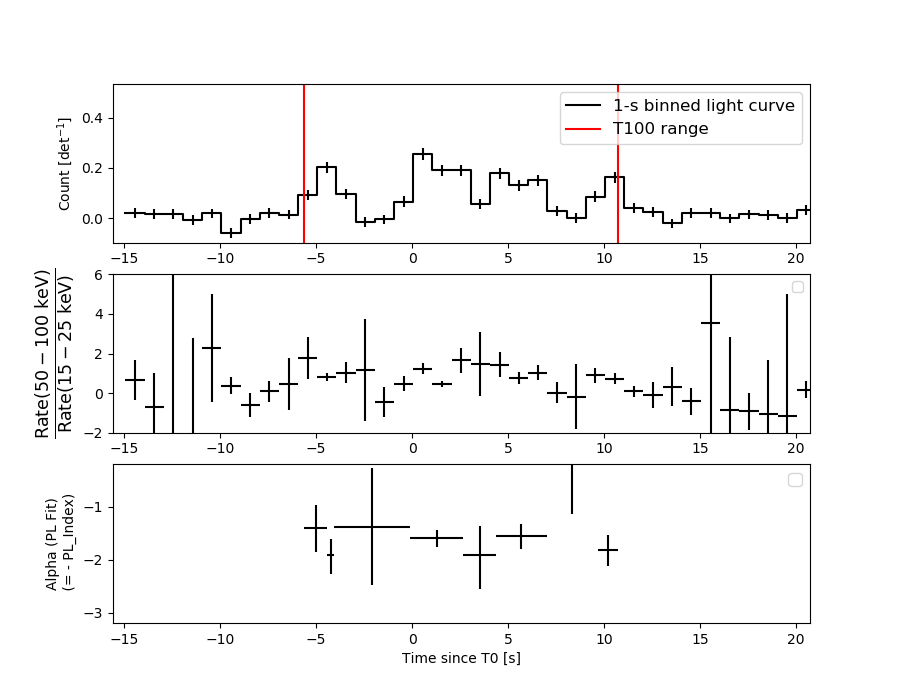
Light Curves
Note: The mask-weighted lightcurves have units of either count/det or counts/sec/det, where a det is 0.4 x 0.4 = 0.16 sq cm.
Full-time range; 1 s binning
Other quick-look light curves:
- 64 ms binning (zoomed)
- 16 ms binning (zoomed)
- 8 ms binning (zoomed)
- 2 ms binning (zoomed)
- SN=5 or 10 s binning (full-time range)
- Raw light curve
Spectra
- 64 ms binning (zoomed)
- 16 ms binning (zoomed)
- 8 ms binning (zoomed)
- 2 ms binning (zoomed)
- SN=5 or 10 s binning (full-time range)
- Raw light curve
Spectra
Notes:
- 1) The fitting includes the systematic errors.
- 2) When the burst includes telescope slew time periods, the fitting uses an average response file made from multiple 5-s response files through out the slew time plus single time preiod for the non-slew times, and weighted by the total counts in the corresponding time period using addrmf. An average response file is needed becuase a spectral fit using the pre-slew DRM will introduce some errors in both a spectral shape and a normalization if the PHA file contains a lot of the slew/post-slew time interval.
- 3) For fits to more complicated models (e.g. a power-law over a cutoff power-law), the BAT team has decided to require a chi-square improvement of more than 6 for each extra dof.
Time averaged spectrum fit using the average DRM
Power-law model
Time interval is from   -5.620 sec. to   10.740 sec.

Spectral model in power-law:
------------------------------------------------------------
Parameters  : value       lower 90%   higher 90%
Photon index: -1.57958     ( -0.132749   0.13113 )
Norm@50keV  : 7.33479E-03    ( -0.000584226   0.000580296 )
------------------------------------------------------------
#Fit statistic  : Chi-Squared                   52.73     using 59 bins.
 Reduced chi-squared = 0.925088
# Null hypothesis probability of 6.36e-01 with 57 degrees of freedom

Photon flux (15-150 keV)    in 16.36 sec: 0.936721 ( -0.071591  0.071649 ) ph/cm2/s
Energy fluence (15-150 keV)             : 1.12526e-06 ( -9.66207e-08  9.7618e-08 ) ergs/cm2
Cutoff power-law model
Time interval is from   -5.620 sec. to   10.740 sec.
Spectral model in the cutoff power-law:
------------------------------------------------------------
Parameters  : value       lower 90%   higher 90%
Photon index: -1.08841     ( -0.502612   0.570281 )
Epeak [keV] : 89.3253      ( -25.9643 3148.92 )
Norm@50keV  : 1.32320E-02    ( -0.0058565   0.0126059 )
------------------------------------------------------------
#Fit statistic  : Chi-Squared                   49.94     using 59 bins.
 Reduced chi-squared = 0.891786
# Null hypothesis probability of 7.02e-01 with 56 degrees of freedom

Photon flux (15-150 keV)    in 16.36 sec: 0.916938 ( -0.07448  0.074421 ) ph/cm2/s
Energy fluence (15-150 keV)             : 1.07995e-06 ( -1.06926e-07  1.07823e-07 ) ergs/cm2
1-s peak spectrum fit
Power-law model
Time interval is from    0.408 sec. to    1.408 sec.

Spectral model in power-law:
------------------------------------------------------------
Parameters  : value       lower 90%   higher 90%
Photon index: -1.58072     ( -0.207181   0.20035 )
Norm@50keV  : 1.91516E-02    ( -0.00261887   0.00258964 )
------------------------------------------------------------
#Fit statistic  : Chi-Squared                   56.06     using 59 bins.
 Reduced chi-squared = 0.983509
# Null hypothesis probability of 5.11e-01 with 57 degrees of freedom

Photon flux (15-150 keV)    in 1 sec: 2.44667 ( -0.3134  0.31354 ) ph/cm2/s
Energy fluence (15-150 keV)             : 1.79568e-07 ( -2.62193e-08  2.65424e-08 ) ergs/cm2
Cutoff power-law model
Time interval is from    0.408 sec. to    1.408 sec.
Spectral model in the cutoff power-law:
------------------------------------------------------------
Parameters  : value       lower 90%   higher 90%
Photon index: -0.295425     ( -0.90232   1.12332 )
Epeak [keV] : 64.3755      ( -12.8133 40.6796 )
Norm@50keV  : 8.94205E-02    ( -0.0894194   0.244121 )
------------------------------------------------------------
#Fit statistic  : Chi-Squared                   49.73     using 59 bins.
 Reduced chi-squared = 0.888036
# Null hypothesis probability of 7.10e-01 with 56 degrees of freedom

Photon flux (15-150 keV)    in 1 sec: 1.93944 ( -0.44304  0.34006 ) ph/cm2/s
Energy fluence (15-150 keV)             : 1.67888e-07 ( -2.6605e-08  2.75549e-08 ) ergs/cm2
Time-resolved spectra
Distribution
T90 vs. Hardness ratio plot
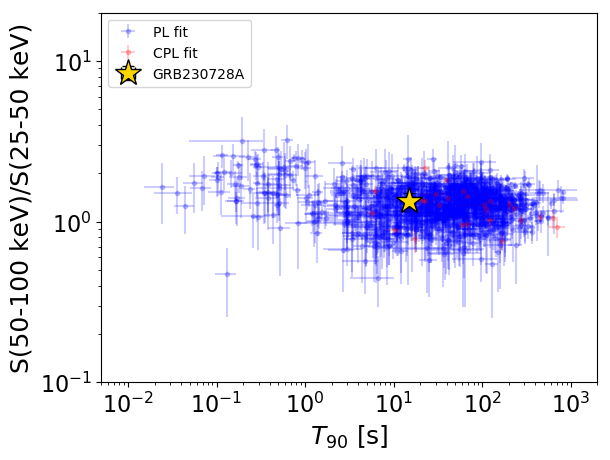
T90                                   = 14.76 sec.
Hardness ratio (energy fluence ratio) = 1.33835103149
S(15-50 keV) vs. S(50-150 keV) plot
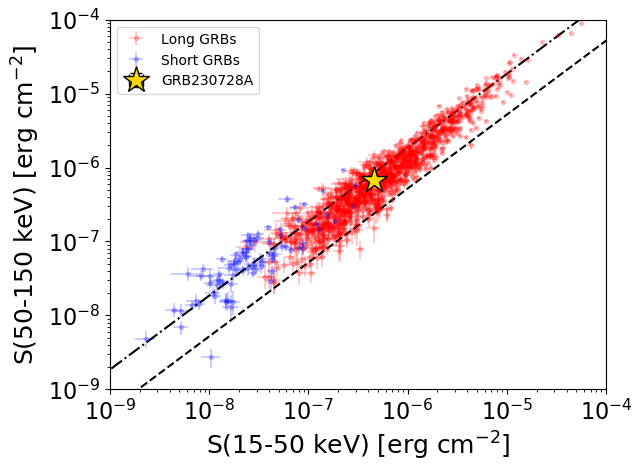
S(15-50 keV)  = 4.541137e-07
S(50-150 keV) = 6.711515e-07
The dash-dotted line and the dashed line traces the fluences calculated from the Band function with Epeak = 15 and 150 keV, respectively. Both lines assume a canonical values of alpha = -1 and beta = -2.5.
Mask shadow pattern
IMX = 7.788767482658679E-02, IMY = -4.715112162178338E-01
Spacecraft aspect plot
Bright source in the pre-burst/pre-slew/post-slew images
Pre-burst image of 15-350 keV band
Time interval of the image:
-188.043400 -5.620000

# RAcent  DECcent POSerr Theta    Phi  PeakCts   SNR AngSep     Name
#  [deg]    [deg]    ['] [deg]  [deg]                   [']
299.4827  35.1254    4.7  43.5  143.4   3.0471   2.4    7.0	Cyg X-1
308.0455  41.0063    5.7  34.6  144.2   1.3191   2.0    4.4	Cyg X-3
326.1724  38.3222   49.8  25.2  122.6   0.1132   0.2    0.0	Cyg X-2
342.8763  21.3983    3.0  32.2   77.5   2.9241   3.9 ------	UNKNOWN
354.4359  31.2312    2.4  20.5   58.4   2.1276   4.8 ------	UNKNOWN
 40.9047  61.4449    1.0  25.6  -77.0   5.4107  11.2 ------	UNKNOWN
195.2330  78.5237    2.2  49.3 -132.2   9.0921   5.3 ------	UNKNOWN
Pre-slew background subtracted image of 15-350 keV band
Time interval of the image:
-5.620000 10.740000

# RAcent  DECcent POSerr Theta    Phi  PeakCts   SNR AngSep     Name
#  [deg]    [deg]    ['] [deg]  [deg]                   [']
299.6457  35.0720    7.3  43.5  143.2  -0.2894  -1.6    8.2	Cyg X-1
308.0534  41.0914   12.2  34.5  144.3  -0.1000  -0.9    8.7	Cyg X-3
326.3243  38.2171    8.6  25.2  122.2   0.1096   1.3    9.5	Cyg X-2
343.5141  28.1695    0.6  25.5   80.6   1.9449  20.9 ------	UNKNOWN
Post-slew image of 15-350 keV band
Time interval of the image:
77.956600 962.188000

# RAcent  DECcent POSerr Theta    Phi  PeakCts   SNR AngSep     Name
#  [deg]    [deg]    ['] [deg]  [deg]                   [']
299.6126  35.1581    1.9  37.7  161.3  16.6854   6.0    2.8	Cyg X-1
308.0570  41.0208    5.2  31.6  172.7   4.5546   2.2    4.8	Cyg X-3
326.1753  38.2703    5.3  17.7  178.7  -3.1168  -2.2    3.1	Cyg X-2
344.6609  -9.0428    3.5  37.2   47.4  10.1150   3.3 ------	UNKNOWN
349.9288  66.8751    2.3  38.9 -126.7  14.4238   4.9 ------	UNKNOWN
 36.8614  27.4639    2.4  46.8  -53.2  32.5689   4.7 ------	UNKNOWN