Analysis Summary
Notes:
- 1) No attempt has been made to eliminate the non-significant decimal places.
- 2) This batgrbproduct analysis is done using the HEASARC data.
- 3) This batgrbproduct analysis is using the flight position for the mask-weighting calculation.
======================================================================
                  BAT GRB EVENT DATA PROCESSING REPORT
    Process Script Ver: batgrbproduct v2.48
    Process Start Time: Fri Sep 29 23:33:45 EDT 2023
             Host Name: batproc1
   Current Working Dir: /local/data/bat1/alien/Swift_3rdBATcatalog/event/batevent_reproc/trigger1182085
======================================================================

  Trigger: 01182085      Segment: 000

  BAT Trigger Time: 712651857.92   [s; MET]
      Trigger Stop: 712651858.944   [s; MET]
               UTC: 2023-08-02T06:50:26.167840    [includes UTCF correction]
       Where From?: TDRSS position message

  BAT
    RA: 76.2208192215202   Dec: 19.5695249975392  [deg; J2000]

     Catalogged Source?: NO
     Point Source?:      YES
     GRB Indicated?:     YES    [ by BAT flight software ]
     Image S/N Ratio:    16.03
     Image Trigger?:     NO
     Rate S/N Ratio:     44.7772263544762  [ if not an image trigger ]
     Image S/N Ratio:    16.03

  Analysis Position:   [ source = BAT ]
    RA: 76.2208192215202   Dec: 19.5695249975392  [deg; J2000]

  Refined Position:   [ source = BAT pre-slew burst ]
    RA: 76.2238532931443   Dec: 19.551449262808  [deg; J2000]
        { 05h 04m 53.7s , +19d 33' 05.2" }
         +/- 0.747217035379887 [arcmin] (estimated 90% radius based on SNR)
         +/- 0.219704183527653 [arcmin] (formal 1-sigma fit error)
    SNR: 46.122062112331

  Angular difference between the analysis and refined position is 1.098026 arcmin

  Partial Coding Fraction: 0.9921875    [ including projection effects ]

  Duration
     T90: 175.151999950409 +/- 17.2938731807917
        Measured from: -1.77999997138977
                   to: 173.371999979019     [s; relative to TRIGTIME]
     T50: 99.4599999189377 +/- 52.115483664208
        Measured from: 4.9760000705719
                   to: 104.43599998951     [s; relative to TRIGTIME]


  Fluence
     Peak Flux  (peak 1 second)
        Measured from: 0.604000091552734
                   to: 1.60400009155273     [s; relative to TRIGTIME]
     Total Fluence
        Measured from: -6.03999996185303
                   to: 230.344000101089     [s; relative to TRIGTIME]

             Band 1     Band 2     Band 3     Band 4
              15-25      25-50     50-100    100-350     keV
 Total     2.443158   3.346580   2.174354   0.519124
           0.102386   0.104601   0.087753   0.070505 [error]
 Peak      0.045713   0.098184   0.129270   0.031611
           0.007258   0.008190   0.008270   0.005820 [error]

     [ fluence units of on-axis counts / fully illuminated detector ]

======================================================================


====== Table of the duration information =============================

        Value   tstart    tstop
T100  236.384   -6.040  230.344
T90   175.152   -1.780  173.372
T50    99.460    4.976  104.436
Peak    1.000    0.604    1.604


====== Spectral Analysis Summary =====================================

Model      : spectral model: simple power-law (PL) and cutoff power-law (CPL)
Ph_index   : photon index: E^{Ph_index}
Ph_90err   : 90% error of the photon index
Epeak      : Epeak in keV
Epeak_90err: 90% error of Epeak
Norm       : normalization at 50 keV in both the PL model and CPL model
Nomr_90err : 90% error of the normalization
chi2       : Chi-Squared
dof        : degree of freedo

=== Time-averaged spectral analysis ===
(Best model with acceptable fit: PL)

Model Ph_index Ph_90err_low Ph_90err_hi  Epeak  Epeak_90err_low  Epeak_90err_hi  Norm       Nomr_90err_low    Norm_90err_hi    chi2    dof
PL      -1.612    -0.072      0.072       -           -               -         2.23e-03     -8.76e-05          8.74e-05      66.270   57
CPL     -1.274    -0.289      0.311      108.272     -29.652       283.352      3.27e-03     -9.01e-04          1.36e-03      62.270   56


=== 1-s peak spectral analysis ===
(Best model with acceptable fit: CPL)

Model Ph_index Ph_90err_low Ph_90err_hi  Epeak  Epeak_90err_low  Epeak_90err_hi  Norm       Nomr_90err_low    Norm_90err_hi    chi2    dof
PL      -0.789     -0.128     0.132       -           -               -         2.03e-02     -1.62e-03          1.61e-03      50.610   57
CPL      0.115     -0.606     0.717      141.512     -36.840       154.383      4.86e-02     -2.12e-02          4.47e-02      43.700   56


=== Fluence/Peak Flux Summary ===

              Model    Band1     Band2     Band3     Band4     Band5     Total
                       15-25     25-50    50-100    100-350    15-150    15-350    keV
Fluence         PL   7.47e-07  1.28e-06  1.68e-06  4.45e-06  4.92e-06  8.16e-06   erg/cm2
      90%_error_low -5.16e-08 -5.28e-08 -8.68e-08 -4.87e-07 -2.06e-07 -5.51e-07   erg/cm2
      90%_error_hi   5.29e-08  5.25e-08  8.67e-08  5.27e-07  2.07e-07  5.82e-07   erg/cm2
Peak flux       PL   4.24e-01  6.53e-01  7.56e-01  1.68e+00  2.33e+00  3.51e+00   ph/cm2/s
      90%_error_low -6.79e-02 -6.69e-02 -5.98e-02 -2.68e-01 -1.82e-01 -3.07e-01   ph/cm2/s
      90%_error_hi   7.21e-02  6.63e-02  5.96e-02  3.00e-01  1.82e-01  3.19e-01   ph/cm2/s

Fluence        CPL   7.00e-07  1.32e-06  1.71e-06  2.72e-06  4.78e-06  6.44e-06   erg/cm2
      90%_error_low -6.39e-08 -6.15e-08 -9.25e-08 -8.81e-07 -2.38e-07 -9.10e-07   erg/cm2
      90%_error_hi   6.50e-08  6.23e-08  9.34e-08  1.41e-06  2.37e-07  1.41e-06   erg/cm2
Peak flux      CPL   3.24e-01  6.72e-01  8.44e-01  8.11e-01  2.26e+00  2.65e+00   ph/cm2/s
      90%_error_low -8.68e-02 -7.49e-02 -8.26e-02 -2.80e-01 -1.88e-01 -3.41e-01   ph/cm2/s
      90%_error_hi   9.35e-02  7.48e-02  8.44e-02  4.79e-01  1.88e-01  4.96e-01   ph/cm2/s

======================================================================
Image
Pre-slew 15.0-350.0 keV image (Event data)
#   RAcent    DECcent   POSerr    Theta     Phi              Peak Cts       SNR   Name
   76.2239    19.5514   0.0042    11.1193   147.8299         3.5366966     46.122 TRIG_01182085

Foreground time interval of the image:
 -6.040  11.581 (delta_t =  17.621 [sec])
Background time interval of the image:
-37.419  -6.040 (delta_t =  31.379 [sec])
Light Curves
Note: The mask-weighted lightcurves have units of either count/det or counts/sec/det, where a det is 0.4 x 0.4 = 0.16 sq cm.
Full-time range; 1 s binning
Other quick-look light curves:
- 64 ms binning (zoomed)
- 16 ms binning (zoomed)
- 8 ms binning (zoomed)
- 2 ms binning (zoomed)
- SN=5 or 10 s binning (full-time range)
- Raw light curve
Spectra
- 64 ms binning (zoomed)
- 16 ms binning (zoomed)
- 8 ms binning (zoomed)
- 2 ms binning (zoomed)
- SN=5 or 10 s binning (full-time range)
- Raw light curve
Spectra
Notes:
- 1) The fitting includes the systematic errors.
- 2) When the burst includes telescope slew time periods, the fitting uses an average response file made from multiple 5-s response files through out the slew time plus single time preiod for the non-slew times, and weighted by the total counts in the corresponding time period using addrmf. An average response file is needed becuase a spectral fit using the pre-slew DRM will introduce some errors in both a spectral shape and a normalization if the PHA file contains a lot of the slew/post-slew time interval.
- 3) For fits to more complicated models (e.g. a power-law over a cutoff power-law), the BAT team has decided to require a chi-square improvement of more than 6 for each extra dof.
Time averaged spectrum fit using the average DRM
Power-law model
Time interval is from   -6.040 sec. to  230.344 sec.

Spectral model in power-law:
------------------------------------------------------------
Parameters  : value       lower 90%   higher 90%
Photon index: -1.61202     ( -0.0719884   0.0716393 )
Norm@50keV  : 2.22647E-03    ( -8.7581e-05   8.74147e-05 )
------------------------------------------------------------
#Fit statistic  : Chi-Squared                   66.27     using 59 bins.
 Reduced chi-squared = 1.16263
# Null hypothesis probability of 1.87e-01 with 57 degrees of freedom

Photon flux (15-150 keV)    in 236.4 sec: 0.287197 ( -0.011668  0.011695 ) ph/cm2/s
Energy fluence (15-150 keV)             : 4.91596e-06 ( -2.0589e-07  2.06721e-07 ) ergs/cm2
Cutoff power-law model
Time interval is from   -6.040 sec. to  230.344 sec.
Spectral model in the cutoff power-law:
------------------------------------------------------------
Parameters  : value       lower 90%   higher 90%
Photon index: -1.27392     ( -0.289469   0.310759 )
Epeak [keV] : 108.272      ( -29.6525 283.352 )
Norm@50keV  : 3.27417E-03    ( -0.000900936   0.00135799 )
------------------------------------------------------------
#Fit statistic  : Chi-Squared                   62.27     using 59 bins.
 Reduced chi-squared = 1.11196
# Null hypothesis probability of 2.63e-01 with 56 degrees of freedom

Photon flux (15-150 keV)    in 236.4 sec: 0.280985 ( -0.012749  0.012775 ) ph/cm2/s
Energy fluence (15-150 keV)             : 4.77779e-06 ( -2.37979e-07  2.37173e-07 ) ergs/cm2
1-s peak spectrum fit
Power-law model
Time interval is from    0.604 sec. to    1.604 sec.

Spectral model in power-law:
------------------------------------------------------------
Parameters  : value       lower 90%   higher 90%
Photon index: -0.7891     ( -0.128346   0.132065 )
Norm@50keV  : 2.02557E-02    ( -0.00162017   0.00160982 )
------------------------------------------------------------
#Fit statistic  : Chi-Squared                   50.61     using 59 bins.
 Reduced chi-squared = 0.887895
# Null hypothesis probability of 7.12e-01 with 57 degrees of freedom

Photon flux (15-150 keV)    in 1 sec: 2.32896 ( -0.18216  0.18243 ) ph/cm2/s
Energy fluence (15-150 keV)             : 2.37821e-07 ( -1.94274e-08  1.95147e-08 ) ergs/cm2
Cutoff power-law model
Time interval is from    0.604 sec. to    1.604 sec.
Spectral model in the cutoff power-law:
------------------------------------------------------------
Parameters  : value       lower 90%   higher 90%
Photon index: 0.115381     ( -0.606478   0.717188 )
Epeak [keV] : 141.512      ( -36.8401 154.383 )
Norm@50keV  : 4.86112E-02    ( -0.0211639   0.0447347 )
------------------------------------------------------------
#Fit statistic  : Chi-Squared                   43.70     using 59 bins.
 Reduced chi-squared = 0.780357
# Null hypothesis probability of 8.84e-01 with 56 degrees of freedom

Photon flux (15-150 keV)    in 1 sec: 2.26498 ( -0.18821  0.18776 ) ph/cm2/s
Energy fluence (15-150 keV)             : 2.30893e-07 ( -2.07475e-08  2.06024e-08 ) ergs/cm2
Time-resolved spectra
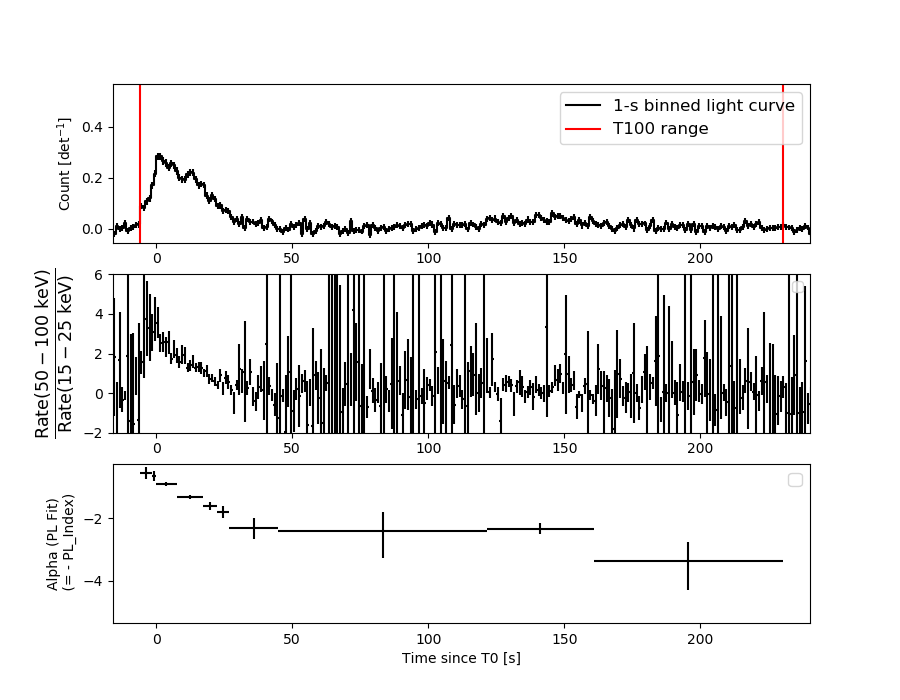
Distribution
T90 vs. Hardness ratio plot
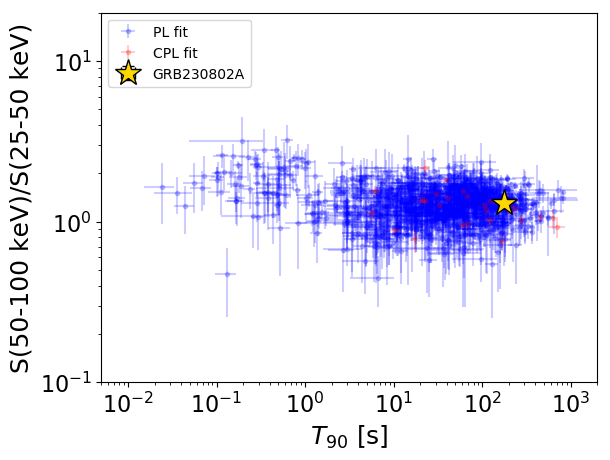
T90                                   = 175.152 sec.
Hardness ratio (energy fluence ratio) = 1.30854903699
S(15-50 keV) vs. S(50-150 keV) plot
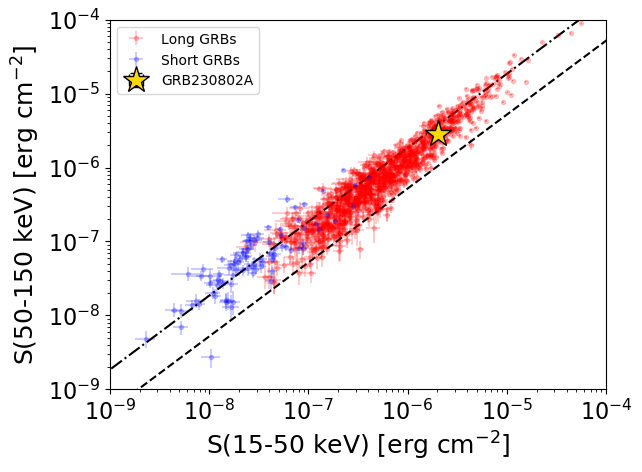
S(15-50 keV)  = 2.0279825e-06
S(50-150 keV) = 2.888052e-06
The dash-dotted line and the dashed line traces the fluences calculated from the Band function with Epeak = 15 and 150 keV, respectively. Both lines assume a canonical values of alpha = -1 and beta = -2.5.
Mask shadow pattern
IMX = -1.663669658110273E-01, IMY = -1.046454836695666E-01
Spacecraft aspect plot
Bright source in the pre-burst/pre-slew/post-slew images
Pre-burst image of 15-350 keV band
Time interval of the image:
-37.419400 -6.040000

# RAcent  DECcent POSerr Theta    Phi  PeakCts   SNR AngSep     Name
#  [deg]    [deg]    ['] [deg]  [deg]                   [']
 83.6423  22.0341    0.7  11.1 -173.2   1.2430  15.5    1.3	Crab
 49.2280  -2.8154    2.3  36.8   76.4   1.2490   5.0 ------	UNKNOWN
 72.6376  68.1795    2.3  57.7 -178.4   2.3472   5.1 ------	UNKNOWN
101.5101  48.2236    2.2  40.2 -155.1   0.5710   5.2 ------	UNKNOWN
Pre-slew background subtracted image of 15-350 keV band
Time interval of the image:
-6.040000 11.580590

# RAcent  DECcent POSerr Theta    Phi  PeakCts   SNR AngSep     Name
#  [deg]    [deg]    ['] [deg]  [deg]                   [']
 83.7898  22.0197   49.5  11.1 -172.5  -0.0177  -0.2    8.7	Crab
 59.7214  29.1205    2.4  28.7  139.1   0.5294   4.7 ------	UNKNOWN
 72.0333  -1.8167    2.4  17.2   48.9   0.3831   4.8 ------	UNKNOWN
 68.6641  41.5975    2.1  33.3  165.9   0.5339   5.6 ------	UNKNOWN
 76.2239  19.5514    0.2  11.1  147.8   3.5365  46.1 ------	UNKNOWN
 74.7163  55.5452    1.9  45.1  179.3   0.8299   6.1 ------	UNKNOWN
 97.6184 -42.6899    2.3  55.2   -6.2   1.6796   5.0 ------	UNKNOWN
101.6055  65.7064    2.2  56.1 -164.8   1.5344   5.3 ------	UNKNOWN
116.9411  62.1257    2.1  56.5 -155.7   1.6282   5.5 ------	UNKNOWN
Post-slew image of 15-350 keV band
Time interval of the image:
51.980600 962.143200

# RAcent  DECcent POSerr Theta    Phi  PeakCts   SNR AngSep     Name
#  [deg]    [deg]    ['] [deg]  [deg]                   [']
 83.6209  22.0114    0.4   7.3 -102.7  38.5453  30.7    0.7	Crab
 39.8456  15.7773    2.2  34.8   97.8  15.5837   5.3 ------	UNKNOWN
103.5914  16.1673    2.3  26.2  -78.9   7.7080   5.0 ------	UNKNOWN
104.4051  -4.2681    2.9  36.5  -44.2   6.6962   3.9 ------	UNKNOWN
124.3104  46.0311    4.1  47.3 -127.3  18.0634   2.8 ------	UNKNOWN
124.7447  47.6802    3.2  48.1 -129.3  23.1855   3.7 ------	UNKNOWN