Analysis Summary
Notes:
- 1) No attempt has been made to eliminate the non-significant decimal places.
- 2) This batgrbproduct analysis is done using the HEASARC data.
- 3) This batgrbproduct analysis is using the flight position for the mask-weighting calculation.
======================================================================
                  BAT GRB EVENT DATA PROCESSING REPORT
    Process Script Ver: batgrbproduct v2.48
    Process Start Time: Fri Sep 29 23:29:39 EDT 2023
             Host Name: batproc1
   Current Working Dir: /local/data/bat1/alien/Swift_3rdBATcatalog/event/batevent_reproc/trigger1185505
======================================================================

  Trigger: 01185505      Segment: 000

  BAT Trigger Time: 713789427.776   [s; MET]
      Trigger Stop: 713789428.8   [s; MET]
               UTC: 2023-08-15T10:49:55.945980    [includes UTCF correction]
       Where From?: TDRSS position message

  BAT
    RA: 184.771873845278   Dec: -58.0651019896104  [deg; J2000]

     Catalogged Source?: NO
     Point Source?:      YES
     GRB Indicated?:     YES    [ by BAT flight software ]
     Image S/N Ratio:    15.07
     Image Trigger?:     NO
     Rate S/N Ratio:     67.0447611674469  [ if not an image trigger ]
     Image S/N Ratio:    15.07

  Analysis Position:   [ source = BAT ]
    RA: 184.771873845278   Dec: -58.0651019896104  [deg; J2000]

  Refined Position:   [ source = BAT pre-slew burst ]
    RA: 184.760501860416   Dec: -58.0669424982515  [deg; J2000]
        { 12h 19m 02.5s , -58d 04' 01.0" }
         +/- 1.21113898820761 [arcmin] (estimated 90% radius based on SNR)
         +/- 0.459609514880024 [arcmin] (formal 1-sigma fit error)
    SNR: 23.1350173830039

  Angular difference between the analysis and refined position is 0.377424 arcmin

  Partial Coding Fraction: 0.1113281    [ including projection effects ]

  Duration
     T90: 17 +/- 7.61577310586391
        Measured from: -11.7760000228882
                   to: 5.22399997711182     [s; relative to TRIGTIME]
     T50: 2 +/- 1
        Measured from: -0.776000022888184
                   to: 1.22399997711182     [s; relative to TRIGTIME]


  Fluence
     Peak Flux  (peak 1 second)
        Measured from: 0.223999977111816
                   to: 1.22399997711182     [s; relative to TRIGTIME]
     Total Fluence
        Measured from: -14.7760000228882
                   to: 9.22399997711182     [s; relative to TRIGTIME]

             Band 1     Band 2     Band 3     Band 4
              15-25      25-50     50-100    100-350     keV
 Total     1.020229   2.281903   2.479680   1.148726
           0.121811   0.135263   0.128715   0.115206 [error]
 Peak      0.246698   0.442776   0.700451   0.252316
           0.031957   0.041196   0.044268   0.034941 [error]

     [ fluence units of on-axis counts / fully illuminated detector ]

======================================================================


====== Table of the duration information =============================

        Value   tstart    tstop
T100   24.000  -14.776    9.224
T90    17.000  -11.776    5.224
T50     2.000   -0.776    1.224
Peak    1.000    0.224    1.224


====== Spectral Analysis Summary =====================================

Model      : spectral model: simple power-law (PL) and cutoff power-law (CPL)
Ph_index   : photon index: E^{Ph_index}
Ph_90err   : 90% error of the photon index
Epeak      : Epeak in keV
Epeak_90err: 90% error of Epeak
Norm       : normalization at 50 keV in both the PL model and CPL model
Nomr_90err : 90% error of the normalization
chi2       : Chi-Squared
dof        : degree of freedo

=== Time-averaged spectral analysis ===
(Best model with acceptable fit: PL)

Model Ph_index Ph_90err_low Ph_90err_hi  Epeak  Epeak_90err_low  Epeak_90err_hi  Norm       Nomr_90err_low    Norm_90err_hi    chi2    dof
PL      -1.189    -0.100      0.102       -           -               -         2.16e-02     -1.29e-03          1.29e-03      51.540   57
CPL     -0.891    -0.340      0.450      221.917     -98.543      -221.917      2.91e-02     -8.19e-03          1.57e-02      50.030   56


=== 1-s peak spectral analysis ===
(Best model with acceptable fit: PL)

Model Ph_index Ph_90err_low Ph_90err_hi  Epeak  Epeak_90err_low  Epeak_90err_hi  Norm       Nomr_90err_low    Norm_90err_hi    chi2    dof
PL      -0.975     -0.129     0.133       -           -               -         1.19e-01     -9.66e-03          9.58e-03      40.600   57
CPL     -0.659     -0.448     0.612      264.391    -264.391      -264.391      1.62e-01     -4.89e-02          1.21e-01      39.640   56


=== Fluence/Peak Flux Summary ===

              Model    Band1     Band2     Band3     Band4     Band5     Total
                       15-25     25-50    50-100    100-350    15-150    15-350    keV
Fluence         PL   4.95e-07  1.10e-06  1.93e-06  7.91e-06  5.28e-06  1.14e-05   erg/cm2
      90%_error_low -5.97e-08 -8.21e-08 -1.20e-07 -1.06e-06 -3.13e-07 -1.12e-06   erg/cm2
      90%_error_hi   6.25e-08  8.15e-08  1.20e-07  1.17e-06  3.13e-07  1.21e-06   erg/cm2
Peak flux       PL   2.98e+00  4.10e+00  4.17e+00  7.72e+00  1.37e+01  1.90e+01   ph/cm2/s
      90%_error_low -4.86e-01 -4.31e-01 -3.27e-01 -1.21e+00 -1.13e+00 -1.50e+00   ph/cm2/s
      90%_error_hi   5.17e-01  4.27e-01  3.26e-01  1.34e+00  1.13e+00  1.52e+00   ph/cm2/s

Fluence        CPL   1.62e-07  2.29e-07  2.51e-07  6.72e-07  8.10e-07  1.43e-06   erg/cm2
      90%_error_low -7.88e-08 -1.62e-07 -1.69e-07 -4.45e-07 -3.84e-07 -1.07e-06   erg/cm2
      90%_error_hi   2.00e-08  1.12e-07  9.07e-08  3.69e-06  3.16e-07  1.86e-07   erg/cm2
Peak flux      CPL   2.70e+00  4.14e+00  4.37e+00  5.93e+00  1.36e+01  1.71e+01   ph/cm2/s
      90%_error_low -6.49e-01 -4.50e-01 -4.50e-01 -2.08e+00 -1.15e+00 -2.44e+00   ph/cm2/s
      90%_error_hi   6.50e-01  4.52e-01  4.73e-01  2.20e+00  1.16e+00  2.66e+00   ph/cm2/s

======================================================================
Image
Pre-slew 15.0-350.0 keV image (Event data)
#   RAcent    DECcent   POSerr    Theta     Phi              Peak Cts       SNR   Name
  184.7605   -58.0669   0.0083    54.4259    -2.7079         7.1087104     23.135 TRIG_01185505

Foreground time interval of the image:
-14.776   9.224 (delta_t =  24.000 [sec])
Background time interval of the image:
-239.776 -14.776 (delta_t = 225.000 [sec])
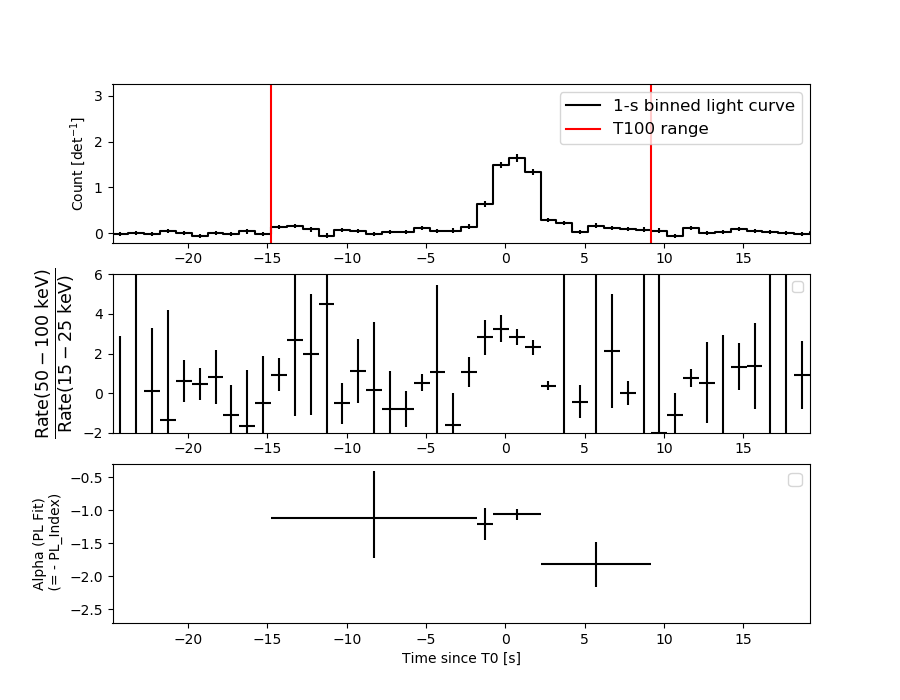
Light Curves
Note: The mask-weighted lightcurves have units of either count/det or counts/sec/det, where a det is 0.4 x 0.4 = 0.16 sq cm.
Full-time range; 1 s binning
Other quick-look light curves:
- 64 ms binning (zoomed)
- 16 ms binning (zoomed)
- 8 ms binning (zoomed)
- 2 ms binning (zoomed)
- SN=5 or 10 s binning (full-time range)
- Raw light curve
Spectra
- 64 ms binning (zoomed)
- 16 ms binning (zoomed)
- 8 ms binning (zoomed)
- 2 ms binning (zoomed)
- SN=5 or 10 s binning (full-time range)
- Raw light curve
Spectra
Notes:
- 1) The fitting includes the systematic errors.
- 2) When the burst includes telescope slew time periods, the fitting uses an average response file made from multiple 5-s response files through out the slew time plus single time preiod for the non-slew times, and weighted by the total counts in the corresponding time period using addrmf. An average response file is needed becuase a spectral fit using the pre-slew DRM will introduce some errors in both a spectral shape and a normalization if the PHA file contains a lot of the slew/post-slew time interval.
- 3) For fits to more complicated models (e.g. a power-law over a cutoff power-law), the BAT team has decided to require a chi-square improvement of more than 6 for each extra dof.
Time averaged spectrum fit using the average DRM
Power-law model
Time interval is from  -14.776 sec. to    9.224 sec.

Spectral model in power-law:
------------------------------------------------------------
Parameters  : value       lower 90%   higher 90%
Photon index: -1.18944     ( -0.100279   0.101914 )
Norm@50keV  : 2.16120E-02    ( -0.00129147   0.00128659 )
------------------------------------------------------------
#Fit statistic  : Chi-Squared                   51.54     using 59 bins.
 Reduced chi-squared = 0.904211
# Null hypothesis probability of 6.79e-01 with 57 degrees of freedom

Photon flux (15-150 keV)    in 24 sec: 2.53311 ( -0.16305  0.16377 ) ph/cm2/s
Energy fluence (15-150 keV)             : 5.27875e-06 ( -3.12586e-07  3.12914e-07 ) ergs/cm2
Cutoff power-law model
Time interval is from  -14.776 sec. to    9.224 sec.
Spectral model in the cutoff power-law:
------------------------------------------------------------
Parameters  : value       lower 90%   higher 90%
Photon index: -0.891034     ( -0.33998   0.449929 )
Epeak [keV] : 221.917      ( -98.5595 -221.933 )
Norm@50keV  : 2.90586E-02    ( -0.0081877   0.015659 )
------------------------------------------------------------
#Fit statistic  : Chi-Squared                   50.03     using 59 bins.
 Reduced chi-squared = 0.893393
# Null hypothesis probability of 6.99e-01 with 56 degrees of freedom

Photon flux (15-150 keV)    in 24 sec: 2.49832 ( -0.16917  0.17012 ) ph/cm2/s
Energy fluence (15-150 keV)             : 8.09676e-07 ( -3.84293e-07  3.15994e-07 ) ergs/cm2
1-s peak spectrum fit
Power-law model
Time interval is from    0.224 sec. to    1.224 sec.

Spectral model in power-law:
------------------------------------------------------------
Parameters  : value       lower 90%   higher 90%
Photon index: -0.975316     ( -0.129082   0.132725 )
Norm@50keV  : 0.119364    ( -0.00966196   0.00957907 )
------------------------------------------------------------
#Fit statistic  : Chi-Squared                   40.60     using 59 bins.
 Reduced chi-squared = 0.712281
# Null hypothesis probability of 9.51e-01 with 57 degrees of freedom

Photon flux (15-150 keV)    in 1 sec: 13.7261 ( -1.131  1.1345 ) ph/cm2/s
Energy fluence (15-150 keV)             : 1.30236e-06 ( -1.02281e-07  1.02458e-07 ) ergs/cm2
Cutoff power-law model
Time interval is from    0.224 sec. to    1.224 sec.
Spectral model in the cutoff power-law:
------------------------------------------------------------
Parameters  : value       lower 90%   higher 90%
Photon index: -0.658599     ( -0.448412   0.612399 )
Epeak [keV] : 264.391      ( -264.394 -264.394 )
Norm@50keV  : 0.161521    ( -0.0489333   0.12064 )
------------------------------------------------------------
#Fit statistic  : Chi-Squared                   39.64     using 59 bins.
 Reduced chi-squared = 0.707857
# Null hypothesis probability of 9.52e-01 with 56 degrees of freedom

Photon flux (15-150 keV)    in 1 sec: 13.5966 ( -1.1519  1.1553 ) ph/cm2/s
Energy fluence (15-150 keV)             : 1.29903e-06 ( -1.03501e-07  1.03364e-07 ) ergs/cm2
Time-resolved spectra
Distribution
T90 vs. Hardness ratio plot
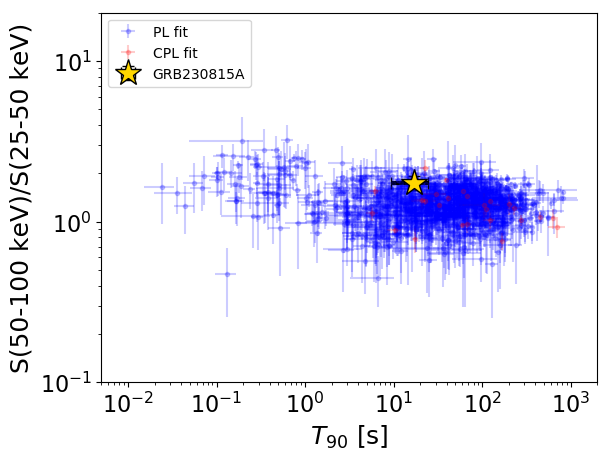
T90                                   = 17.0 sec.
Hardness ratio (energy fluence ratio) = 1.75392114149
S(15-50 keV) vs. S(50-150 keV) plot
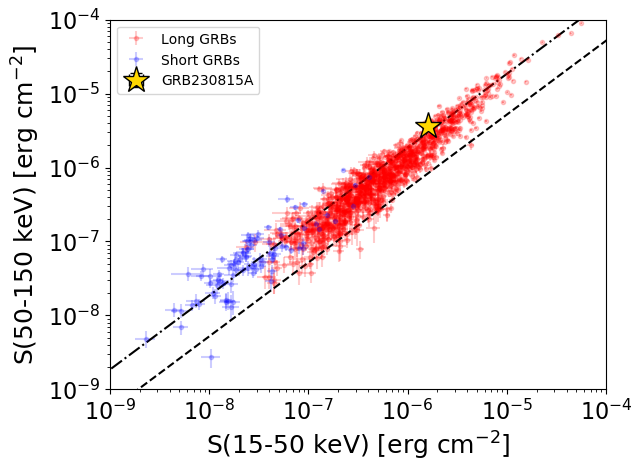
S(15-50 keV)  = 1.5972058e-06
S(50-150 keV) = 3.681456e-06
The dash-dotted line and the dashed line traces the fluences calculated from the Band function with Epeak = 15 and 150 keV, respectively. Both lines assume a canonical values of alpha = -1 and beta = -2.5.
Mask shadow pattern
IMX = 1.396560756530646E+00, IMY = 6.605224315631884E-02
Spacecraft aspect plot
Bright source in the pre-burst/pre-slew/post-slew images
Pre-burst image of 15-350 keV band
Time interval of the image:
-239.776000 -14.776000

# RAcent  DECcent POSerr Theta    Phi  PeakCts   SNR AngSep     Name
#  [deg]    [deg]    ['] [deg]  [deg]                   [']
135.5831 -40.6070    4.2  31.9  -44.4   1.6819   2.7    4.0	Vela X-1
170.3369 -60.6370    4.1  46.7   -3.5  -2.3224  -2.8    1.0	Cen X-3
186.7199 -62.7171    4.9  53.0    2.9   2.4530   2.4    3.6	GX 301-2
 37.7264 -29.2353    2.6  45.1  129.1  10.1835   4.4 ------	UNKNOWN
 56.4329   2.2302    2.6  56.8  173.9   8.4513   4.4 ------	UNKNOWN
119.9591 -35.3576    3.2  23.3  -66.8   1.9427   3.6 ------	UNKNOWN
101.6182   2.2872    3.2  48.1 -129.1   7.4502   3.7 ------	UNKNOWN
Pre-slew background subtracted image of 15-350 keV band
Time interval of the image:
-14.776000 9.224000

# RAcent  DECcent POSerr Theta    Phi  PeakCts   SNR AngSep     Name
#  [deg]    [deg]    ['] [deg]  [deg]                   [']
135.6570 -40.5378   10.2  32.0  -44.5  -0.1126  -1.1    5.9	Vela X-1
170.4328 -60.5888  838.3  46.7   -3.6   0.0021   0.0    4.0	Cen X-3
186.6634 -62.7690    9.7  53.0    3.0  -0.3365  -1.2    0.2	GX 301-2
 52.3581 -12.3010    2.3  46.9  159.4   0.8768   4.9 ------	UNKNOWN
 98.3784 -65.2544    2.4  20.5   30.1   0.3499   4.7 ------	UNKNOWN
184.7605 -58.0669    0.5  54.4   -2.7   7.1090  23.1 ------	UNKNOWN
 68.6156   9.8081    2.3  58.7 -169.3   2.0538   4.9 ------	UNKNOWN
Post-slew image of 15-350 keV band
Time interval of the image:
116.124600 962.354000

# RAcent  DECcent POSerr Theta    Phi  PeakCts   SNR AngSep     Name
#  [deg]    [deg]    ['] [deg]  [deg]                   [']
135.5922 -40.6414    3.1  35.4 -132.8   7.2365   3.8    6.0	Vela X-1
170.0199 -60.6685    7.6   7.9 -166.0   1.7268   1.5    9.1	Cen X-3
186.6339 -62.7979    2.4   4.9  119.4   5.1590   4.8    1.8	GX 301-2
176.8136 -35.2669    2.5  23.4  -66.9   6.6843   4.6 ------	UNKNOWN
188.2820 -13.0978    3.3  45.0  -45.5  10.0338   3.5 ------	UNKNOWN
129.7503 -29.1057    3.0  47.3 -127.2  20.9167   3.8 ------	UNKNOWN