Analysis Summary
Notes:
- 1) No attempt has been made to eliminate the non-significant decimal places.
- 2) This batgrbproduct analysis is done using the HEASARC data.
- 3) This batgrbproduct analysis is using the flight position for the mask-weighting calculation.
======================================================================
BAT GRB EVENT DATA PROCESSING REPORT
Process Script Ver: batgrbproduct v2.48
Process Start Time: Fri Sep 29 23:28:04 EDT 2023
Host Name: batproc1
Current Working Dir: /local/data/bat1/alien/Swift_3rdBATcatalog/event/batevent_reproc/trigger1185673
======================================================================
Trigger: 01185673 Segment: 000
BAT Trigger Time: 713894960.128 [s; MET]
Trigger Stop: 713894961.152 [s; MET]
UTC: 2023-08-16T16:08:48.290780 [includes UTCF correction]
Where From?: TDRSS position message
BAT
RA: 328.37496109811 Dec: 37.828503929981 [deg; J2000]
Catalogged Source?: NO
Point Source?: YES
GRB Indicated?: YES [ by BAT flight software ]
Image S/N Ratio: 7.42
Image Trigger?: NO
Rate S/N Ratio: 15.0332963783729 [ if not an image trigger ]
Image S/N Ratio: 7.42
Analysis Position: [ source = BAT ]
RA: 328.37496109811 Dec: 37.828503929981 [deg; J2000]
Refined Position: [ source = BAT pre-slew burst ]
RA: 328.453175208218 Dec: 37.8577755359379 [deg; J2000]
{ 21h 53m 48.8s , +37d 51' 28.0" }
+/- 1.20623606222768 [arcmin] (estimated 90% radius based on SNR)
+/- 0.379462930520351 [arcmin] (formal 1-sigma fit error)
SNR: 23.2694710435944
Angular difference between the analysis and refined position is 4.101017 arcmin
Partial Coding Fraction: 0.984375 [ including projection effects ]
Duration
T90: 19.4479999542236 +/- 3.21816099943384
Measured from: -4.24800002574921
to: 15.1999999284744 [s; relative to TRIGTIME]
T50: 7.25599992275238 +/- 1.54746240251562
Measured from: -0.723999977111816
to: 6.53199994564056 [s; relative to TRIGTIME]
Fluence
Peak Flux (peak 1 second)
Measured from: 0.595999956130981
to: 1.59599995613098 [s; relative to TRIGTIME]
Total Fluence
Measured from: -5.56400001049042
to: 16.4839999675751 [s; relative to TRIGTIME]
Band 1 Band 2 Band 3 Band 4
15-25 25-50 50-100 100-350 keV
Total 0.359209 0.433432 0.346847 0.106696
0.028446 0.029565 0.025859 0.022254 [error]
Peak 0.038055 0.046159 0.038396 0.012128
0.006296 0.006567 0.005782 0.004864 [error]
[ fluence units of on-axis counts / fully illuminated detector ]
======================================================================
====== Table of the duration information =============================
Value tstart tstop
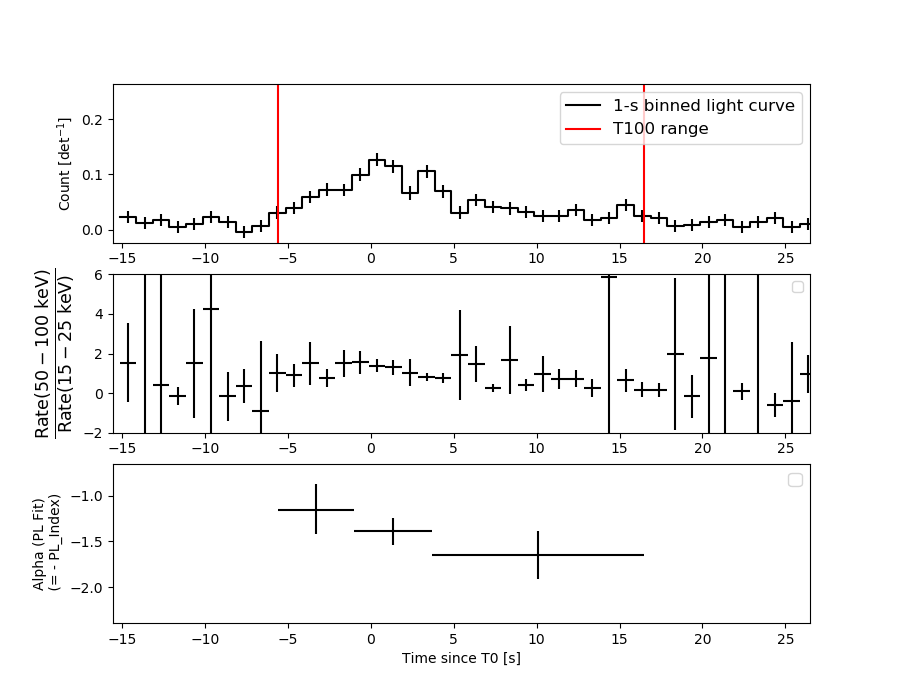
T100 22.048 -5.564 16.484
T90 19.448 -4.248 15.200
T50 7.256 -0.724 6.532
Peak 1.000 0.596 1.596
====== Spectral Analysis Summary =====================================
Model : spectral model: simple power-law (PL) and cutoff power-law (CPL)
Ph_index : photon index: E^{Ph_index}
Ph_90err : 90% error of the photon index
Epeak : Epeak in keV
Epeak_90err: 90% error of Epeak
Norm : normalization at 50 keV in both the PL model and CPL model
Nomr_90err : 90% error of the normalization
chi2 : Chi-Squared
dof : degree of freedo
=== Time-averaged spectral analysis ===
(Best model with acceptable fit: PL)
Model Ph_index Ph_90err_low Ph_90err_hi Epeak Epeak_90err_low Epeak_90err_hi Norm Nomr_90err_low Norm_90err_hi chi2 dof
PL -1.426 -0.132 0.132 - - - 3.50e-03 -2.56e-04 2.55e-04 67.400 57
CPL -1.398 -0.159 0.369 998.553 -998.553 -998.553 3.63e-03 -3.70e-04 1.38e-04 67.510 56
=== 1-s peak spectral analysis ===
(Best model with acceptable fit: PL)
Model Ph_index Ph_90err_low Ph_90err_hi Epeak Epeak_90err_low Epeak_90err_hi Norm Nomr_90err_low Norm_90err_hi chi2 dof
PL -1.463 -0.268 0.263 - - - 8.05e-03 -1.24e-03 1.22e-03 43.950 57
CPL -1.456 -0.274 0.315 9999.320 -9999.320 -9999.320 8.08e-03 -1.25e-03 1.28e-02 43.960 56
=== Fluence/Peak Flux Summary ===
Model Band1 Band2 Band3 Band4 Band5 Total
15-25 25-50 50-100 100-350 15-150 15-350 keV
Fluence PL 9.21e-08 1.77e-07 2.64e-07 8.45e-07 7.43e-07 1.38e-06 erg/cm2
90%_error_low -1.16e-08 -1.35e-08 -2.53e-08 -1.65e-07 -6.07e-08 -1.86e-07 erg/cm2
90%_error_hi 1.20e-08 1.34e-08 2.52e-08 1.92e-07 6.13e-08 2.08e-07 erg/cm2
Peak flux PL 3.20e-01 3.29e-01 2.39e-01 2.78e-01 9.95e-01 1.16e+00 ph/cm2/s
90%_error_low -7.78e-02 -5.10e-02 -4.73e-02 -9.86e-02 -1.46e-01 -1.76e-01 ph/cm2/s
90%_error_hi 8.27e-02 5.03e-02 4.65e-02 1.28e-01 1.46e-01 1.79e-01 ph/cm2/s
Fluence CPL 9.25e-08 1.75e-07 2.62e-07 8.72e-07 7.49e-07 1.37e-06 erg/cm2
90%_error_low -1.34e-08 -1.57e-08 -2.40e-08 -4.26e-07 -7.30e-08 -3.90e-07 erg/cm2
90%_error_hi 1.23e-08 1.89e-08 2.66e-08 7.21e-08 5.82e-08 1.01e-07 erg/cm2
Peak flux CPL 3.24e-01 3.29e-01 2.38e-01 2.93e-01 9.98e-01 1.17e+00 ph/cm2/s
90%_error_low -8.35e-02 -5.07e-02 -4.61e-02 -5.17e-02 -1.58e-01 -1.74e-01 ph/cm2/s
90%_error_hi 7.89e-02 5.55e-02 4.88e-02 1.11e-01 1.50e-01 1.65e-01 ph/cm2/s
======================================================================
Image
Pre-slew 15.0-350.0 keV image (Event data)
#   RAcent    DECcent   POSerr    Theta     Phi              Peak Cts       SNR   Name
  328.4532    37.8578   0.0083    12.6449   142.6552         1.3068170     23.269 TRIG_01185673

Foreground time interval of the image:
 -5.564  16.484 (delta_t =  22.048 [sec])
Background time interval of the image:
-239.128  -5.564 (delta_t = 233.564 [sec])
Light Curves
Note: The mask-weighted lightcurves have units of either count/det or counts/sec/det, where a det is 0.4 x 0.4 = 0.16 sq cm.
Full-time range; 1 s binning
Other quick-look light curves:
- 64 ms binning (zoomed)
- 16 ms binning (zoomed)
- 8 ms binning (zoomed)
- 2 ms binning (zoomed)
- SN=5 or 10 s binning (full-time range)
- Raw light curve
Spectra
- 64 ms binning (zoomed)
- 16 ms binning (zoomed)
- 8 ms binning (zoomed)
- 2 ms binning (zoomed)
- SN=5 or 10 s binning (full-time range)
- Raw light curve
Spectra
Notes:
- 1) The fitting includes the systematic errors.
- 2) When the burst includes telescope slew time periods, the fitting uses an average response file made from multiple 5-s response files through out the slew time plus single time preiod for the non-slew times, and weighted by the total counts in the corresponding time period using addrmf. An average response file is needed becuase a spectral fit using the pre-slew DRM will introduce some errors in both a spectral shape and a normalization if the PHA file contains a lot of the slew/post-slew time interval.
- 3) For fits to more complicated models (e.g. a power-law over a cutoff power-law), the BAT team has decided to require a chi-square improvement of more than 6 for each extra dof.
Time averaged spectrum fit using the average DRM
Power-law model
Time interval is from   -5.564 sec. to   16.484 sec.

Spectral model in power-law:
------------------------------------------------------------
Parameters  : value       lower 90%   higher 90%
Photon index: -1.42592     ( -0.131674   0.131524 )
Norm@50keV  : 3.50490E-03    ( -0.000255731   0.000254788 )
------------------------------------------------------------
#Fit statistic  : Chi-Squared                   67.40     using 59 bins.
 Reduced chi-squared = 1.18246
# Null hypothesis probability of 1.63e-01 with 57 degrees of freedom

Photon flux (15-150 keV)    in 22.05 sec: 0.429419 ( -0.031206  0.031252 ) ph/cm2/s
Energy fluence (15-150 keV)             : 7.42999e-07 ( -6.07096e-08  6.13204e-08 ) ergs/cm2
Cutoff power-law model

Time interval is from   -5.564 sec. to   16.484 sec.
Spectral model in the cutoff power-law:
------------------------------------------------------------
Parameters  : value       lower 90%   higher 90%
Photon index: -1.42313     ( -0.159294   0.368952 )
Epeak [keV] : 1.00000E+04      ( -10000 -10000 )
Norm@50keV  : 3.51679E-03    ( -0.000257269   0.000249923 )
------------------------------------------------------------
#Fit statistic  : Chi-Squared                   67.41     using 59 bins.
 Reduced chi-squared = 1.20375
# Null hypothesis probability of 1.41e-01 with 56 degrees of freedom

Photon flux (15-150 keV)    in 22.05 sec: 0.431268 ( -0.041085  0.03719 ) ph/cm2/s
Energy fluence (15-150 keV)             : 7.49252e-07 ( -7.30003e-08  5.82032e-08 ) ergs/cm2
1-s peak spectrum fit
Power-law model

Time interval is from    0.596 sec. to    1.596 sec.

Spectral model in power-law:
------------------------------------------------------------
Parameters  : value       lower 90%   higher 90%
Photon index: -1.46257     ( -0.268483   0.26299 )
Norm@50keV  : 8.04819E-03    ( -0.00123911   0.00122079 )
------------------------------------------------------------
#Fit statistic  : Chi-Squared                   43.95     using 59 bins.
 Reduced chi-squared = 0.771053
# Null hypothesis probability of 8.97e-01 with 57 degrees of freedom

Photon flux (15-150 keV)    in 1 sec: 0.994980 ( -0.146071  0.14619 ) ph/cm2/s
Energy fluence (15-150 keV)             : 7.68493e-08 ( -1.31433e-08  1.33618e-08 ) ergs/cm2
Cutoff power-law model
Time interval is from    0.596 sec. to    1.596 sec.
Spectral model in the cutoff power-law:
------------------------------------------------------------
Parameters  : value       lower 90%   higher 90%
Photon index: -1.45565     ( -0.271495   0.317304 )
Epeak [keV] : 9999.32      ( -9999.36 -9999.36 )
Norm@50keV  : 8.07697E-03    ( -0.0012493   0.0127897 )
------------------------------------------------------------
#Fit statistic  : Chi-Squared                   43.96     using 59 bins.
 Reduced chi-squared = 0.785
# Null hypothesis probability of 8.78e-01 with 56 degrees of freedom

Photon flux (15-150 keV)    in 1 sec: 0.997995 ( -0.157694  0.150125 ) ph/cm2/s
Energy fluence (15-150 keV)             : 7.77141e-08 ( -1.43767e-08  1.23559e-08 ) ergs/cm2
Time-resolved spectra
Distribution
T90 vs. Hardness ratio plot
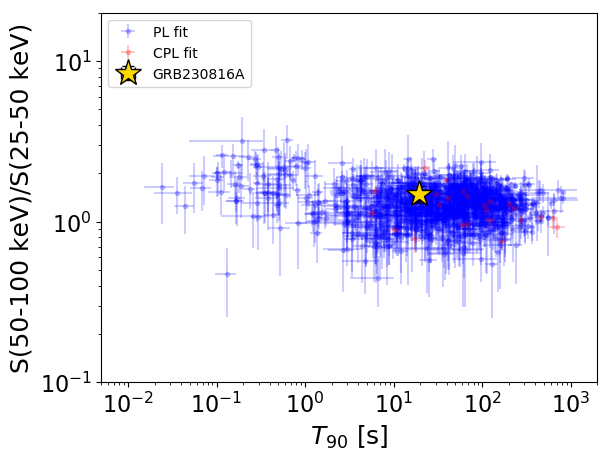
T90                                   = 19.448 sec.
Hardness ratio (energy fluence ratio) = 1.48874383186
S(15-50 keV) vs. S(50-150 keV) plot
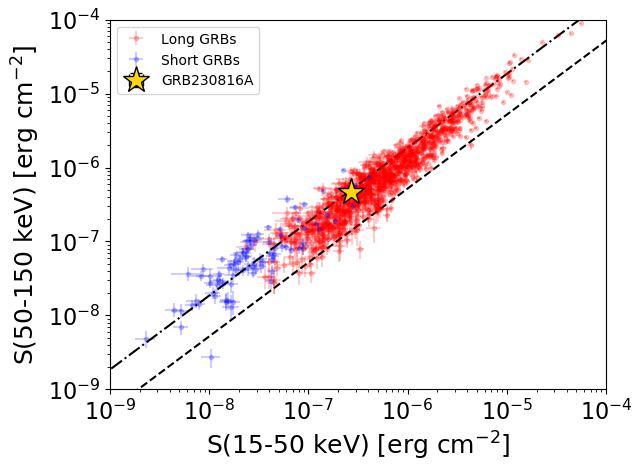
S(15-50 keV)  = 2.6908435e-07
S(50-150 keV) = 4.739269e-07
The dash-dotted line and the dashed line traces the fluences calculated from the Band function with Epeak = 15 and 150 keV, respectively. Both lines assume a canonical values of alpha = -1 and beta = -2.5.
Mask shadow pattern
IMX = -1.783571186160879E-01, IMY = -1.360920252802561E-01
Spacecraft aspect plot
Bright source in the pre-burst/pre-slew/post-slew images
Pre-burst image of 15-350 keV band
Time interval of the image:
-239.128000 -5.564000

# RAcent  DECcent POSerr Theta    Phi  PeakCts   SNR AngSep     Name
#  [deg]    [deg]    ['] [deg]  [deg]                   [']
299.5865  35.1904    0.6  35.4  155.7  10.9299  18.1    0.7	Cyg X-1
308.1893  41.0349    4.3  27.3  162.7   1.1804   2.7    6.1	Cyg X-3
326.1432  38.1874    9.4  14.3  146.2   0.4250   1.2    8.2	Cyg X-2
354.0541  -5.4229    2.4  46.8   46.4   4.8529   4.9  482.5	UNKNOWN
269.5498  83.3047    3.3  48.1 -129.1   5.6146   3.5 ------	UNKNOWN
Pre-slew background subtracted image of 15-350 keV band
Time interval of the image:
-5.564000 16.484000

# RAcent  DECcent POSerr Theta    Phi  PeakCts   SNR AngSep     Name
#  [deg]    [deg]    ['] [deg]  [deg]                   [']
299.7642  35.3106    6.0  35.2  155.8  -0.1664  -1.9   10.7	Cyg X-1
308.0499  40.8845    7.9  27.4  162.4   0.0982   1.4    4.9	Cyg X-3
326.1548  38.4822    8.2  14.2  147.3   0.0847   1.4    9.7	Cyg X-2
340.4687  16.6829    2.1  24.1   68.9   0.4173   5.5 ------	UNKNOWN
328.4532  37.8578    0.5  12.6  142.7   1.3069  23.2 ------	UNKNOWN
283.8020  46.7014    2.0  43.2  178.8   0.5568   5.8 ------	UNKNOWN
Post-slew image of 15-350 keV band
Time interval of the image:
71.972600 962.961900

# RAcent  DECcent POSerr Theta    Phi  PeakCts   SNR AngSep     Name
#  [deg]    [deg]    ['] [deg]  [deg]                   [']
254.4360  35.4145    4.6  57.8 -160.7 -14.0469  -2.5    4.4	Her X-1
288.6996  10.8177   66.3  44.6  150.4  -0.6476  -0.2    9.6	GRS 1915+105
299.5919  35.1894    0.4  23.2  179.4  37.3832  27.6    0.7	Cyg X-1
308.1528  40.9858    3.9  15.9 -165.2   3.8512   3.0    2.8	Cyg X-3
326.1581  38.1720    7.5   1.8 -171.5   1.8080   1.5    9.0	Cyg X-2
  7.8716   4.8086    1.8  48.8   29.7  16.4865   6.5  553.0	UNKNOWN
258.3148  62.1128    3.3  48.1 -129.2  19.3366   3.5 ------	UNKNOWN