Analysis Summary
Notes:
- 1) No attempt has been made to eliminate the non-significant decimal places.
- 2) This batgrbproduct analysis is done using the HEASARC data.
- 3) This batgrbproduct analysis is using the flight position for the mask-weighting calculation.
======================================================================
                  BAT GRB EVENT DATA PROCESSING REPORT
    Process Script Ver: batgrbproduct v2.48
    Process Start Time: Fri Sep 29 23:26:07 EDT 2023
             Host Name: batproc1
   Current Working Dir: /local/data/bat1/alien/Swift_3rdBATcatalog/event/batevent_reproc/trigger1186032
======================================================================

  Trigger: 01186032      Segment: 000

  BAT Trigger Time: 714094086.208   [s; MET]
      Trigger Stop: 714094086.72   [s; MET]
               UTC: 2023-08-18T23:27:34.357180    [includes UTCF correction]
       Where From?: TDRSS position message

  BAT
    RA: 285.882942578261   Dec: 40.8763661027751  [deg; J2000]

     Catalogged Source?: NO
     Point Source?:      YES
     GRB Indicated?:     YES    [ by BAT flight software ]
     Image S/N Ratio:    9.15
     Image Trigger?:     NO
     Rate S/N Ratio:     10.6301458127346  [ if not an image trigger ]
     Image S/N Ratio:    9.15

  Analysis Position:   [ source = BAT ]
    RA: 285.882942578261   Dec: 40.8763661027751  [deg; J2000]

  Refined Position:   [ source = BAT pre-slew burst ]
    RA: 285.886890595235   Dec: 40.8865418305054  [deg; J2000]
        { 19h 03m 32.9s , +40d 53' 11.6" }
         +/- 1.1576555341716 [arcmin] (estimated 90% radius based on SNR)
         +/- 0.416357918680518 [arcmin] (formal 1-sigma fit error)
    SNR: 24.6769075422566

  Angular difference between the analysis and refined position is 0.636270 arcmin

  Partial Coding Fraction: 0.3242188    [ including projection effects ]

  Duration
     T90: 64 +/- 35.7770876399966
        Measured from: 0.79200005531311
                   to: 64.7920000553131     [s; relative to TRIGTIME]
     T50: 16 +/- 16
        Measured from: 0.79200005531311
                   to: 16.7920000553131     [s; relative to TRIGTIME]


  Fluence
     Peak Flux  (peak 1 second)
        Measured from: 8.29200005531311
                   to: 9.29200005531311     [s; relative to TRIGTIME]
     Total Fluence
        Measured from: 0.79200005531311
                   to: 80.7920000553131     [s; relative to TRIGTIME]

             Band 1     Band 2     Band 3     Band 4
              15-25      25-50     50-100    100-350     keV
 Total     0.691922   1.184709   0.913304   0.317926
           0.086265   0.089735   0.078232   0.065787 [error]
 Peak      0.012076   0.033837   0.005497   0.010404
           0.012142   0.013203   0.011934   0.009939 [error]

     [ fluence units of on-axis counts / fully illuminated detector ]

======================================================================


====== Table of the duration information =============================

        Value   tstart    tstop
T100   80.000    0.792   80.792
T90    64.000    0.792   64.792
T50    16.000    0.792   16.792
Peak    1.000    8.292    9.292


====== Spectral Analysis Summary =====================================

Model      : spectral model: simple power-law (PL) and cutoff power-law (CPL)
Ph_index   : photon index: E^{Ph_index}
Ph_90err   : 90% error of the photon index
Epeak      : Epeak in keV
Epeak_90err: 90% error of Epeak
Norm       : normalization at 50 keV in both the PL model and CPL model
Nomr_90err : 90% error of the normalization
chi2       : Chi-Squared
dof        : degree of freedo

=== Time-averaged spectral analysis ===
(Best model with acceptable fit: PL)

Model Ph_index Ph_90err_low Ph_90err_hi  Epeak  Epeak_90err_low  Epeak_90err_hi  Norm       Nomr_90err_low    Norm_90err_hi    chi2    dof
PL      -1.428    -0.145      0.146       -           -               -         2.80e-03     -2.33e-04          2.33e-04      55.170   57
CPL     -1.270    -0.287      0.594      246.426    -246.426      -246.426      3.34e-03     -9.88e-04          3.00e-03      54.920   56


=== 1-s peak spectral analysis ===
(Best model with acceptable fit: N/A)

Model Ph_index Ph_90err_low Ph_90err_hi  Epeak  Epeak_90err_low  Epeak_90err_hi  Norm       Nomr_90err_low    Norm_90err_hi    chi2    dof
PL      -1.977     -3.018     1.351       -           -               -         2.82e-03     -2.82e-03          2.67e-03      79.650   57
CPL      9.103     -8.127    -9.103       46.966      -9.576        10.611      1.19e+03     -1.19e+03          3.87e+04      75.160   56


=== Fluence/Peak Flux Summary ===

              Model    Band1     Band2     Band3     Band4     Band5     Total
                       15-25     25-50    50-100    100-350    15-150    15-350    keV
Fluence         PL   2.67e-07  5.13e-07  7.64e-07  2.44e-06  2.15e-06  3.99e-06   erg/cm2
      90%_error_low -4.09e-08 -4.87e-08 -7.69e-08 -4.99e-07 -1.90e-07 -5.56e-07   erg/cm2
      90%_error_hi   4.28e-08  4.82e-08  7.62e-08  5.81e-07  1.91e-07  6.19e-07   erg/cm2
Peak flux       PL   1.90e-01  1.39e-01  6.72e-02  4.86e-02  4.19e-01  4.46e-01   ph/cm2/s
      90%_error_low -1.90e-01 -1.39e-01 -6.72e-02 -4.86e-02 -3.52e-01 -3.75e-01   ph/cm2/s
      90%_error_hi   2.16e-01  1.17e-01  9.02e-02  1.87e-01  3.52e-01  3.77e-01   ph/cm2/s

Fluence        CPL   2.59e-07  5.21e-07  7.75e-07  1.95e-06  2.14e-06  3.50e-06   erg/cm2
      90%_error_low -4.90e-08 -5.39e-08 -8.49e-08 -1.01e-06 -2.03e-07 -1.02e-06   erg/cm2
      90%_error_hi   3.96e-08  5.64e-08  8.76e-08  6.34e-07  2.00e-07  1.04e-06   erg/cm2
Peak flux      CPL     N/A      N/A      N/A      N/A      N/A      N/A     ph/cm2/s
      90%_error_low -1.90e-01 -1.39e-01 -6.72e-02 -4.86e-02 -3.52e-01 -3.75e-01   ph/cm2/s
      90%_error_hi   2.16e-01  1.17e-01  9.02e-02  1.87e-01  3.52e-01  3.77e-01   ph/cm2/s

======================================================================
Image
Pre-slew 15.0-350.0 keV image (Event data)
#   RAcent    DECcent   POSerr    Theta     Phi              Peak Cts       SNR   Name
  285.8869    40.8865   0.0078    46.3810  -153.6598         2.2681347     24.677 TRIG_01186032

Foreground time interval of the image:
  0.792  10.093 (delta_t =   9.301 [sec])
Background time interval of the image:
-166.907   0.792 (delta_t = 167.699 [sec])
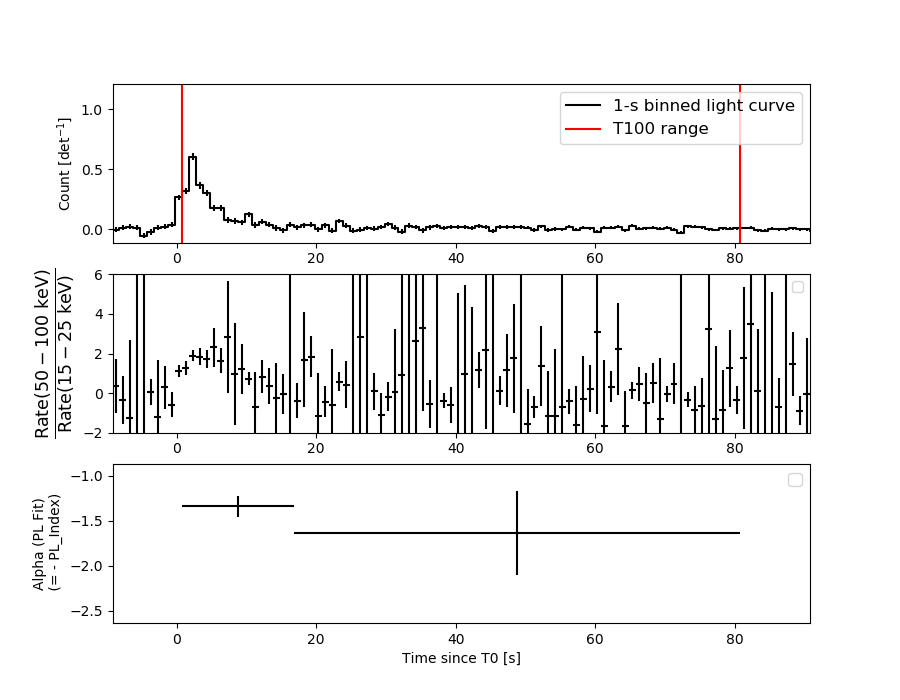
Light Curves
Note: The mask-weighted lightcurves have units of either count/det or counts/sec/det, where a det is 0.4 x 0.4 = 0.16 sq cm.
Full-time range; 1 s binning
Other quick-look light curves:
- 64 ms binning (zoomed)
- 16 ms binning (zoomed)
- 8 ms binning (zoomed)
- 2 ms binning (zoomed)
- SN=5 or 10 s binning (full-time range)
- Raw light curve
Spectra
- 64 ms binning (zoomed)
- 16 ms binning (zoomed)
- 8 ms binning (zoomed)
- 2 ms binning (zoomed)
- SN=5 or 10 s binning (full-time range)
- Raw light curve
Spectra
Notes:
- 1) The fitting includes the systematic errors.
- 2) When the burst includes telescope slew time periods, the fitting uses an average response file made from multiple 5-s response files through out the slew time plus single time preiod for the non-slew times, and weighted by the total counts in the corresponding time period using addrmf. An average response file is needed becuase a spectral fit using the pre-slew DRM will introduce some errors in both a spectral shape and a normalization if the PHA file contains a lot of the slew/post-slew time interval.
- 3) For fits to more complicated models (e.g. a power-law over a cutoff power-law), the BAT team has decided to require a chi-square improvement of more than 6 for each extra dof.
Time averaged spectrum fit using the average DRM
Power-law model

Time interval is from    0.792 sec. to   80.792 sec.

Spectral model in power-law:
------------------------------------------------------------
Parameters  : value       lower 90%   higher 90%
Photon index: -1.42763     ( -0.144572   0.145604 )
Norm@50keV  : 2.80069E-03    ( -0.000233281   0.000233244 )
------------------------------------------------------------
#Fit statistic  : Chi-Squared                   55.17     using 59 bins.
 Reduced chi-squared = 0.967895
# Null hypothesis probability of 5.44e-01 with 57 degrees of freedom

Photon flux (15-150 keV)    in 80 sec: 0.343280 ( -0.030555  0.030661 ) ph/cm2/s
Energy fluence (15-150 keV)             : 2.15338e-06 ( -1.90242e-07  1.91122e-07 ) ergs/cm2
Cutoff power-law model
Time interval is from    0.792 sec. to   80.792 sec.
Spectral model in the cutoff power-law:
------------------------------------------------------------
Parameters  : value       lower 90%   higher 90%
Photon index: -1.26956     ( -0.287454   0.594077 )
Epeak [keV] : 246.426      ( -246.447 -246.447 )
Norm@50keV  : 3.33819E-03    ( -0.000987823   0.003 )
------------------------------------------------------------
#Fit statistic  : Chi-Squared                   54.92     using 59 bins.
 Reduced chi-squared = 0.980714
# Null hypothesis probability of 5.16e-01 with 56 degrees of freedom

Photon flux (15-150 keV)    in 80 sec: 0.340937 ( -0.031552  0.031628 ) ph/cm2/s
Energy fluence (15-150 keV)             : 2.13521e-06 ( -2.02617e-07  1.99647e-07 ) ergs/cm2
1-s peak spectrum fit
Power-law model
Time interval is from    8.292 sec. to    9.292 sec.

Spectral model in power-law:
------------------------------------------------------------
Parameters  : value       lower 90%   higher 90%
Photon index: -1.97722     ( -2.92376   1.44531 )
Norm@50keV  : 2.82457E-03    ( -0.0027931   0.00270572 )
------------------------------------------------------------
#Fit statistic  : Chi-Squared                   79.65     using 59 bins.
 Reduced chi-squared = 1.39737
# Null hypothesis probability of 2.54e-02 with 57 degrees of freedom

Photon flux (15-150 keV)    in 1 sec: 0.419287 ( -0.351612  0.35201 ) ph/cm2/s
Energy fluence (15-150 keV)             : 2.54877e-08 ( -2.21015e-08  2.57147e-08 ) ergs/cm2
Cutoff power-law model
Time interval is from    8.292 sec. to    9.292 sec.
Spectral model in the cutoff power-law:
------------------------------------------------------------
Parameters  : value       lower 90%   higher 90%
Photon index: 9.98041     ( -9.0155   -9.99145 )
Epeak [keV] : 46.8002      ( -9.42537 10.7615 )
Norm@50keV  : 3341.90    ( -3332.21   36537.6 )
------------------------------------------------------------
#Fit statistic  : Chi-Squared                   75.00     using 59 bins.
 Reduced chi-squared = 1.33929
# Null hypothesis probability of 4.59e-02 with 56 degrees of freedom

Photon flux (15-150 keV)    in 1 sec:  (    ) ph/cm2/s
Energy fluence (15-150 keV)             : 2.46093e-08 ( -1.31331e-08  1.8481e-08 ) ergs/cm2
Time-resolved spectra
Distribution
T90 vs. Hardness ratio plot
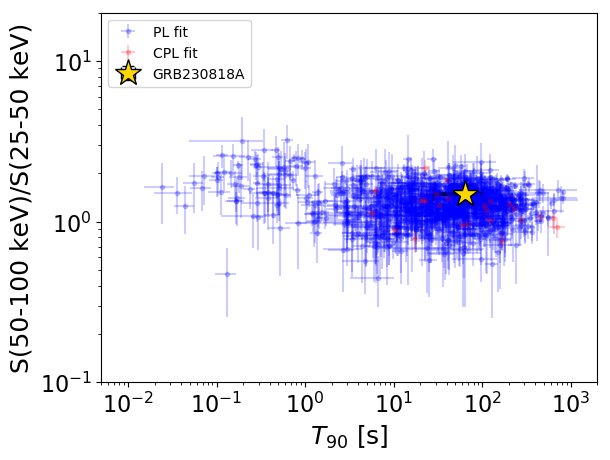
T90                                   = 64.0 sec.
Hardness ratio (energy fluence ratio) = 1.48699676487
S(15-50 keV) vs. S(50-150 keV) plot
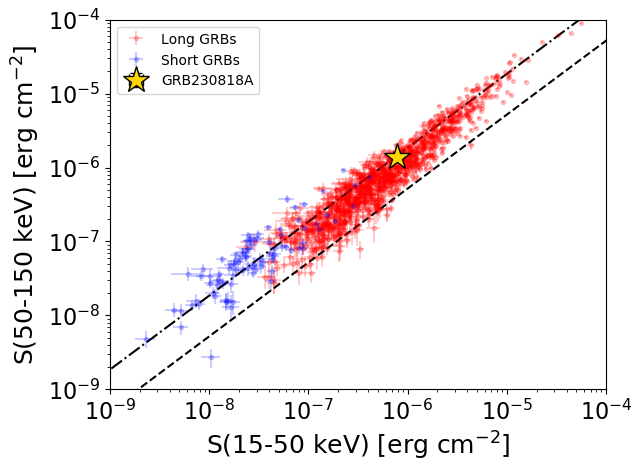
S(15-50 keV)  = 7.808252e-07
S(50-150 keV) = 1.3725582e-06
The dash-dotted line and the dashed line traces the fluences calculated from the Band function with Epeak = 15 and 150 keV, respectively. Both lines assume a canonical values of alpha = -1 and beta = -2.5.
Mask shadow pattern
IMX = -9.404514481017708E-01, IMY = 4.656208230364318E-01
Spacecraft aspect plot
Bright source in the pre-burst/pre-slew/post-slew images
Pre-burst image of 15-350 keV band
Time interval of the image:
-166.907400 0.792000

# RAcent  DECcent POSerr Theta    Phi  PeakCts   SNR AngSep     Name
#  [deg]    [deg]    ['] [deg]  [deg]                   [']
288.6711  11.0848  137.6  36.9  162.8  -0.0325  -0.1   11.2	GRS 1915+105
299.5883  35.1961    0.7  34.3 -151.8   5.8766  16.3    0.3	Cyg X-1
308.0720  40.9605    3.5  34.0 -136.1   1.1729   3.3    1.8	Cyg X-3
326.1230  38.4009    3.6  27.4 -111.4   1.0337   3.2    5.3	Cyg X-2
344.6885 -13.6238    2.4  30.6   32.1   1.8093   4.9 ------	UNKNOWN
350.1011  38.1510    2.7  34.5  -76.9   2.0888   4.3 ------	UNKNOWN
 17.3237  24.0253    3.0  50.0  -43.2   4.5569   3.9 ------	UNKNOWN
Pre-slew background subtracted image of 15-350 keV band
Time interval of the image:
0.792000 10.092590

# RAcent  DECcent POSerr Theta    Phi  PeakCts   SNR AngSep     Name
#  [deg]    [deg]    ['] [deg]  [deg]                   [']
288.7362  10.9321    9.7  36.9  162.6   0.0726   1.2    3.7	GRS 1915+105
299.5267  35.3358  404.1  34.4 -151.7  -0.0015  -0.0    8.6	Cyg X-1
308.0560  41.0073    7.8  34.0 -136.0   0.0932   1.5    4.1	Cyg X-3
326.0552  38.4525    9.2  27.4 -111.5   0.0703   1.3    9.6	Cyg X-2
278.5040   0.1095    2.0  48.8  149.3   0.8451   5.7 ------	UNKNOWN
272.5755   4.4987    2.8  53.6  156.4   0.9174   4.1 ------	UNKNOWN
306.4722  12.9716    2.8  19.5  166.7   0.1760   4.2 ------	UNKNOWN
285.8869  40.8865    0.5  46.4 -153.7   2.2683  24.7 ------	UNKNOWN
Post-slew image of 15-350 keV band
Time interval of the image:
123.492600 1040.923400

# RAcent  DECcent POSerr Theta    Phi  PeakCts   SNR AngSep     Name
#  [deg]    [deg]    ['] [deg]  [deg]                   [']
254.5583  35.2675    6.6  25.2 -137.0   2.4264   1.8    6.7	Her X-1
268.3180  -1.3451    6.7  45.2  160.9  -6.2211  -1.7    7.1	SW J1753.5-0127
289.0163  10.9408    0.0  30.1  129.6   3.7929   2.0   12.8	GRS 1915+105
299.5956  35.1990    0.4  12.2   69.1  33.4006  25.9    0.3	Cyg X-1
307.9533  40.8628    4.9  16.6   38.5   2.8512   2.4    8.9	Cyg X-3
326.2663  38.2785    5.5  30.9   37.1   4.0111   2.1    5.2	Cyg X-2
274.2374  -4.5876    2.3  46.7  151.8  20.4269   5.0 ------	UNKNOWN
345.0792  52.2415    2.6  41.0    8.9   9.0831   4.4 ------	UNKNOWN
 11.6025  55.9259    3.3  55.0   -1.3  11.8192   3.5 ------	UNKNOWN
346.8153  64.7587    2.6  41.5  -10.1   8.3282   4.4 ------	UNKNOWN
246.0969   3.1734    3.9  52.0 -170.1  10.1636   2.9 ------	UNKNOWN
274.7573  85.8093    3.1  45.0  -45.5  13.1583   3.7 ------	UNKNOWN