Analysis Summary
Notes:
- 1) No attempt has been made to eliminate the non-significant decimal places.
- 2) This batgrbproduct analysis is done using the HEASARC data.
- 3) This batgrbproduct analysis is using the flight position for the mask-weighting calculation.
======================================================================
BAT GRB EVENT DATA PROCESSING REPORT
Process Script Ver: batgrbproduct v2.48
Process Start Time: Fri Sep 29 23:24:33 EDT 2023
Host Name: batproc1
Current Working Dir: /local/data/bat1/alien/Swift_3rdBATcatalog/event/batevent_reproc/trigger1187463
======================================================================
Trigger: 01187463 Segment: 000
BAT Trigger Time: 714771198.976 [s; MET]
Trigger Stop: 714771200 [s; MET]
UTC: 2023-08-26T19:32:47.078920 [includes UTCF correction]
Where From?: TDRSS position message
BAT
RA: 83.0117437221934 Dec: 66.124903377032 [deg; J2000]
Catalogged Source?: NO
Point Source?: YES
GRB Indicated?: YES [ by BAT flight software ]
Image S/N Ratio: 15.04
Image Trigger?: NO
Rate S/N Ratio: 45.902069670114 [ if not an image trigger ]
Image S/N Ratio: 15.04
Analysis Position: [ source = BAT ]
RA: 83.0117437221934 Dec: 66.124903377032 [deg; J2000]
Refined Position: [ source = BAT pre-slew burst ]
RA: 83.049639325098 Dec: 66.1248572518743 [deg; J2000]
{ 05h 32m 11.9s , +66d 07' 29.5" }
+/- 0.6182241087203 [arcmin] (estimated 90% radius based on SNR)
+/- 0.192837617292267 [arcmin] (formal 1-sigma fit error)
SNR: 60.4618354446474
Angular difference between the analysis and refined position is 0.920286 arcmin
Partial Coding Fraction: 0.875 [ including projection effects ]
Duration
T90: 40.8399999141693 +/- 1.65832214332882
Measured from: -2.75199997425079
to: 38.0879999399185 [s; relative to TRIGTIME]
T50: 12.1879999637604 +/- 0.865572549812708
Measured from: 1.95600008964539
to: 14.1440000534058 [s; relative to TRIGTIME]
Fluence
Peak Flux (peak 1 second)
Measured from: 2.43599998950958
to: 3.43599998950958 [s; relative to TRIGTIME]
Total Fluence
Measured from: -6.31199991703033
to: 47.4800000190735 [s; relative to TRIGTIME]
Band 1 Band 2 Band 3 Band 4
15-25 25-50 50-100 100-350 keV
Total 1.682061 2.375795 1.714021 0.390432
0.048673 0.051504 0.044676 0.035144 [error]
Peak 0.079874 0.158113 0.118059 0.028862
0.007585 0.008988 0.008368 0.005867 [error]
[ fluence units of on-axis counts / fully illuminated detector ]
======================================================================
====== Table of the duration information =============================
Value tstart tstop
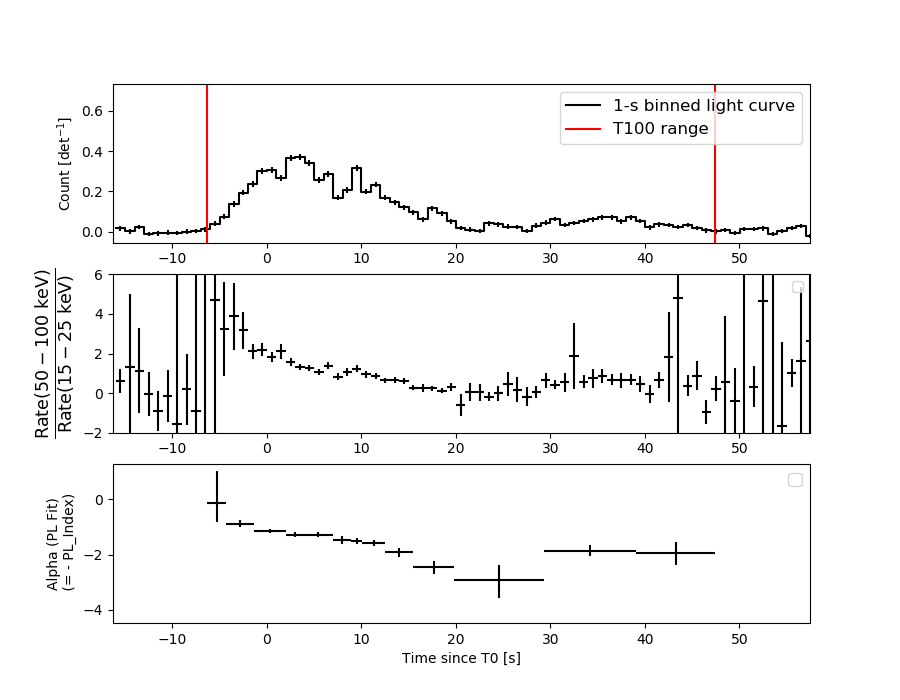
T100 53.792 -6.312 47.480
T90 40.840 -2.752 38.088
T50 12.188 1.956 14.144
Peak 1.000 2.436 3.436
====== Spectral Analysis Summary =====================================
Model : spectral model: simple power-law (PL) and cutoff power-law (CPL)
Ph_index : photon index: E^{Ph_index}
Ph_90err : 90% error of the photon index
Epeak : Epeak in keV
Epeak_90err: 90% error of Epeak
Norm : normalization at 50 keV in both the PL model and CPL model
Nomr_90err : 90% error of the normalization
chi2 : Chi-Squared
dof : degree of freedo
=== Time-averaged spectral analysis ===
(Best model with acceptable fit: CPL)
Model Ph_index Ph_90err_low Ph_90err_hi Epeak Epeak_90err_low Epeak_90err_hi Norm Nomr_90err_low Norm_90err_hi chi2 dof
PL -1.520 -0.052 0.052 - - - 7.34e-03 -2.04e-04 2.03e-04 59.780 57
CPL -1.215 -0.207 0.217 136.965 -35.712 161.221 1.02e-02 -2.00e-03 2.63e-03 53.300 56
=== 1-s peak spectral analysis ===
(Best model with acceptable fit: CPL)
Model Ph_index Ph_90err_low Ph_90err_hi Epeak Epeak_90err_low Epeak_90err_hi Norm Nomr_90err_low Norm_90err_hi chi2 dof
PL -1.230 -0.108 0.108 - - - 2.53e-02 -1.71e-03 1.70e-03 57.000 57
CPL -0.235 -0.511 0.589 88.509 -16.906 42.198 8.11e-02 -3.59e-02 7.87e-02 44.590 56
=== Fluence/Peak Flux Summary ===
Model Band1 Band2 Band3 Band4 Band5 Total
15-25 25-50 50-100 100-350 15-150 15-350 keV
Fluence PL 5.14e-07 9.32e-07 1.30e-06 3.79e-06 3.73e-06 6.53e-06 erg/cm2
90%_error_low -2.75e-08 -2.92e-08 -4.56e-08 -2.93e-07 -1.10e-07 -3.21e-07 erg/cm2
90%_error_hi 2.81e-08 2.91e-08 4.55e-08 3.10e-07 1.10e-07 3.34e-07 erg/cm2
Peak flux PL 8.05e-01 9.51e-01 8.11e-01 1.17e+00 2.98e+00 3.74e+00 ph/cm2/s
90%_error_low -9.21e-02 -7.03e-02 -6.51e-02 -1.80e-01 -2.01e-01 -2.69e-01 ph/cm2/s
90%_error_hi 9.51e-02 6.99e-02 6.48e-02 1.99e-01 2.02e-01 2.72e-01 ph/cm2/s
Fluence CPL 4.80e-07 9.51e-07 1.33e-06 2.50e-06 3.65e-06 5.26e-06 erg/cm2
90%_error_low -3.49e-08 -3.22e-08 -5.00e-08 -5.80e-07 -1.24e-07 -5.89e-07 erg/cm2
90%_error_hi 3.55e-08 3.24e-08 5.04e-08 7.95e-07 1.24e-07 7.97e-07 erg/cm2
Peak flux CPL 6.79e-01 1.05e+00 8.77e-01 4.30e-01 2.89e+00 3.04e+00 ph/cm2/s
90%_error_low -1.09e-01 -8.88e-02 -7.67e-02 -1.65e-01 -2.09e-01 -2.64e-01 ph/cm2/s
90%_error_hi 1.12e-01 9.15e-02 7.78e-02 2.62e-01 2.08e-01 3.11e-01 ph/cm2/s
======================================================================
Image
Pre-slew 15.0-350.0 keV image (Event data)
#   RAcent    DECcent   POSerr    Theta     Phi              Peak Cts       SNR   Name
   83.0496    66.1249   0.0032    15.6548    46.2238         4.7220723     60.462 TRIG_01187463

Foreground time interval of the image:
 -6.312  13.325 (delta_t =  19.637 [sec])
Background time interval of the image:
-239.976  -6.312 (delta_t = 233.664 [sec])
Light Curves
Note: The mask-weighted lightcurves have units of either count/det or counts/sec/det, where a det is 0.4 x 0.4 = 0.16 sq cm.
Full-time range; 1 s binning
Other quick-look light curves:
- 64 ms binning (zoomed)
- 16 ms binning (zoomed)
- 8 ms binning (zoomed)
- 2 ms binning (zoomed)
- SN=5 or 10 s binning (full-time range)
- Raw light curve
Spectra
- 64 ms binning (zoomed)
- 16 ms binning (zoomed)
- 8 ms binning (zoomed)
- 2 ms binning (zoomed)
- SN=5 or 10 s binning (full-time range)
- Raw light curve
Spectra
Notes:
- 1) The fitting includes the systematic errors.
- 2) When the burst includes telescope slew time periods, the fitting uses an average response file made from multiple 5-s response files through out the slew time plus single time preiod for the non-slew times, and weighted by the total counts in the corresponding time period using addrmf. An average response file is needed becuase a spectral fit using the pre-slew DRM will introduce some errors in both a spectral shape and a normalization if the PHA file contains a lot of the slew/post-slew time interval.
- 3) For fits to more complicated models (e.g. a power-law over a cutoff power-law), the BAT team has decided to require a chi-square improvement of more than 6 for each extra dof.
Time averaged spectrum fit using the average DRM
Power-law model
Time interval is from   -6.312 sec. to   47.480 sec.

Spectral model in power-law:
------------------------------------------------------------
Parameters  : value       lower 90%   higher 90%
Photon index: -1.52049     ( -0.0522866   0.0522357 )
Norm@50keV  : 7.33766E-03    ( -0.000203507   0.000203461 )
------------------------------------------------------------
#Fit statistic  : Chi-Squared                   59.78     using 59 bins.
 Reduced chi-squared = 1.04877
# Null hypothesis probability of 3.75e-01 with 57 degrees of freedom

Photon flux (15-150 keV)    in 53.79 sec: 0.921191 ( -0.027714  0.027787 ) ph/cm2/s
Energy fluence (15-150 keV)             : 3.73251e-06 ( -1.10239e-07  1.10495e-07 ) ergs/cm2
Cutoff power-law model
Time interval is from   -6.312 sec. to   47.480 sec.
Spectral model in the cutoff power-law:
------------------------------------------------------------
Parameters  : value       lower 90%   higher 90%
Photon index: -1.21479     ( -0.207147   0.217435 )
Epeak [keV] : 136.965      ( -35.7123 161.221 )
Norm@50keV  : 1.02161E-02    ( -0.00200262   0.0026341 )
------------------------------------------------------------
#Fit statistic  : Chi-Squared                   53.30     using 59 bins.
 Reduced chi-squared = 0.951786
# Null hypothesis probability of 5.78e-01 with 56 degrees of freedom

Photon flux (15-150 keV)    in 53.79 sec: 0.901297 ( -0.030498  0.030588 ) ph/cm2/s
Energy fluence (15-150 keV)             : 3.64848e-06 ( -1.24352e-07  1.23954e-07 ) ergs/cm2
1-s peak spectrum fit
Power-law model
Time interval is from    2.436 sec. to    3.436 sec.

Spectral model in power-law:
------------------------------------------------------------
Parameters  : value       lower 90%   higher 90%
Photon index: -1.22983     ( -0.107993   0.108258 )
Norm@50keV  : 2.53140E-02    ( -0.00170553   0.00170429 )
------------------------------------------------------------
#Fit statistic  : Chi-Squared                   57.00     using 59 bins.
 Reduced chi-squared = 1
# Null hypothesis probability of 4.75e-01 with 57 degrees of freedom

Photon flux (15-150 keV)    in 1 sec: 2.98445 ( -0.20147  0.20154 ) ph/cm2/s
Energy fluence (15-150 keV)             : 2.54736e-07 ( -1.9372e-08  1.95161e-08 ) ergs/cm2
Cutoff power-law model
Time interval is from    2.436 sec. to    3.436 sec.
Spectral model in the cutoff power-law:
------------------------------------------------------------
Parameters  : value       lower 90%   higher 90%
Photon index: -0.234942     ( -0.510534   0.589257 )
Epeak [keV] : 88.5089      ( -16.9041 42.1998 )
Norm@50keV  : 8.10734E-02    ( -0.0359158   0.0786656 )
------------------------------------------------------------
#Fit statistic  : Chi-Squared                   44.59     using 59 bins.
 Reduced chi-squared = 0.79625
# Null hypothesis probability of 8.64e-01 with 56 degrees of freedom

Photon flux (15-150 keV)    in 1 sec: 2.89044 ( -0.20886  0.20786 ) ph/cm2/s
Energy fluence (15-150 keV)             : 2.35879e-07 ( -2.21025e-08  2.21093e-08 ) ergs/cm2
Time-resolved spectra
Distribution
T90 vs. Hardness ratio plot
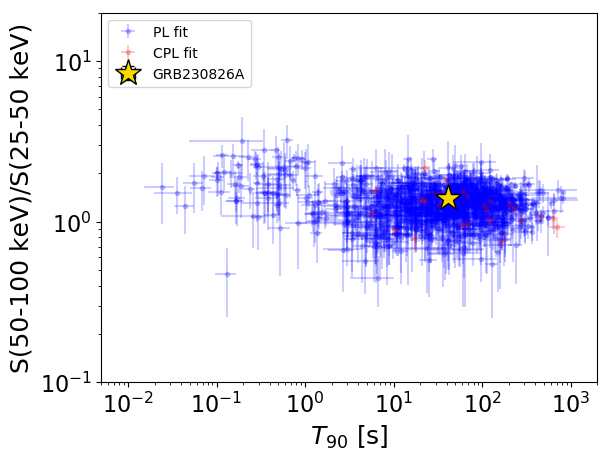
T90                                   = 40.84 sec.
Hardness ratio (energy fluence ratio) = 1.39601491752
S(15-50 keV) vs. S(50-150 keV) plot
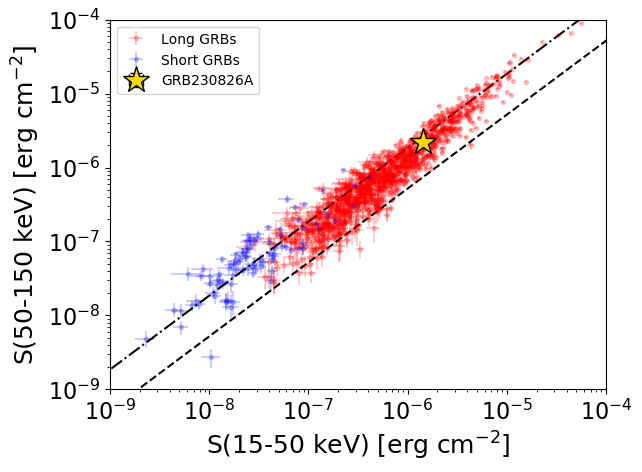
S(15-50 keV)  = 1.4309767e-06
S(50-150 keV) = 2.2175008e-06
The dash-dotted line and the dashed line traces the fluences calculated from the Band function with Epeak = 15 and 150 keV, respectively. Both lines assume a canonical values of alpha = -1 and beta = -2.5.
Mask shadow pattern

IMX = 1.938793204284003E-01, IMY = -2.023434344718492E-01
Spacecraft aspect plot
Bright source in the pre-burst/pre-slew/post-slew images
Pre-burst image of 15-350 keV band
Time interval of the image:
-239.976000 -6.312000

# RAcent  DECcent POSerr Theta    Phi  PeakCts   SNR AngSep     Name
#  [deg]    [deg]    ['] [deg]  [deg]                   [']
 83.6146  22.0309    1.5  54.3    1.6   8.0728   7.4    1.4	Crab
 34.3495  64.0310    3.9  32.0   77.2   2.0291   2.9 ------	UNKNOWN
136.3386  48.1186    3.3  23.3  -66.9   1.3384   3.5 ------	UNKNOWN
Pre-slew background subtracted image of 15-350 keV band
Time interval of the image:
-6.312000 13.324600

# RAcent  DECcent POSerr Theta    Phi  PeakCts   SNR AngSep     Name
#  [deg]    [deg]    ['] [deg]  [deg]                   [']
 83.6882  21.8462    0.0  54.4    1.4   0.6274   1.8   10.5	Crab
254.3482  64.6411    3.2  40.2  163.6   0.4714   3.6 ------	UNKNOWN
 83.0497  66.1248    0.2  15.7   46.2   4.7223  60.5 ------	UNKNOWN
127.7589  22.8597    2.6  47.9  -50.9   1.4286   4.4 ------	UNKNOWN
164.0996  35.2941    3.2  41.1  -99.1   1.1724   3.6 ------	UNKNOWN
132.9889  25.3293    3.8  45.7  -57.6   1.0401   3.1 ------	UNKNOWN
Post-slew image of 15-350 keV band
Time interval of the image:
61.724600 962.072300
1001.024000 1091.064000

# RAcent  DECcent POSerr Theta    Phi  PeakCts   SNR AngSep     Name
#  [deg]    [deg]    ['] [deg]  [deg]                   [']
 83.6066  22.0277    0.8  44.1  -12.8  37.0084  14.1    1.7	Crab
333.0297  68.2769    2.6  37.0  132.7  14.4411   4.4 ------	UNKNOWN
 40.8020  61.4735    2.2  18.8   83.8   8.4474   5.2 ------	UNKNOWN
 62.2305  46.9493    2.8  22.1   28.1   6.8658   4.1 ------	UNKNOWN
112.2560  48.3853    3.2  23.3  -67.0   6.2779   3.7 ------	UNKNOWN
157.8090  60.2094    2.9  32.2 -127.8   7.4256   4.0 ------	UNKNOWN