Analysis Summary
Notes:
- 1) No attempt has been made to eliminate the non-significant decimal places.
- 2) This batgrbproduct analysis is done using the HEASARC data.
- 3) This batgrbproduct analysis is using the flight position for the mask-weighting calculation.
======================================================================
BAT GRB EVENT DATA PROCESSING REPORT
Process Script Ver: batgrbproduct v2.48
Process Start Time: Fri Sep 29 23:23:01 EDT 2023
Host Name: batproc1
Current Working Dir: /local/data/bat1/alien/Swift_3rdBATcatalog/event/batevent_reproc/trigger1189514
======================================================================
Trigger: 01189514 Segment: 000
BAT Trigger Time: 715454608.192 [s; MET]
Trigger Stop: 715454610.24 [s; MET]
UTC: 2023-09-03T17:22:56.248260 [includes UTCF correction]
Where From?: TDRSS position message
BAT
RA: 9.92619753724725 Dec: -40.9238279211701 [deg; J2000]
Catalogged Source?: NO
Point Source?: YES
GRB Indicated?: YES [ by BAT flight software ]
Image S/N Ratio: 7.63
Image Trigger?: NO
Rate S/N Ratio: 11.6619037896906 [ if not an image trigger ]
Image S/N Ratio: 7.63
Analysis Position: [ source = BAT ]
RA: 9.92619753724725 Dec: -40.9238279211701 [deg; J2000]
Refined Position: [ source = BAT pre-slew burst ]
RA: 9.897540336889 Dec: -40.9088789038754 [deg; J2000]
{ 00h 39m 35.4s , -40d 54' 32.0" }
+/- 1.85317230060731 [arcmin] (estimated 90% radius based on SNR)
+/- 0.624442800687011 [arcmin] (formal 1-sigma fit error)
SNR: 12.6003184888947
Angular difference between the analysis and refined position is 1.578838 arcmin
Partial Coding Fraction: 0.40625 [ including projection effects ]
Duration
T90: 2.53599989414215 +/- 0.269429022393487
Measured from: 0.276000022888184
to: 2.81199991703033 [s; relative to TRIGTIME]
T50: 1.57999992370605 +/- 0.544249932404332
Measured from: 0.679999947547913
to: 2.25999987125397 [s; relative to TRIGTIME]
Fluence
Peak Flux (peak 1 second)
Measured from: 0.495999932289124
to: 1.49599993228912 [s; relative to TRIGTIME]
Total Fluence
Measured from: 0.195999979972839
to: 2.93199992179871 [s; relative to TRIGTIME]
Band 1 Band 2 Band 3 Band 4
15-25 25-50 50-100 100-350 keV
Total 0.080541 0.160312 0.111503 0.027623
0.016930 0.017991 0.016133 0.013339 [error]
Peak 0.039378 0.068104 0.051960 0.015583
0.010591 0.010974 0.010193 0.008028 [error]
[ fluence units of on-axis counts / fully illuminated detector ]
======================================================================
====== Table of the duration information =============================
Value tstart tstop
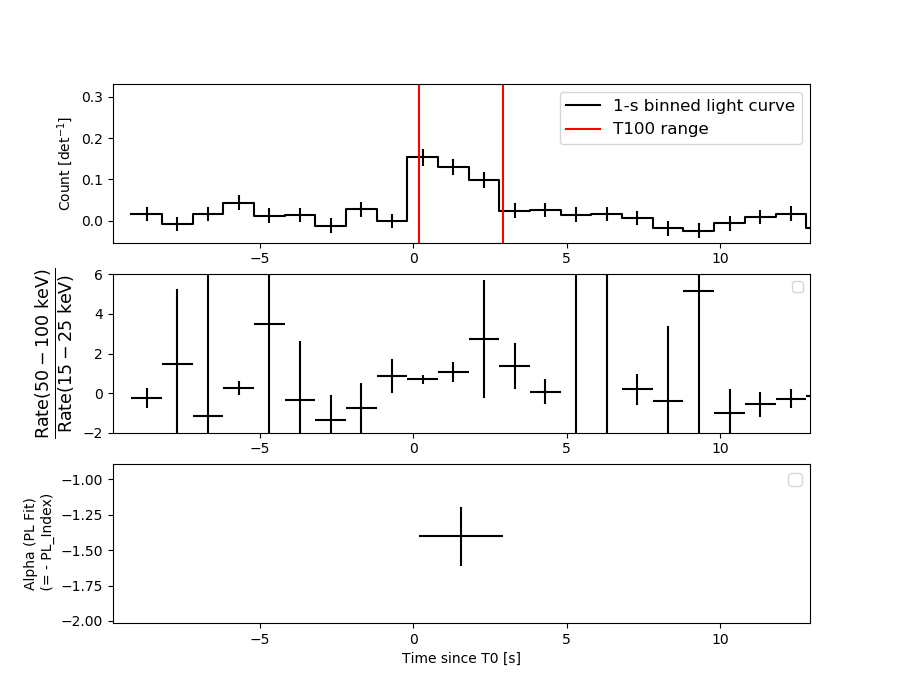
T100 2.736 0.196 2.932
T90 2.536 0.276 2.812
T50 1.580 0.680 2.260
Peak 1.000 0.496 1.496
====== Spectral Analysis Summary =====================================
Model : spectral model: simple power-law (PL) and cutoff power-law (CPL)
Ph_index : photon index: E^{Ph_index}
Ph_90err : 90% error of the photon index
Epeak : Epeak in keV
Epeak_90err: 90% error of Epeak
Norm : normalization at 50 keV in both the PL model and CPL model
Nomr_90err : 90% error of the normalization
chi2 : Chi-Squared
dof : degree of freedo
=== Time-averaged spectral analysis ===
(Best model with acceptable fit: PL)
Model Ph_index Ph_90err_low Ph_90err_hi Epeak Epeak_90err_low Epeak_90err_hi Norm Nomr_90err_low Norm_90err_hi chi2 dof
PL -1.401 -0.210 0.209 - - - 9.21e-03 -1.27e-03 1.26e-03 54.650 57
CPL 0.678 -1.221 1.772 63.179 -10.648 24.407 1.05e-01 -1.05e-01 6.93e-01 44.260 56
=== 1-s peak spectral analysis ===
(Best model with acceptable fit: PL)
Model Ph_index Ph_90err_low Ph_90err_hi Epeak Epeak_90err_low Epeak_90err_hi Norm Nomr_90err_low Norm_90err_hi chi2 dof
PL -1.444 -0.291 0.287 - - - 1.07e-02 -2.11e-03 2.10e-03 63.400 57
CPL 0.611 -1.507 2.466 61.212 -13.450 42.017 1.24e-01 -1.24e-01 2.14e+00 57.220 56
=== Fluence/Peak Flux Summary ===
Model Band1 Band2 Band3 Band4 Band5 Total
15-25 25-50 50-100 100-350 15-150 15-350 keV
Fluence PL 2.93e-08 5.73e-08 8.67e-08 2.85e-07 2.43e-07 4.58e-07 erg/cm2
90%_error_low -6.23e-09 -8.19e-09 -1.46e-08 -8.73e-08 -3.64e-08 -1.02e-07 erg/cm2
90%_error_hi 6.56e-09 8.13e-09 1.46e-08 1.09e-07 3.68e-08 1.19e-07 erg/cm2
Peak flux PL 4.17e-01 4.34e-01 3.19e-01 3.78e-01 1.32e+00 1.55e+00 ph/cm2/s
90%_error_low -1.22e-01 -8.91e-02 -7.45e-02 -1.46e-01 -2.57e-01 -3.04e-01 ph/cm2/s
90%_error_hi 1.32e-01 8.84e-02 7.41e-02 1.89e-01 2.58e-01 3.07e-01 ph/cm2/s
Fluence CPL 2.09e-08 7.00e-08 9.50e-08 3.64e-08 2.15e-07 2.22e-07 erg/cm2
90%_error_low -7.67e-09 -1.13e-08 -1.92e-08 -2.57e-08 -3.79e-08 -4.43e-08 erg/cm2
90%_error_hi 8.03e-09 1.20e-08 1.85e-08 6.56e-08 4.01e-08 7.03e-08 erg/cm2
Peak flux CPL 3.01e-01 5.31e-01 3.62e-01 7.05e-02 1.25e+00 1.26e+00 ph/cm2/s
90%_error_low -1.43e-01 -1.19e-01 -1.02e-01 -7.05e-02 -2.63e-01 -2.71e-01 ph/cm2/s
90%_error_hi 1.55e-01 1.28e-01 9.77e-02 1.60e-01 2.64e-01 2.85e-01 ph/cm2/s
======================================================================
Image
Pre-slew 15.0-350.0 keV image (Event data)
#   RAcent    DECcent   POSerr    Theta     Phi              Peak Cts       SNR   Name
    9.8975   -40.9089   0.0153    28.6584    93.7422         0.4120037     12.600 TRIG_01189514

Foreground time interval of the image:
  0.196   2.932 (delta_t =   2.736 [sec])
Background time interval of the image:
-344.192 -254.138 (delta_t =  90.054 [sec])
-239.192   0.196 (delta_t = 239.388 [sec])
Light Curves
Note: The mask-weighted lightcurves have units of either count/det or counts/sec/det, where a det is 0.4 x 0.4 = 0.16 sq cm.
Full-time range; 1 s binning
Other quick-look light curves:
- 64 ms binning (zoomed)
- 16 ms binning (zoomed)
- 8 ms binning (zoomed)
- 2 ms binning (zoomed)
- SN=5 or 10 s binning (full-time range)
- Raw light curve
Spectra
- 64 ms binning (zoomed)
- 16 ms binning (zoomed)
- 8 ms binning (zoomed)
- 2 ms binning (zoomed)
- SN=5 or 10 s binning (full-time range)
- Raw light curve
Spectra
Notes:
- 1) The fitting includes the systematic errors.
- 2) When the burst includes telescope slew time periods, the fitting uses an average response file made from multiple 5-s response files through out the slew time plus single time preiod for the non-slew times, and weighted by the total counts in the corresponding time period using addrmf. An average response file is needed becuase a spectral fit using the pre-slew DRM will introduce some errors in both a spectral shape and a normalization if the PHA file contains a lot of the slew/post-slew time interval.
- 3) For fits to more complicated models (e.g. a power-law over a cutoff power-law), the BAT team has decided to require a chi-square improvement of more than 6 for each extra dof.
Time averaged spectrum fit using the average DRM
Power-law model
Time interval is from    0.196 sec. to    2.932 sec.

Spectral model in power-law:
------------------------------------------------------------
Parameters  : value       lower 90%   higher 90%
Photon index: -1.40144     ( -0.210199   0.209397 )
Norm@50keV  : 9.21022E-03    ( -0.00126762   0.0012641 )
------------------------------------------------------------
#Fit statistic  : Chi-Squared                   54.65     using 59 bins.
 Reduced chi-squared = 0.958772
# Null hypothesis probability of 5.64e-01 with 57 degrees of freedom

Photon flux (15-150 keV)    in 2.736 sec: 1.12203 ( -0.154298  0.15456 ) ph/cm2/s
Energy fluence (15-150 keV)             : 2.43442e-07 ( -3.63967e-08  3.6782e-08 ) ergs/cm2
Cutoff power-law model
Time interval is from    0.196 sec. to    2.932 sec.
Spectral model in the cutoff power-law:
------------------------------------------------------------
Parameters  : value       lower 90%   higher 90%
Photon index: 0.677504     ( -1.22073   1.77143 )
Epeak [keV] : 63.1787      ( -10.6464 24.4082 )
Norm@50keV  : 0.104702    ( -0.104718   0.692852 )
------------------------------------------------------------
#Fit statistic  : Chi-Squared                   44.26     using 59 bins.
 Reduced chi-squared = 0.790357
# Null hypothesis probability of 8.72e-01 with 56 degrees of freedom

Photon flux (15-150 keV)    in 2.736 sec: 1.05189 ( -0.161075  0.16068 ) ph/cm2/s
Energy fluence (15-150 keV)             : 2.14633e-07 ( -3.79453e-08  4.00829e-08 ) ergs/cm2
1-s peak spectrum fit
Power-law model
Time interval is from    0.496 sec. to    1.496 sec.

Spectral model in power-law:
------------------------------------------------------------
Parameters  : value       lower 90%   higher 90%
Photon index: -1.44404     ( -0.291337   0.286498 )
Norm@50keV  : 1.07037E-02    ( -0.00210759   0.00209862 )
------------------------------------------------------------
#Fit statistic  : Chi-Squared                   63.40     using 59 bins.
 Reduced chi-squared = 1.11228
# Null hypothesis probability of 2.61e-01 with 57 degrees of freedom

Photon flux (15-150 keV)    in 1 sec: 1.31709 ( -0.25746  0.25794 ) ph/cm2/s
Energy fluence (15-150 keV)             : 1.0257e-07 ( -2.16436e-08  2.19331e-08 ) ergs/cm2
Cutoff power-law model
Time interval is from    0.496 sec. to    1.496 sec.
Spectral model in the cutoff power-law:
------------------------------------------------------------
Parameters  : value       lower 90%   higher 90%
Photon index: 0.610635     ( -1.51318   2.4589 )
Epeak [keV] : 61.2124      ( -13.3617 42.1045 )
Norm@50keV  : 0.124388    ( -0.125894   2.14179 )
------------------------------------------------------------
#Fit statistic  : Chi-Squared                   57.22     using 59 bins.
 Reduced chi-squared = 1.02179
# Null hypothesis probability of 4.30e-01 with 56 degrees of freedom

Photon flux (15-150 keV)    in 1 sec: 1.25430 ( -0.263157  0.26357 ) ph/cm2/s
Energy fluence (15-150 keV)             : 9.12935e-08 ( -2.21868e-08  2.38448e-08 ) ergs/cm2
Time-resolved spectra
Distribution
T90 vs. Hardness ratio plot
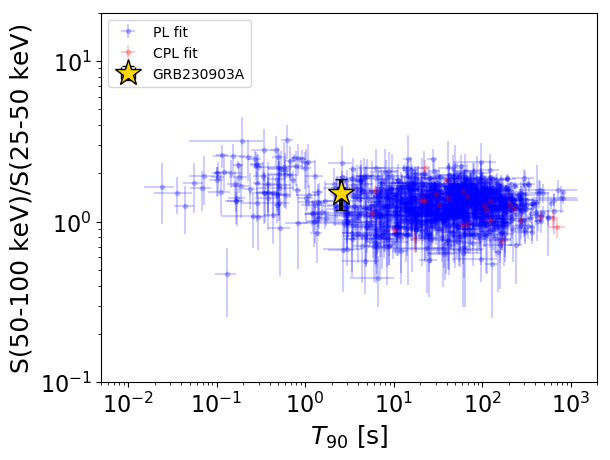
T90                                   = 2.536 sec.
Hardness ratio (energy fluence ratio) = 1.51411922278
S(15-50 keV) vs. S(50-150 keV) plot
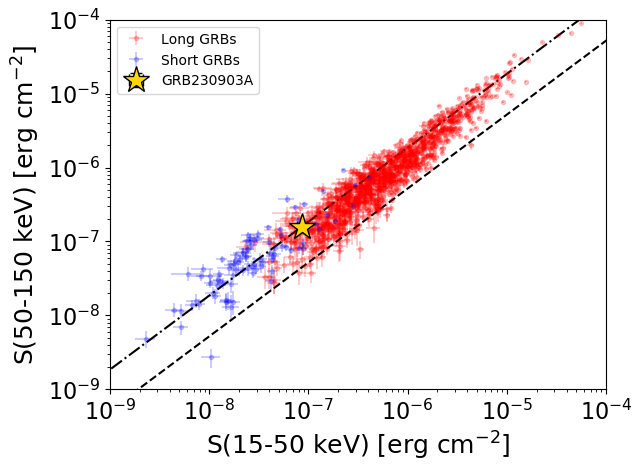
S(15-50 keV)  = 8.660901e-08
S(50-150 keV) = 1.5683614e-07
The dash-dotted line and the dashed line traces the fluences calculated from the Band function with Epeak = 15 and 150 keV, respectively. Both lines assume a canonical values of alpha = -1 and beta = -2.5.
Mask shadow pattern
IMX = -3.567144706682876E-02, IMY = -5.453748491462346E-01
Spacecraft aspect plot
Bright source in the pre-burst/pre-slew/post-slew images
Pre-burst image of 15-350 keV band
Time interval of the image:
-344.192000 -254.138200
-239.192000 0.196000

# RAcent  DECcent POSerr Theta    Phi  PeakCts   SNR AngSep     Name
#  [deg]    [deg]    ['] [deg]  [deg]                   [']
298.4262 -62.6125    2.7  43.5   13.3   3.6914   4.2 ------	UNKNOWN
191.4203 -84.6742    2.6  33.1  -32.1   2.6472   4.5 ------	UNKNOWN
 81.4884 -25.7539    3.0  44.2 -153.3   3.1476   3.9 ------	UNKNOWN
123.5538 -64.0929    2.7  34.4  -76.7   3.4448   4.3 ------	UNKNOWN
100.9292 -30.9553    2.3  48.0 -129.0  10.4959   5.2 ------	UNKNOWN
Pre-slew background subtracted image of 15-350 keV band
Time interval of the image:
0.196000 2.932000

# RAcent  DECcent POSerr Theta    Phi  PeakCts   SNR AngSep     Name
#  [deg]    [deg]    ['] [deg]  [deg]                   [']
  9.8975 -40.9089    0.9  28.7   93.7   0.4121  12.6 ------	UNKNOWN
 69.9783  -8.7153    2.6  56.5 -174.4   0.3447   4.5 ------	UNKNOWN
171.3015 -81.5121    2.3  34.3  -38.9   0.1280   5.1 ------	UNKNOWN
101.2771 -35.0241    2.3  44.8 -125.6   0.3295   4.9 ------	UNKNOWN
Post-slew image of 15-350 keV band
Time interval of the image:
94.908590 961.808600

# RAcent  DECcent POSerr Theta    Phi  PeakCts   SNR AngSep     Name
#  [deg]    [deg]    ['] [deg]  [deg]                   [']
345.9990 -33.1766    2.6  20.5   58.5   5.3695   4.3 ------	UNKNOWN
308.2330 -47.7598    2.6  43.4   13.3   9.0753   4.4 ------	UNKNOWN
345.1778 -71.6926    2.4  33.1  -32.1   6.4403   4.8 ------	UNKNOWN
342.8014 -75.5913    2.5  36.7  -35.1   6.7678   4.7 ------	UNKNOWN