Analysis Summary
Notes:
- 1) No attempt has been made to eliminate the non-significant decimal places.
- 2) This batgrbproduct analysis is done using the HEASARC data.
- 3) This batgrbproduct analysis is using the flight position for the mask-weighting calculation.
======================================================================
BAT GRB EVENT DATA PROCESSING REPORT
Process Script Ver: batgrbproduct v2.48
Process Start Time: Fri Sep 29 23:21:16 EDT 2023
Host Name: batproc1
Current Working Dir: /local/data/bat1/alien/Swift_3rdBATcatalog/event/batevent_reproc/trigger1191188
======================================================================
Trigger: 01191188 Segment: 000
BAT Trigger Time: 716114877.504 [s; MET]
Trigger Stop: 716114883.008 [s; MET]
UTC: 2023-09-11T08:47:25.515160 [includes UTCF correction]
Where From?: TDRSS position message
BAT
RA: 226.782406715387 Dec: -41.333950377554 [deg; J2000]
Catalogged Source?: NO
Point Source?: YES
GRB Indicated?: YES [ by BAT flight software ]
Image S/N Ratio: 6.76
Image Trigger?: NO
Rate S/N Ratio: 12.0830459735946 [ if not an image trigger ]
Image S/N Ratio: 6.76
Analysis Position: [ source = BAT ]
RA: 226.782406715387 Dec: -41.333950377554 [deg; J2000]
Refined Position: [ source = BAT pre-slew burst ]
RA: 226.801297792971 Dec: -41.3525978390595 [deg; J2000]
{ 15h 07m 12.3s , -41d 21' 09.4" }
+/- 1.86995487563614 [arcmin] (estimated 90% radius based on SNR)
+/- 0.812551483805578 [arcmin] (formal 1-sigma fit error)
SNR: 12.4390782304136
Angular difference between the analysis and refined position is 1.405690 arcmin
Partial Coding Fraction: 0.953125 [ including projection effects ]
Duration
T90: 14.4879999160767 +/- 2.858812227342
Measured from: -7.37599992752075
to: 7.11199998855591 [s; relative to TRIGTIME]
T50: 6.35599994659424 +/- 3.06790418265246
Measured from: -2.65599989891052
to: 3.70000004768372 [s; relative to TRIGTIME]
Fluence
Peak Flux (peak 1 second)
Measured from: 2.07200002670288
to: 3.07200002670288 [s; relative to TRIGTIME]
Total Fluence
Measured from: -8.63199996948242
to: 9.58400011062622 [s; relative to TRIGTIME]
Band 1 Band 2 Band 3 Band 4
15-25 25-50 50-100 100-350 keV
Total 0.175461 0.191859 0.195676 0.059233
0.032745 0.031112 0.025829 0.022245 [error]
Peak 0.034609 0.026979 0.020566 0.010136
0.008076 0.007566 0.006299 0.005322 [error]
[ fluence units of on-axis counts / fully illuminated detector ]
======================================================================
====== Table of the duration information =============================
Value tstart tstop
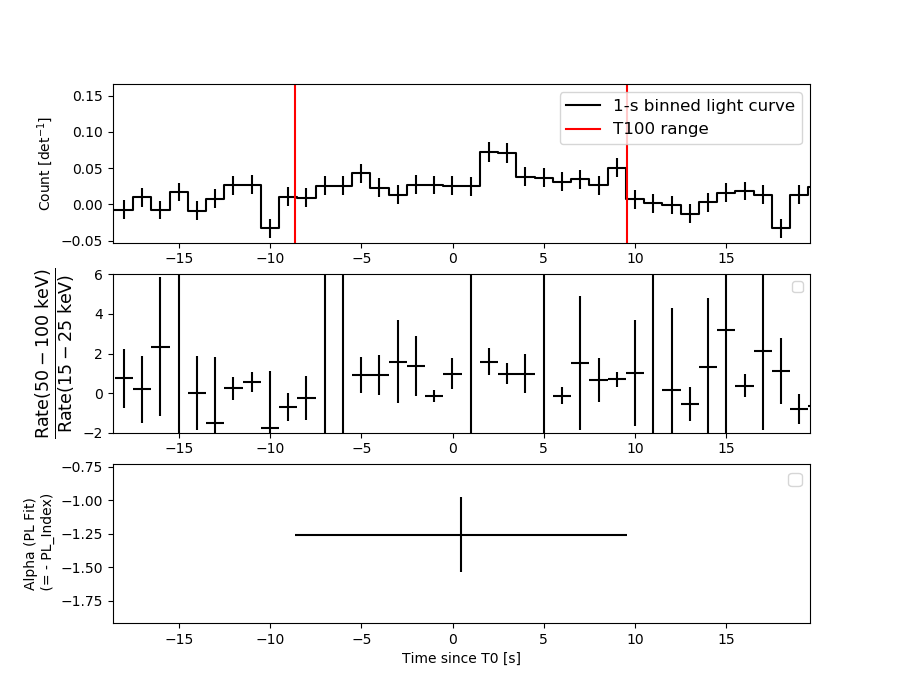
T100 18.216 -8.632 9.584
T90 14.488 -7.376 7.112
T50 6.356 -2.656 3.700
Peak 1.000 2.072 3.072
====== Spectral Analysis Summary =====================================
Model : spectral model: simple power-law (PL) and cutoff power-law (CPL)
Ph_index : photon index: E^{Ph_index}
Ph_90err : 90% error of the photon index
Epeak : Epeak in keV
Epeak_90err: 90% error of Epeak
Norm : normalization at 50 keV in both the PL model and CPL model
Nomr_90err : 90% error of the normalization
chi2 : Chi-Squared
dof : degree of freedo
=== Time-averaged spectral analysis ===
(Best model with acceptable fit: PL)
Model Ph_index Ph_90err_low Ph_90err_hi Epeak Epeak_90err_low Epeak_90err_hi Norm Nomr_90err_low Norm_90err_hi chi2 dof
PL -1.260 -0.273 0.282 - - - 2.09e-03 -3.09e-04 3.09e-04 56.280 57
CPL -1.221 -1.937 0.843 958.582 -958.582 -958.582 2.20e-03 -4.04e-04 -2.20e-03 56.340 56
=== 1-s peak spectral analysis ===
(Best model with acceptable fit: PL)
Model Ph_index Ph_90err_low Ph_90err_hi Epeak Epeak_90err_low Epeak_90err_hi Norm Nomr_90err_low Norm_90err_hi chi2 dof
PL -1.906 -0.600 0.513 - - - 4.53e-03 -1.61e-03 1.47e-03 57.570 57
CPL -1.917 -1.005 0.528 9999.320 -9999.310 -9999.320 4.50e-03 -4.50e-03 2.04e-02 57.570 56
=== Fluence/Peak Flux Summary ===
Model Band1 Band2 Band3 Band4 Band5 Total
15-25 25-50 50-100 100-350 15-150 15-350 keV
Fluence PL 3.89e-08 8.28e-08 1.38e-07 5.26e-07 3.81e-07 7.86e-07 erg/cm2
90%_error_low -1.10e-08 -1.44e-08 -2.51e-08 -1.88e-07 -6.20e-08 -2.07e-07 erg/cm2
90%_error_hi 1.19e-08 1.40e-08 2.47e-08 2.56e-07 6.27e-08 2.64e-07 erg/cm2
Peak flux PL 2.76e-01 2.18e-01 1.17e-01 9.05e-02 6.52e-01 7.01e-01 ph/cm2/s
90%_error_low -1.06e-01 -5.79e-02 -5.24e-02 -6.02e-02 -1.73e-01 -1.88e-01 ph/cm2/s
90%_error_hi 1.15e-01 5.79e-02 5.29e-02 1.05e-01 1.73e-01 1.90e-01 ph/cm2/s
Fluence CPL 3.96e-08 8.24e-08 1.38e-07 5.53e-07 3.82e-07 7.49e-07 erg/cm2
90%_error_low -1.18e-08 -1.47e-08 -2.54e-08 -3.89e-07 -6.79e-08 -3.28e-07 erg/cm2
90%_error_hi 1.13e-08 1.60e-08 2.82e-08 8.38e-09 6.41e-08 2.88e-07 erg/cm2
Peak flux CPL 2.80e-01 2.18e-01 1.15e-01 9.93e-02 6.53e-01 7.03e-01 ph/cm2/s
90%_error_low -1.24e-01 -5.71e-02 -7.41e-02 -6.31e-02 -1.75e-01 -1.89e-01 ph/cm2/s
90%_error_hi 1.15e-01 3.75e-02 5.44e-02 2.63e-02 1.72e-01 1.85e-01 ph/cm2/s
======================================================================
Image
Pre-slew 15.0-350.0 keV image (Event data)
#   RAcent    DECcent   POSerr    Theta     Phi              Peak Cts       SNR   Name
  226.8013   -41.3526   0.0154    12.8433   -53.3051         0.6973701     12.439 TRIG_01191188

Foreground time interval of the image:
 -8.632   9.584 (delta_t =  18.216 [sec])
Background time interval of the image:
-239.504  -8.632 (delta_t = 230.872 [sec])
Light Curves
Note: The mask-weighted lightcurves have units of either count/det or counts/sec/det, where a det is 0.4 x 0.4 = 0.16 sq cm.
Full-time range; 1 s binning
Other quick-look light curves:
- 64 ms binning (zoomed)
- 16 ms binning (zoomed)
- 8 ms binning (zoomed)
- 2 ms binning (zoomed)
- SN=5 or 10 s binning (full-time range)
- Raw light curve
Spectra
- 64 ms binning (zoomed)
- 16 ms binning (zoomed)
- 8 ms binning (zoomed)
- 2 ms binning (zoomed)
- SN=5 or 10 s binning (full-time range)
- Raw light curve
Spectra
Notes:
- 1) The fitting includes the systematic errors.
- 2) When the burst includes telescope slew time periods, the fitting uses an average response file made from multiple 5-s response files through out the slew time plus single time preiod for the non-slew times, and weighted by the total counts in the corresponding time period using addrmf. An average response file is needed becuase a spectral fit using the pre-slew DRM will introduce some errors in both a spectral shape and a normalization if the PHA file contains a lot of the slew/post-slew time interval.
- 3) For fits to more complicated models (e.g. a power-law over a cutoff power-law), the BAT team has decided to require a chi-square improvement of more than 6 for each extra dof.
Time averaged spectrum fit using the average DRM
Power-law model

Time interval is from   -8.632 sec. to    9.584 sec.

Spectral model in power-law:
------------------------------------------------------------
Parameters  : value       lower 90%   higher 90%
Photon index: -1.26018     ( -0.273434   0.281538 )
Norm@50keV  : 2.09318E-03    ( -0.000309166   0.000309166 )
------------------------------------------------------------
#Fit statistic  : Chi-Squared                   56.28     using 59 bins.
 Reduced chi-squared = 0.987368
# Null hypothesis probability of 5.02e-01 with 57 degrees of freedom

Photon flux (15-150 keV)    in 18.22 sec: 0.247984 ( -0.038259  0.038472 ) ph/cm2/s
Energy fluence (15-150 keV)             : 3.80714e-07 ( -6.20316e-08  6.26988e-08 ) ergs/cm2
Cutoff power-law model
Time interval is from   -8.632 sec. to    9.584 sec.
Spectral model in the cutoff power-law:
------------------------------------------------------------
Parameters  : value       lower 90%   higher 90%
Photon index: -1.25627     ( -1.93747   0.8424 )
Epeak [keV] : 1.00000E+04      ( -10000 -10000 )
Norm@50keV  : 2.10237E-03    ( -0.000310556   -0.00210243 )
------------------------------------------------------------
#Fit statistic  : Chi-Squared                   56.28     using 59 bins.
 Reduced chi-squared = 1.005
# Null hypothesis probability of 4.64e-01 with 56 degrees of freedom

Photon flux (15-150 keV)    in 18.22 sec: 0.248967 ( -0.041502  0.039324 ) ph/cm2/s
Energy fluence (15-150 keV)             : 3.82181e-07 ( -6.7907e-08  6.40692e-08 ) ergs/cm2
1-s peak spectrum fit
Power-law model
Time interval is from    2.072 sec. to    3.072 sec.

Spectral model in power-law:
------------------------------------------------------------
Parameters  : value       lower 90%   higher 90%
Photon index: -1.90608     ( -0.600111   0.512923 )
Norm@50keV  : 4.52860E-03    ( -0.00160889   0.00147091 )
------------------------------------------------------------
#Fit statistic  : Chi-Squared                   57.57     using 59 bins.
 Reduced chi-squared = 1.01
# Null hypothesis probability of 4.54e-01 with 57 degrees of freedom

Photon flux (15-150 keV)    in 1 sec: 0.651628 ( -0.173023  0.173132 ) ph/cm2/s
Energy fluence (15-150 keV)             : 4.16438e-08 ( -1.3471e-08  1.41248e-08 ) ergs/cm2
Cutoff power-law model
Time interval is from    2.072 sec. to    3.072 sec.
Spectral model in the cutoff power-law:
------------------------------------------------------------
Parameters  : value       lower 90%   higher 90%
Photon index: -1.91705     ( -1.00776   0.524487 )
Epeak [keV] : 9999.32      ( -9999.35 -9999.36 )
Norm@50keV  : 4.49569E-03    ( -0.00452011   0.0204081 )
------------------------------------------------------------
#Fit statistic  : Chi-Squared                   57.57     using 59 bins.
 Reduced chi-squared = 1.02804
# Null hypothesis probability of 4.17e-01 with 56 degrees of freedom

Photon flux (15-150 keV)    in 1 sec: 0.652626 ( -0.174534  0.172458 ) ph/cm2/s
Energy fluence (15-150 keV)             : 3.92022e-08 ( -3.6428e-08  1.30615e-08 ) ergs/cm2
Time-resolved spectra
Distribution
T90 vs. Hardness ratio plot
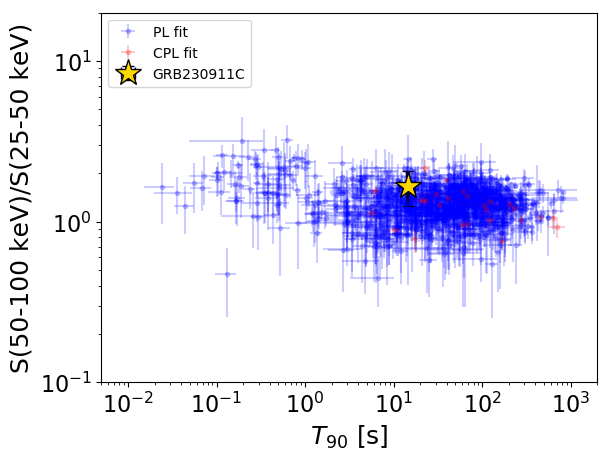
T90                                   = 14.488 sec.
Hardness ratio (energy fluence ratio) = 1.67001344587
S(15-50 keV) vs. S(50-150 keV) plot
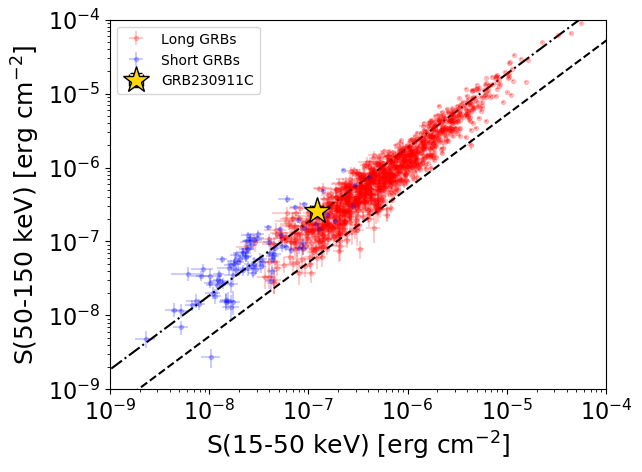
S(15-50 keV)  = 1.2175008e-07
S(50-150 keV) = 2.589623e-07
The dash-dotted line and the dashed line traces the fluences calculated from the Band function with Epeak = 15 and 150 keV, respectively. Both lines assume a canonical values of alpha = -1 and beta = -2.5.
Mask shadow pattern
IMX = 1.362359546233123E-01, IMY = 1.828085824036829E-01
Spacecraft aspect plot
Bright source in the pre-burst/pre-slew/post-slew images
Pre-burst image of 15-350 keV band
Time interval of the image:
-239.504000 -8.632000

# RAcent  DECcent POSerr Theta    Phi  PeakCts   SNR AngSep     Name
#  [deg]    [deg]    ['] [deg]  [deg]                   [']
170.4882 -60.4536   36.0  36.3 -145.6   0.2396   0.3   11.4	Cen X-3
186.3299 -62.7974    4.4  28.5 -147.5   1.6806   2.6    9.1	GX 301-2
244.9732 -15.6567    1.4  36.9   -3.1   6.4317   8.3    1.1	Sco X-1
256.0084 -37.8378    1.2  19.3   34.6   5.7120   9.4    1.1	4U 1700-377
256.2991 -36.2684   22.5  20.7   32.5   0.3177   0.5   11.4	GX 349+2
262.8480 -24.6061   30.4  33.6   29.7  -0.3505  -0.4   12.1	GX 1+4
264.7539 -44.5217    7.3  19.6   62.9   0.9577   1.6    4.3	4U 1735-44
270.2891 -25.1713    9.5  36.7   40.2   1.5697   1.2    5.5	GX 5-1
270.1729 -25.8380   23.2  36.1   40.7   0.6176   0.5    9.0	GRS 1758-258
273.9527 -14.0418   15.8  47.9   35.8  -1.4986  -0.7    3.1	GX 17+2
275.8630 -30.2961   15.4  35.6   52.1  -0.9829  -0.8    5.3	H1820-303
263.1456 -33.9746    8.6  25.9   40.5   0.9666   1.4   11.5	GX 354-0
261.9332 -16.2014    0.4  40.8   22.3  29.7829  27.1 ------	UNKNOWN
257.8550 -13.7045    3.0  41.7   15.4   4.0833   3.8 ------	UNKNOWN
255.2926 -34.7216    2.5  21.6   28.2   2.7771   4.7 ------	UNKNOWN
139.8464 -50.8197    2.5  55.9 -146.3  16.2632   4.6 ------	UNKNOWN
Pre-slew background subtracted image of 15-350 keV band
Time interval of the image:
-8.632000 9.584000

# RAcent  DECcent POSerr Theta    Phi  PeakCts   SNR AngSep     Name
#  [deg]    [deg]    ['] [deg]  [deg]                   [']
170.0206 -60.6201   11.4  36.5 -146.0  -0.0803  -1.0    8.7	Cen X-3
186.5322 -62.9750    0.0  28.4 -147.9   0.1001   1.5   12.7	GX 301-2
245.0907 -15.7150    6.3  36.9   -2.9  -0.1583  -1.8    7.8	Sco X-1
256.0474 -37.8252    2.7  19.4   34.6  -0.2706  -4.2    3.1	4U 1700-377
256.3744 -36.2724   57.6  20.8   32.6   0.0130   0.2    9.5	GX 349+2
262.9575 -24.5985    4.7  33.7   29.8   0.2309   2.4    9.3	GX 1+4
264.7779 -44.4080    5.7  19.7   62.7  -0.1451  -2.0    2.9	4U 1735-44
270.2980 -25.2176    3.8  36.6   40.2   0.3506   3.1    8.3	GX 5-1
270.1937 -25.6762    7.0  36.2   40.6  -0.1884  -1.7    7.1	GRS 1758-258
273.9905 -13.9421    7.4  48.1   35.8  -0.4276  -1.6    5.7	GX 17+2
275.9786 -30.4964    5.2  35.5   52.5  -0.2632  -2.2    8.2	H1820-303
263.1469 -33.7229    5.2  26.1   40.1  -0.1695  -2.2   10.3	GX 354-0
 90.4482 -79.5250    2.6  47.0  172.3   0.5273   4.5 ------	UNKNOWN
238.7915 -70.5856    2.7  18.6  162.9   0.2393   4.2 ------	UNKNOWN
226.8013 -41.3526    0.9  12.8  -53.3   0.6971  12.4 ------	UNKNOWN
Post-slew image of 15-350 keV band
Time interval of the image:
101.796590 815.996600

# RAcent  DECcent POSerr Theta    Phi  PeakCts   SNR AngSep     Name
#  [deg]    [deg]    ['] [deg]  [deg]                   [']
170.3190 -60.6206   17.9  38.8 -165.3   1.3363   0.6    0.2	Cen X-3
186.4192 -62.8818    4.4  31.9 -172.1   4.2079   2.6    9.3	GX 301-2
244.9777 -15.6115    1.1  30.1   10.7  20.3660  10.1    1.7	Sco X-1
255.9512 -37.7196    2.9  22.7   64.4   7.7253   4.0    7.7	4U 1700-377
256.4766 -36.5507    4.6  23.4   62.0   5.1388   2.5    7.9	GX 349+2
263.0077 -24.7450  101.4  34.2   46.4  -0.3997  -0.1    0.1	GX 1+4
264.8279 -44.4361   11.4  27.8   83.3   2.8340   1.0    3.7	4U 1735-44
270.4456 -25.1449   20.2  39.4   53.7   2.7742   0.6    9.6	GX 5-1
270.4051 -25.6573    6.8  39.1   54.3   8.1436   1.7    7.6	GRS 1758-258
275.9467 -30.2466    9.6  40.8   64.4  -9.9701  -1.2    7.3	H1820-303
262.9457 -33.8621  117.0  29.4   61.1  -0.2933  -0.1    2.7	GX 354-0
261.9352 -16.1964    0.5  39.3   34.7  94.0973  22.4 ------	UNKNOWN
256.3492  -1.0458    2.8  48.3   15.3  18.9900   4.1 ------	UNKNOWN
220.2355 -39.7594    2.8   5.2 -100.6   5.8429   4.1 ------	UNKNOWN
179.9244 -45.0765    2.9  33.9 -138.4   8.5975   4.0 ------	UNKNOWN
148.3291 -43.1615    2.9  55.9 -146.3  41.5790   4.1 ------	UNKNOWN
165.0205 -34.6805    3.7  48.1 -129.2  20.1973   3.1 ------	UNKNOWN