Analysis Summary
Notes:
- 1) No attempt has been made to eliminate the non-significant decimal places.
- 2) This batgrbproduct analysis is done using the HEASARC data.
- 3) This batgrbproduct analysis is using the flight position for the mask-weighting calculation.
======================================================================
                  BAT GRB EVENT DATA PROCESSING REPORT
    Process Script Ver: batgrbproduct v2.48
    Process Start Time: Tue Dec 26 23:45:27 EST 2023
             Host Name: batproc1
   Current Working Dir: /local/data/bat1/alien/Swift_3rdBATcatalog/event/batevent_reproc/trigger1193078
======================================================================

  Trigger: 01193078      Segment: 000

  BAT Trigger Time: 720158981.824   [s; MET]
      Trigger Stop: 720158982.848   [s; MET]
               UTC: 2023-10-28T04:09:09.558200    [includes UTCF correction]
       Where From?: TDRSS position message

  BAT
    RA: 214.028595171049   Dec: 20.895108866395  [deg; J2000]

     Catalogged Source?: NO
     Point Source?:      YES
     GRB Indicated?:     YES    [ by BAT flight software ]
     Image S/N Ratio:    18.14
     Image Trigger?:     NO
     Rate S/N Ratio:     63.8435587980495  [ if not an image trigger ]
     Image S/N Ratio:    18.14

  Analysis Position:   [ source = BAT ]
    RA: 214.028595171049   Dec: 20.895108866395  [deg; J2000]

  Refined Position:   [ source = BAT pre-slew burst ]
    RA: 214.016025587511   Dec: 20.8962990595041  [deg; J2000]
        { 14h 16m 03.8s , +20d 53' 46.7" }
         +/- 0.660372346519235 [arcmin] (estimated 90% radius based on SNR)
         +/- 0.208380794021293 [arcmin] (formal 1-sigma fit error)
    SNR: 55.0253532216429

  Angular difference between the analysis and refined position is 0.708184 arcmin

  Partial Coding Fraction: 0.6875    [ including projection effects ]

  Duration
     T90: 37.1119999885559 +/- 0.963676301549326
        Measured from: -2.03600001335144
                   to: 35.0759999752045     [s; relative to TRIGTIME]
     T50: 14.8839999437332 +/- 1.2932130348325
        Measured from: 1.81599998474121
                   to: 16.6999999284744     [s; relative to TRIGTIME]


  Fluence
     Peak Flux  (peak 1 second)
        Measured from: 1.05999994277954
                   to: 2.05999994277954     [s; relative to TRIGTIME]
     Total Fluence
        Measured from: -6.85599994659424
                   to: 41.4880000352859     [s; relative to TRIGTIME]

             Band 1     Band 2     Band 3     Band 4
              15-25      25-50     50-100    100-350     keV
 Total     2.672219   4.003069   3.291326   0.882934
           0.063203   0.068044   0.061356   0.046276 [error]
 Peak      0.204860   0.370049   0.401464   0.119373
           0.012157   0.015003   0.015340   0.010543 [error]

     [ fluence units of on-axis counts / fully illuminated detector ]

======================================================================


====== Table of the duration information =============================

        Value   tstart    tstop
T100   48.344   -6.856   41.488
T90    37.112   -2.036   35.076
T50    14.884    1.816   16.700
Peak    1.000    1.060    2.060


====== Spectral Analysis Summary =====================================

Model      : spectral model: simple power-law (PL) and cutoff power-law (CPL)
Ph_index   : photon index: E^{Ph_index}
Ph_90err   : 90% error of the photon index
Epeak      : Epeak in keV
Epeak_90err: 90% error of Epeak
Norm       : normalization at 50 keV in both the PL model and CPL model
Nomr_90err : 90% error of the normalization
chi2       : Chi-Squared
dof        : degree of freedo

=== Time-averaged spectral analysis ===
(Best model with acceptable fit: PL)

Model Ph_index Ph_90err_low Ph_90err_hi  Epeak  Epeak_90err_low  Epeak_90err_hi  Norm       Nomr_90err_low    Norm_90err_hi    chi2    dof
PL      -1.396    -0.042      0.042       -           -               -         1.54e-02     -3.38e-04          3.38e-04      40.900   57
CPL     -1.311    -0.132      0.166      466.230    -466.230      -466.230      1.68e-02     -1.59e-03          2.96e-03      40.090   56


=== 1-s peak spectral analysis ===
(Best model with acceptable fit: N/A)

Model Ph_index Ph_90err_low Ph_90err_hi  Epeak  Epeak_90err_low  Epeak_90err_hi  Norm       Nomr_90err_low    Norm_90err_hi    chi2    dof
PL      -1.099     -0.072     0.073       -           -               -         7.48e-02     -3.19e-03          3.19e-03      54.090   57
CPL     -0.692     -0.297     0.318      181.894     -55.709       306.155      1.15e-01     -3.01e-02          4.38e-02      48.510   56


=== Fluence/Peak Flux Summary ===

              Model    Band1     Band2     Band3     Band4     Band5     Total
                       15-25     25-50    50-100    100-350    15-150    15-350    keV
Fluence         PL   8.62e-07  1.69e-06  2.56e-06  8.48e-06  7.19e-06  1.36e-05   erg/cm2
      90%_error_low -4.01e-08 -4.57e-08 -6.53e-08 -4.98e-07 -1.63e-07 -5.26e-07   erg/cm2
      90%_error_hi   4.08e-08  4.55e-08  6.51e-08  5.20e-07  1.63e-07  5.43e-07   erg/cm2
Peak flux       PL   6.06e-04  7.25e-03  1.06e-01  9.58e+00  4.97e-01  9.60e+00   ph/cm2/s
      90%_error_low     N/A       N/A       N/A       N/A       N/A       N/A     ph/cm2/s
      90%_error_hi      N/A       N/A       N/A       N/A       N/A       N/A     ph/cm2/s

Fluence        CPL   8.42e-07  1.69e-06  2.59e-06  7.59e-06  7.16e-06  1.27e-05   erg/cm2
      90%_error_low -5.34e-08 -4.74e-08 -7.53e-08 -1.40e-06 -1.76e-07 -1.40e-06   erg/cm2
      90%_error_hi   4.88e-08  4.75e-08  7.66e-08  1.00e-06  1.74e-07  1.05e-06   erg/cm2
Peak flux      CPL   1.90e+00  2.76e+00  2.63e+00  2.77e+00  8.55e+00  1.01e+01   ph/cm2/s
      90%_error_low -2.18e-01 -1.50e-01 -1.52e-01 -6.62e-01 -3.88e-01 -7.71e-01   ph/cm2/s
      90%_error_hi   2.24e-01  1.52e-01  1.54e-01  9.27e-01  3.88e-01  9.79e-01   ph/cm2/s

======================================================================
Image
Pre-slew 15.0-350.0 keV image (Event data)
#   RAcent    DECcent   POSerr    Theta     Phi              Peak Cts       SNR   Name
  214.0160    20.8963   0.0035    26.6878  -118.5304        10.8028289     55.025 TRIG_01193078

Foreground time interval of the image:
 -6.856  41.488 (delta_t =  48.344 [sec])
Background time interval of the image:
-239.824  -6.856 (delta_t = 232.968 [sec])
Light Curves
Note: The mask-weighted lightcurves have units of either count/det or counts/sec/det, where a det is 0.4 x 0.4 = 0.16 sq cm.
Full-time range; 1 s binning
Other quick-look light curves:
- 64 ms binning (zoomed)
- 16 ms binning (zoomed)
- 8 ms binning (zoomed)
- 2 ms binning (zoomed)
- SN=5 or 10 s binning (full-time range)
- Raw light curve
Spectra
- 64 ms binning (zoomed)
- 16 ms binning (zoomed)
- 8 ms binning (zoomed)
- 2 ms binning (zoomed)
- SN=5 or 10 s binning (full-time range)
- Raw light curve
Spectra
Notes:
- 1) The fitting includes the systematic errors.
- 2) When the burst includes telescope slew time periods, the fitting uses an average response file made from multiple 5-s response files through out the slew time plus single time preiod for the non-slew times, and weighted by the total counts in the corresponding time period using addrmf. An average response file is needed becuase a spectral fit using the pre-slew DRM will introduce some errors in both a spectral shape and a normalization if the PHA file contains a lot of the slew/post-slew time interval.
- 3) For fits to more complicated models (e.g. a power-law over a cutoff power-law), the BAT team has decided to require a chi-square improvement of more than 6 for each extra dof.
Time averaged spectrum fit using the average DRM
Power-law model
Time interval is from   -6.856 sec. to   41.488 sec.

Spectral model in power-law:
------------------------------------------------------------
Parameters  : value       lower 90%   higher 90%
Photon index: -1.39627     ( -0.041754   0.0418273 )
Norm@50keV  : 1.53833E-02    ( -0.00033816   0.000338 )
------------------------------------------------------------
#Fit statistic  : Chi-Squared                   40.90     using 59 bins.
 Reduced chi-squared = 0.717544
# Null hypothesis probability of 9.47e-01 with 57 degrees of freedom

Photon flux (15-150 keV)    in 48.34 sec: 1.87186 ( -0.04647  0.0466 ) ph/cm2/s
Energy fluence (15-150 keV)             : 7.19178e-06 ( -1.63057e-07  1.63284e-07 ) ergs/cm2
Cutoff power-law model
Time interval is from   -6.856 sec. to   41.488 sec.
Spectral model in the cutoff power-law:
------------------------------------------------------------
Parameters  : value       lower 90%   higher 90%
Photon index: -1.31098     ( -0.131976   0.16599 )
Epeak [keV] : 466.230      ( -466.317 -466.317 )
Norm@50keV  : 1.67634E-02    ( -0.00158525   0.00296071 )
------------------------------------------------------------
#Fit statistic  : Chi-Squared                   40.09     using 59 bins.
 Reduced chi-squared = 0.715893
# Null hypothesis probability of 9.46e-01 with 56 degrees of freedom

Photon flux (15-150 keV)    in 48.34 sec: 1.85964 ( -0.05142  0.04418 ) ph/cm2/s
Energy fluence (15-150 keV)             : 7.15727e-06 ( -1.75641e-07  1.73789e-07 ) ergs/cm2
1-s peak spectrum fit
Power-law model
Time interval is from    1.060 sec. to    2.060 sec.

Spectral model in power-law:
------------------------------------------------------------
Parameters  : value       lower 90%   higher 90%
Photon index: -1.09917     ( -0.0724604   0.0727357 )
Norm@50keV  : 7.48012E-02    ( -0.00318858   0.00318798 )
------------------------------------------------------------
#Fit statistic  : Chi-Squared                   54.09     using 59 bins.
 Reduced chi-squared = 0.948947
# Null hypothesis probability of 5.85e-01 with 57 degrees of freedom

Photon flux (15-150 keV)    in 1 sec: 0.497246 (    ) ph/cm2/s
Energy fluence (15-150 keV)             : 7.82348e-07 ( -3.68783e-08  3.7003e-08 ) ergs/cm2
Cutoff power-law model
Time interval is from    1.060 sec. to    2.060 sec.
Spectral model in the cutoff power-law:
------------------------------------------------------------
Parameters  : value       lower 90%   higher 90%
Photon index: -0.691601     ( -0.297198   0.317971 )
Epeak [keV] : 181.894      ( -55.7081 306.155 )
Norm@50keV  : 0.114678    ( -0.0300675   0.0437501 )
------------------------------------------------------------
#Fit statistic  : Chi-Squared                   48.51     using 59 bins.
 Reduced chi-squared = 0.86625
# Null hypothesis probability of 7.51e-01 with 56 degrees of freedom

Photon flux (15-150 keV)    in 1 sec: 8.55463 ( -0.38813  0.38826 ) ph/cm2/s
Energy fluence (15-150 keV)             : 7.69272e-07 ( -3.87892e-08  3.86511e-08 ) ergs/cm2
Time-resolved spectra
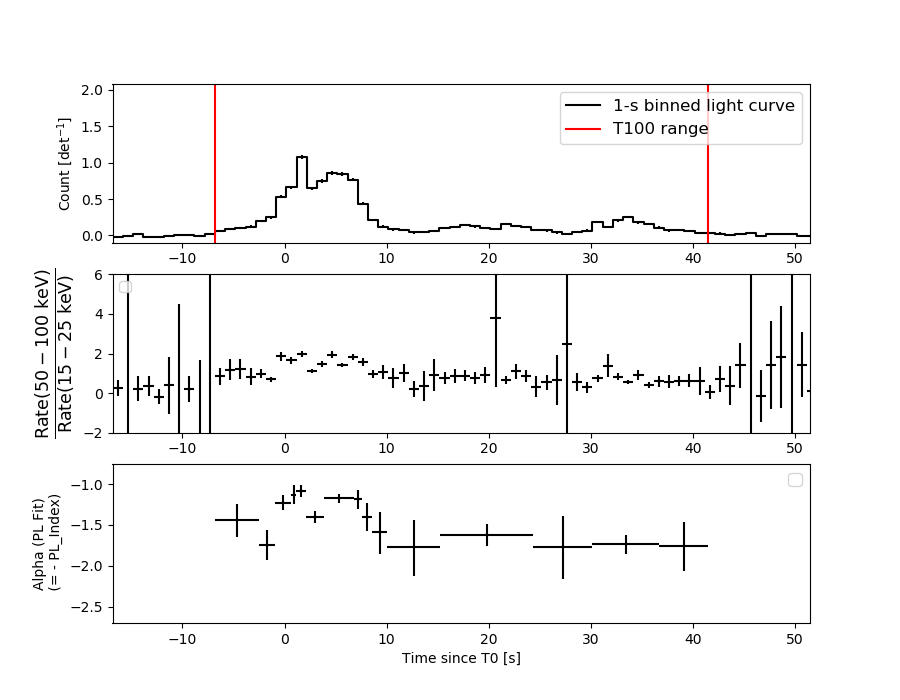
Distribution
T90 vs. Hardness ratio plot
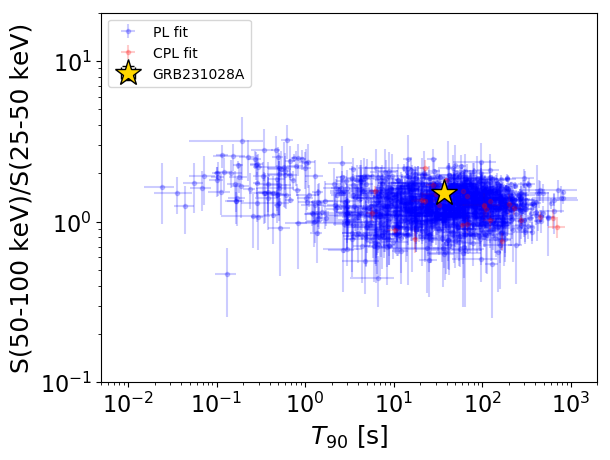
T90                                   = 37.112 sec.
Hardness ratio (energy fluence ratio) = 1.51967256357
S(15-50 keV) vs. S(50-150 keV) plot
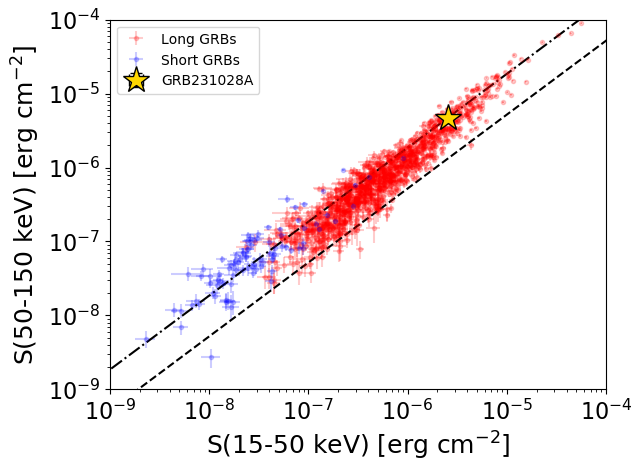
S(15-50 keV)  = 2.5486866e-06
S(50-150 keV) = 4.643149e-06
The dash-dotted line and the dashed line traces the fluences calculated from the Band function with Epeak = 15 and 150 keV, respectively. Both lines assume a canonical values of alpha = -1 and beta = -2.5.
Mask shadow pattern
IMX = -2.400934082089464E-01, IMY = 4.416380570985167E-01
Spacecraft aspect plot
Bright source in the pre-burst/pre-slew/post-slew images
Pre-burst image of 15-350 keV band
Time interval of the image:
-239.824000 -6.856000

# RAcent  DECcent POSerr Theta    Phi  PeakCts   SNR AngSep     Name
#  [deg]    [deg]    ['] [deg]  [deg]                   [']
254.5226  35.4050    5.0  52.6 -165.5  -2.0810  -2.3    4.9	Her X-1
136.5775  31.4181    3.0  43.0   44.9   3.6939   3.8 ------	UNKNOWN
225.9626  69.2944    3.0  39.4  144.8   3.5859   3.9 ------	UNKNOWN
192.9297  31.9682    2.5   5.1 -101.7   1.4251   4.6 ------	UNKNOWN
174.5850   1.3798    2.4  36.6  -31.2   2.1040   4.9 ------	UNKNOWN
235.7458  12.8781    2.8  48.1 -129.1   5.8884   4.1 ------	UNKNOWN
Pre-slew background subtracted image of 15-350 keV band
Time interval of the image:
-6.856000 41.488000

# RAcent  DECcent POSerr Theta    Phi  PeakCts   SNR AngSep     Name
#  [deg]    [deg]    ['] [deg]  [deg]                   [']
254.4371  35.3913    4.6  52.6 -165.5  -1.0984  -2.5    3.1	Her X-1
180.7581  72.9860    3.9  37.6  121.3   1.2007   3.0 ------	UNKNOWN
268.1177  60.1477    3.8  54.7  161.8   2.7659   3.0 ------	UNKNOWN
230.2473  31.9487    2.8  34.6 -151.3   0.7789   4.2 ------	UNKNOWN
240.6745  32.3449    2.1  42.9 -156.4   1.3480   5.5 ------	UNKNOWN
214.0160  20.8963    0.2  26.7 -118.5  10.8021  55.0 ------	UNKNOWN
Post-slew image of 15-350 keV band
Time interval of the image:
345.876600 962.234600

# RAcent  DECcent POSerr Theta    Phi  PeakCts   SNR AngSep     Name
#  [deg]    [deg]    ['] [deg]  [deg]                   [']
244.8805 -15.7264    0.3  23.8  -56.9  46.9828  34.1    7.7	Sco X-1
255.9925 -37.9078    1.3  12.4 -134.7  10.8399   9.0    3.8	4U 1700-377
256.2537 -36.2695    0.0  11.2 -129.3   0.8738   0.7   12.7	GX 349+2
262.8414 -24.6807    8.8   5.3  -33.1   1.6493   1.3    9.9	GX 1+4
264.9577 -44.5927    0.0  15.7 -172.3  -1.3242  -1.2   12.6	4U 1735-44
268.4730  -1.4032    5.4  27.6    8.5   3.3927   2.1    7.0	SW J1753.5-0127
270.2426 -24.9325   58.9   5.3   45.4   0.2457   0.2    9.1	GX 5-1
270.4852 -25.8770    0.0   4.8   54.7  -1.6132  -1.3   12.7	GRS 1758-258
274.1433 -14.1720    7.3  16.5   31.5   2.0067   1.6   11.4	GX 17+2
275.8285 -30.3267    7.5   8.3  105.7   1.8982   1.5    5.6	H1820-303
285.1206 -25.0505    8.0  17.1   85.2  -2.3034  -1.4    9.1	HT1900.1-2455
288.9114  11.0000    8.5  45.5   35.8   4.4271   1.4    7.4	GRS 1915+105
262.8152 -33.9664    3.0   5.8 -145.7   4.7814   3.8   11.7	GX 354-0
314.9655 -54.0148    2.7  43.0  143.7  16.0972   4.4 ------	UNKNOWN