Analysis Summary
Notes:
- 1) No attempt has been made to eliminate the non-significant decimal places.
- 2) This batgrbproduct analysis is done using the HEASARC data.
- 3) This batgrbproduct analysis is using the flight position for the mask-weighting calculation.
======================================================================
                  BAT GRB EVENT DATA PROCESSING REPORT
    Process Script Ver: batgrbproduct v2.48
    Process Start Time: Tue Dec 26 15:42:56 EST 2023
             Host Name: batproc1
   Current Working Dir: /local/data/bat1/alien/Swift_3rdBATcatalog/event/batevent_reproc/trigger1194500
======================================================================

  Trigger: 01194500      Segment: 000

  BAT Trigger Time: 720755292.224   [s; MET]
      Trigger Stop: 720755293.248   [s; MET]
               UTC: 2023-11-04T01:47:39.917340    [includes UTCF correction]
       Where From?: TDRSS position message

  BAT
    RA: 23.7891451771579   Dec: 83.790808701288  [deg; J2000]

     Catalogged Source?: NO
     Point Source?:      YES
     GRB Indicated?:     YES    [ by BAT flight software ]
     Image S/N Ratio:    23.7
     Image Trigger?:     NO
     Rate S/N Ratio:     255.998046867549  [ if not an image trigger ]
     Image S/N Ratio:    23.7

  Analysis Position:   [ source = BAT ]
    RA: 23.7891451771579   Dec: 83.790808701288  [deg; J2000]

  Refined Position:   [ source = BAT pre-slew burst ]
    RA: 23.8232899443077   Dec: 83.7942183482602  [deg; J2000]
        { 01h 35m 17.6s , +83d 47' 39.2" }
         +/- 0.512563844230318 [arcmin] (estimated 90% radius based on SNR)
         +/- 0.0916436390894789 [arcmin] (formal 1-sigma fit error)
    SNR: 79.0249336168939

  Angular difference between the analysis and refined position is 0.301538 arcmin

  Partial Coding Fraction: 0.890625    [ including projection effects ]

  Duration
     T90: 46.7119998931885 +/- 1.56841836679801
        Measured from: -5.75599992275238
                   to: 40.9559999704361     [s; relative to TRIGTIME]
     T50: 22.0039999485016 +/- 0.227437965134723
        Measured from: -0.875999927520752
                   to: 21.1280000209808     [s; relative to TRIGTIME]


  Fluence
     Peak Flux  (peak 1 second)
        Measured from: 0.240000009536743
                   to: 1.24000000953674     [s; relative to TRIGTIME]
     Total Fluence
        Measured from: -13.3919999599457
                   to: 55.8320000171661     [s; relative to TRIGTIME]

             Band 1     Band 2     Band 3     Band 4
              15-25      25-50     50-100    100-350     keV
 Total     4.516816   6.865695   6.077785   1.898170
           0.065540   0.072108   0.066821   0.051915 [error]
 Peak      0.529279   1.032874   1.215987   0.481761
           0.015480   0.020577   0.023136   0.018449 [error]

     [ fluence units of on-axis counts / fully illuminated detector ]

======================================================================


====== Table of the duration information =============================

        Value   tstart    tstop
T100   69.224  -13.392   55.832
T90    46.712   -5.756   40.956
T50    22.004   -0.876   21.128
Peak    1.000    0.240    1.240


====== Spectral Analysis Summary =====================================

Model      : spectral model: simple power-law (PL) and cutoff power-law (CPL)
Ph_index   : photon index: E^{Ph_index}
Ph_90err   : 90% error of the photon index
Epeak      : Epeak in keV
Epeak_90err: 90% error of Epeak
Norm       : normalization at 50 keV in both the PL model and CPL model
Nomr_90err : 90% error of the normalization
chi2       : Chi-Squared
dof        : degree of freedo

=== Time-averaged spectral analysis ===
(Best model with acceptable fit: PL)

Model Ph_index Ph_90err_low Ph_90err_hi  Epeak  Epeak_90err_low  Epeak_90err_hi  Norm       Nomr_90err_low    Norm_90err_hi    chi2    dof
PL      -1.239    -0.031      0.031       -           -               -         1.88e-02     -3.09e-04          3.08e-04      47.260   57
CPL     -1.189    -0.077     -0.015      999.817    -999.817      -999.817      1.97e-02     -1.12e-03          9.02e-04      48.220   56


=== 1-s peak spectral analysis ===
(Best model with acceptable fit: PL)

Model Ph_index Ph_90err_low Ph_90err_hi  Epeak  Epeak_90err_low  Epeak_90err_hi  Norm       Nomr_90err_low    Norm_90err_hi    chi2    dof
PL      -0.824     -0.043     0.043       -           -               -         2.18e-01     -5.19e-03          5.18e-03      52.030   57
CPL     -0.747     -0.091     0.167      999.584    -999.584      -999.584      2.35e-01     -5.35e-03          3.91e-02      51.420   56


=== Fluence/Peak Flux Summary ===

              Model    Band1     Band2     Band3     Band4     Band5     Total
                       15-25     25-50    50-100    100-350    15-150    15-350    keV
Fluence         PL   1.30e-06  2.80e-06  4.75e-06  1.85e-05  1.30e-05  2.73e-05   erg/cm2
      90%_error_low -4.81e-08 -6.05e-08 -8.01e-08 -7.55e-07 -2.07e-07 -7.72e-07   erg/cm2
      90%_error_hi   4.89e-08  6.04e-08  7.99e-08  7.78e-07  2.07e-07  7.90e-07   erg/cm2
Peak flux       PL   4.71e+00  7.11e+00  8.03e+00  1.73e+01  2.50e+01  3.71e+01   ph/cm2/s
      90%_error_low -2.45e-01 -2.22e-01 -1.95e-01 -9.38e-01 -5.88e-01 -1.01e+00   ph/cm2/s
      90%_error_hi   2.50e-01  2.22e-01  1.94e-01  9.74e-01  5.88e-01  1.02e+00   ph/cm2/s

Fluence        CPL   1.13e-06  1.51e-06  1.56e-06  3.65e-06  5.18e-06  7.83e-06   erg/cm2
      90%_error_low -6.63e-08 -9.48e-08 -5.30e-08 -1.82e-07 -2.32e-07 -1.88e-07   erg/cm2
      90%_error_hi   4.82e-08  4.14e-08  3.68e-08  1.60e-07  8.84e-08  4.29e-07   erg/cm2
Peak flux      CPL   4.60e+00  7.14e+00  8.11e+00  1.68e+01  2.50e+01  3.58e+01   ph/cm2/s
      90%_error_low -3.32e-01 -2.37e-01 -2.24e-01 -3.40e+00 -6.10e-01 -2.49e+00   ph/cm2/s
      90%_error_hi   3.05e-01  2.14e-01  2.52e-01  9.34e-01  5.85e-01  1.80e+00   ph/cm2/s

======================================================================
Image
Pre-slew 15.0-350.0 keV image (Event data)
#   RAcent    DECcent   POSerr    Theta     Phi              Peak Cts       SNR   Name
   23.8233    83.7942   0.0024    20.1363   -43.3119        13.8237120     79.025 TRIG_01194500

Foreground time interval of the image:
-13.392  14.077 (delta_t =  27.469 [sec])
Background time interval of the image:
-168.923 -13.392 (delta_t = 155.531 [sec])
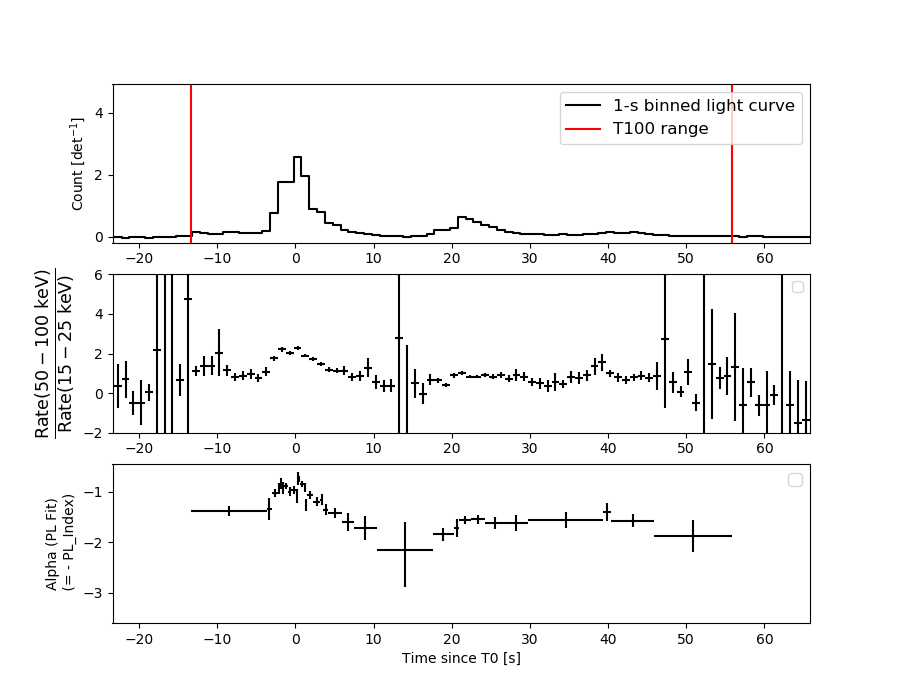
Light Curves
Note: The mask-weighted lightcurves have units of either count/det or counts/sec/det, where a det is 0.4 x 0.4 = 0.16 sq cm.
Full-time range; 1 s binning
Other quick-look light curves:
- 64 ms binning (zoomed)
- 16 ms binning (zoomed)
- 8 ms binning (zoomed)
- 2 ms binning (zoomed)
- SN=5 or 10 s binning (full-time range)
- Raw light curve
Spectra
- 64 ms binning (zoomed)
- 16 ms binning (zoomed)
- 8 ms binning (zoomed)
- 2 ms binning (zoomed)
- SN=5 or 10 s binning (full-time range)
- Raw light curve
Spectra
Notes:
- 1) The fitting includes the systematic errors.
- 2) When the burst includes telescope slew time periods, the fitting uses an average response file made from multiple 5-s response files through out the slew time plus single time preiod for the non-slew times, and weighted by the total counts in the corresponding time period using addrmf. An average response file is needed becuase a spectral fit using the pre-slew DRM will introduce some errors in both a spectral shape and a normalization if the PHA file contains a lot of the slew/post-slew time interval.
- 3) For fits to more complicated models (e.g. a power-law over a cutoff power-law), the BAT team has decided to require a chi-square improvement of more than 6 for each extra dof.
Time averaged spectrum fit using the average DRM
Power-law model
Time interval is from  -13.392 sec. to   55.832 sec.

Spectral model in power-law:
------------------------------------------------------------
Parameters  : value       lower 90%   higher 90%
Photon index: -1.23926     ( -0.030772   0.0308713 )
Norm@50keV  : 1.87600E-02    ( -0.000308644   0.000307866 )
------------------------------------------------------------
#Fit statistic  : Chi-Squared                   47.26     using 59 bins.
 Reduced chi-squared = 0.829123
# Null hypothesis probability of 8.18e-01 with 57 degrees of freedom

Photon flux (15-150 keV)    in 69.22 sec: 2.21500 ( -0.04101  0.04122 ) ph/cm2/s
Energy fluence (15-150 keV)             : 1.30344e-05 ( -2.0662e-07  2.07232e-07 ) ergs/cm2
Cutoff power-law model
Time interval is from  -13.392 sec. to   55.832 sec.
Spectral model in the cutoff power-law:
------------------------------------------------------------
Parameters  : value       lower 90%   higher 90%
Photon index: -1.23491     ( -0.0306619   0.0315365 )
Epeak [keV] : 9999.36      ( -9999.36 -9999.36 )
Norm@50keV  : 1.88293E-02    ( -0.000293811   0.00172402 )
------------------------------------------------------------
#Fit statistic  : Chi-Squared                   47.32     using 59 bins.
 Reduced chi-squared = 0.845
# Null hypothesis probability of 7.89e-01 with 56 degrees of freedom

Photon flux (15-150 keV)    in 69.22 sec: 2.21917 ( -0.04606  0.03611 ) ph/cm2/s
Energy fluence (15-150 keV)             : 5.18444e-06 ( -2.32201e-07  8.83642e-08 ) ergs/cm2
1-s peak spectrum fit
Power-law model
Time interval is from    0.240 sec. to    1.240 sec.

Spectral model in power-law:
------------------------------------------------------------
Parameters  : value       lower 90%   higher 90%
Photon index: -0.824163     ( -0.0426581   0.0429028 )
Norm@50keV  : 0.217964    ( -0.00519388   0.00517721 )
------------------------------------------------------------
#Fit statistic  : Chi-Squared                   52.03     using 59 bins.
 Reduced chi-squared = 0.912807
# Null hypothesis probability of 6.62e-01 with 57 degrees of freedom

Photon flux (15-150 keV)    in 1 sec: 25.0326 ( -0.5879  0.5882 ) ph/cm2/s
Energy fluence (15-150 keV)             : 2.52185e-06 ( -6.34644e-08  6.35039e-08 ) ergs/cm2
Cutoff power-law model
Time interval is from    0.240 sec. to    1.240 sec.
Spectral model in the cutoff power-law:
------------------------------------------------------------
Parameters  : value       lower 90%   higher 90%
Photon index: -0.747172     ( -0.0913525   0.166692 )
Epeak [keV] : 999.584      ( -999.962 -999.962 )
Norm@50keV  : 0.234600    ( -0.00533861   0.0391374 )
------------------------------------------------------------
#Fit statistic  : Chi-Squared                   51.42     using 59 bins.
 Reduced chi-squared = 0.918214
# Null hypothesis probability of 6.49e-01 with 56 degrees of freedom

Photon flux (15-150 keV)    in 1 sec: 24.9502 ( -0.61  0.5848 ) ph/cm2/s
Energy fluence (15-150 keV)             : 2.51495e-06 ( -6.521e-08  5.98885e-08 ) ergs/cm2
Time-resolved spectra
Distribution
T90 vs. Hardness ratio plot
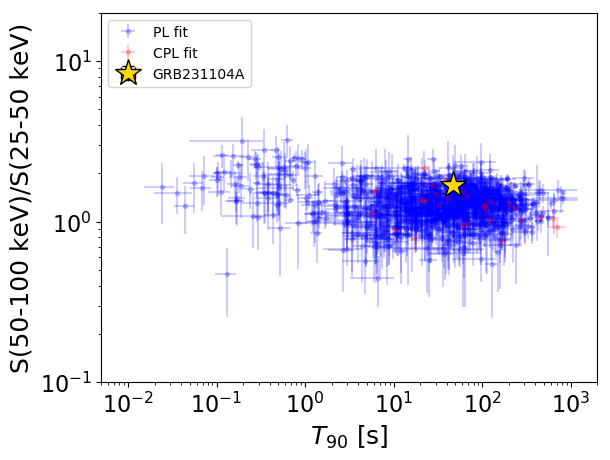
T90                                   = 46.712 sec.
Hardness ratio (energy fluence ratio) = 1.69441588241
S(15-50 keV) vs. S(50-150 keV) plot
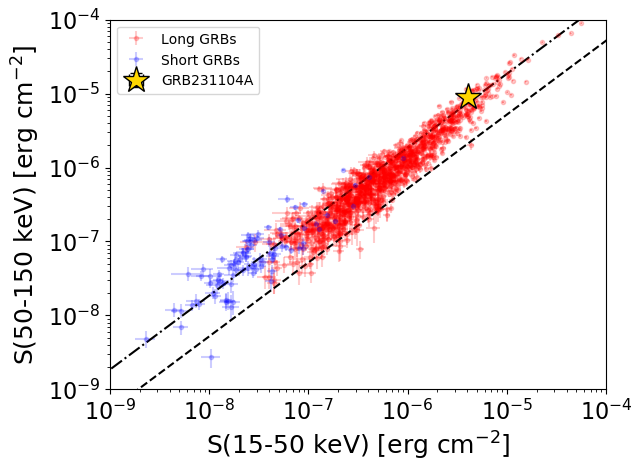
S(15-50 keV)  = 4.101319e-06
S(50-150 keV) = 8.933305e-06
The dash-dotted line and the dashed line traces the fluences calculated from the Band function with Epeak = 15 and 150 keV, respectively. Both lines assume a canonical values of alpha = -1 and beta = -2.5.
Mask shadow pattern
IMX = 2.667976350640010E-01, IMY = 2.515223821690920E-01
Spacecraft aspect plot
Bright source in the pre-burst/pre-slew/post-slew images
Pre-burst image of 15-350 keV band
Time interval of the image:
-168.923400 -13.392000

# RAcent  DECcent POSerr Theta    Phi  PeakCts   SNR AngSep     Name
#  [deg]    [deg]    ['] [deg]  [deg]                   [']
299.5879  35.1903    1.2  48.8 -141.5   6.2656   9.7    0.7	Cyg X-1
308.1383  40.9963    2.9  40.2 -144.8   1.6622   4.0    2.9	Cyg X-3
326.1313  38.2766    8.0  35.0 -166.4   0.4537   1.4    3.3	Cyg X-2
 75.4520  53.6428    3.1  35.2   25.0   1.5623   3.8 ------	UNKNOWN
Pre-slew background subtracted image of 15-350 keV band
Time interval of the image:
-13.392000 14.076590

# RAcent  DECcent POSerr Theta    Phi  PeakCts   SNR AngSep     Name
#  [deg]    [deg]    ['] [deg]  [deg]                   [']
299.6329  35.1725   12.0  48.8 -141.5   0.4695   1.0    2.7	Cyg X-1
308.1459  41.0018    6.0  40.2 -144.8   0.4986   1.9    3.4	Cyg X-3
326.3257  38.2912    7.8  34.9 -166.6   0.3010   1.5    7.5	Cyg X-2
 23.7510  30.4309    3.0  35.3  105.0   1.5301   3.9 ------	UNKNOWN
332.8280  22.7971    2.3  46.8  175.7   1.7818   5.1 ------	UNKNOWN
 23.8231  83.7941    0.1  20.1  -43.3  13.8197  79.0 ------	UNKNOWN
308.8190  20.7062    2.2  57.5 -159.2   4.0826   5.2 ------	UNKNOWN
Post-slew image of 15-350 keV band
Time interval of the image:
70.676590 719.756000
720.776000 962.889800

# RAcent  DECcent POSerr Theta    Phi  PeakCts   SNR AngSep     Name
#  [deg]    [deg]    ['] [deg]  [deg]                   [']
299.5916  35.1806    2.3  54.4 -165.5  18.2610   5.1    1.3	Cyg X-1
308.2232  40.9708    3.7  47.8 -173.1   8.3396   3.1    5.2	Cyg X-3
325.9646  38.2115    0.0  48.7  168.2  -5.5969  -1.5   11.8	Cyg X-2
349.0709  45.5702    3.0  39.4  144.8  12.0508   3.9 ------	UNKNOWN
154.4647  61.2929    2.4  33.1  -32.2   7.0391   4.7 ------	UNKNOWN
263.7796  45.3222    2.8  48.0 -129.1  21.3483   4.1 ------	UNKNOWN