Analysis Summary
Notes:
- 1) No attempt has been made to eliminate the non-significant decimal places.
- 2) This batgrbproduct analysis is done using the HEASARC data.
- 3) This batgrbproduct analysis is using the flight position for the mask-weighting calculation.
======================================================================
                  BAT GRB EVENT DATA PROCESSING REPORT
    Process Script Ver: batgrbproduct v2.48
    Process Start Time: Tue Dec 26 22:32:29 EST 2023
             Host Name: batproc1
   Current Working Dir: /local/data/bat1/alien/Swift_3rdBATcatalog/event/batevent_reproc/trigger1195887
======================================================================

  Trigger: 01195887      Segment: 000

  BAT Trigger Time: 721405072.064   [s; MET]
      Trigger Stop: 721405073.088   [s; MET]
               UTC: 2023-11-11T14:17:19.712860    [includes UTCF correction]
       Where From?: TDRSS position message

  BAT
    RA: 290.233898035718   Dec: 52.4469715812306  [deg; J2000]

     Catalogged Source?: NO
     Point Source?:      YES
     GRB Indicated?:     YES    [ by BAT flight software ]
     Image S/N Ratio:    12.51
     Image Trigger?:     NO
     Rate S/N Ratio:     23.6643191323985  [ if not an image trigger ]
     Image S/N Ratio:    12.51

  Analysis Position:   [ source = BAT ]
    RA: 290.233898035718   Dec: 52.4469715812306  [deg; J2000]

  Refined Position:   [ source = BAT pre-slew burst ]
    RA: 290.198774660372   Dec: 52.4400635289037  [deg; J2000]
        { 19h 20m 47.7s , +52d 26' 24.2" }
         +/- 0.772963180958617 [arcmin] (estimated 90% radius based on SNR)
         +/- 0.2401173660246 [arcmin] (formal 1-sigma fit error)
    SNR: 43.9431830693587

  Angular difference between the analysis and refined position is 1.349768 arcmin

  Partial Coding Fraction: 0.6171875    [ including projection effects ]

  Duration
     T90: 34.0759998559952 +/- 4.8503395055933
        Measured from: -3.74399995803833
                   to: 30.3319998979568     [s; relative to TRIGTIME]
     T50: 11.6119998693466 +/- 0.860306927820265
        Measured from: 0.0160000324249268
                   to: 11.6279999017715     [s; relative to TRIGTIME]


  Fluence
     Peak Flux  (peak 1 second)
        Measured from: 0.0679999589920044
                   to: 1.067999958992     [s; relative to TRIGTIME]
     Total Fluence
        Measured from: -5.32000005245209
                   to: 40.3400000333786     [s; relative to TRIGTIME]

             Band 1     Band 2     Band 3     Band 4
              15-25      25-50     50-100    100-350     keV
 Total     1.439329   1.961802   1.467724   0.377686
           0.061812   0.065682   0.057305   0.048656 [error]
 Peak      0.079637   0.125354   0.090236   0.029252
           0.010127   0.011642   0.010181   0.007737 [error]

     [ fluence units of on-axis counts / fully illuminated detector ]

======================================================================


====== Table of the duration information =============================

        Value   tstart    tstop
T100   45.660   -5.320   40.340
T90    34.076   -3.744   30.332
T50    11.612    0.016   11.628
Peak    1.000    0.068    1.068


====== Spectral Analysis Summary =====================================

Model      : spectral model: simple power-law (PL) and cutoff power-law (CPL)
Ph_index   : photon index: E^{Ph_index}
Ph_90err   : 90% error of the photon index
Epeak      : Epeak in keV
Epeak_90err: 90% error of Epeak
Norm       : normalization at 50 keV in both the PL model and CPL model
Nomr_90err : 90% error of the normalization
chi2       : Chi-Squared
dof        : degree of freedo

=== Time-averaged spectral analysis ===
(Best model with acceptable fit: PL)

Model Ph_index Ph_90err_low Ph_90err_hi  Epeak  Epeak_90err_low  Epeak_90err_hi  Norm       Nomr_90err_low    Norm_90err_hi    chi2    dof
PL      -1.580    -0.070      0.070       -           -               -         7.87e-03     -3.10e-04          3.09e-04      53.710   57
CPL     -1.183    -0.282      0.301      106.394     -25.422       123.170      1.23e-02     -3.25e-03          4.80e-03      47.770   56


=== 1-s peak spectral analysis ===
(Best model with acceptable fit: PL)

Model Ph_index Ph_90err_low Ph_90err_hi  Epeak  Epeak_90err_low  Epeak_90err_hi  Norm       Nomr_90err_low    Norm_90err_hi    chi2    dof
PL      -1.556     -0.172     0.169       -           -               -         2.15e-02     -2.32e-03          2.30e-03      66.850   57
CPL     -1.009     -0.619     0.789       88.060     -27.755       -88.060      4.15e-02     -2.12e-02          6.39e-02      64.910   56


=== Fluence/Peak Flux Summary ===

              Model    Band1     Band2     Band3     Band4     Band5     Total
                       15-25     25-50    50-100    100-350    15-150    15-350    keV
Fluence         PL   4.94e-07  8.65e-07  1.16e-06  3.18e-06  3.37e-06  5.69e-06   erg/cm2
      90%_error_low -3.47e-08 -3.66e-08 -5.83e-08 -3.37e-07 -1.41e-07 -3.79e-07   erg/cm2
      90%_error_hi   3.55e-08  3.65e-08  5.82e-08  3.63e-07  1.41e-07  3.99e-07   erg/cm2
Peak flux       PL   9.32e-01  9.07e-01  6.17e-01  6.58e-01  2.72e+00  3.11e+00   ph/cm2/s
      90%_error_low -1.52e-01 -9.76e-02 -8.33e-02 -1.61e-01 -2.83e-01 -3.25e-01   ph/cm2/s
      90%_error_hi   1.58e-01  9.71e-02  8.26e-02  1.88e-01  2.84e-01  3.27e-01   ph/cm2/s

Fluence        CPL   4.66e-07  6.48e-07  6.95e-07  1.69e-06  2.27e-06  3.51e-06   erg/cm2
      90%_error_low -4.46e-08 -5.52e-08 -4.02e-08 -1.41e-07 -1.52e-07 -1.25e-07   erg/cm2
      90%_error_hi   3.07e-08  5.74e-08  4.62e-08  1.50e-07  1.60e-07  1.56e-07   erg/cm2
Peak flux      CPL   8.58e-01  9.64e-01  6.45e-01  3.58e-01  2.68e+00  2.82e+00   ph/cm2/s
      90%_error_low -1.79e-01 -1.20e-01 -9.26e-02 -1.88e-01 -2.90e-01 -3.55e-01   ph/cm2/s
      90%_error_hi   1.82e-01  1.25e-01  9.49e-02  3.65e-01  2.89e-01  4.62e-01   ph/cm2/s

======================================================================
Image
Pre-slew 15.0-350.0 keV image (Event data)
#   RAcent    DECcent   POSerr    Theta     Phi              Peak Cts       SNR   Name
  290.1988    52.4401   0.0044    35.1232  -144.9016         4.4318596     43.943 TRIG_01195887

Foreground time interval of the image:
 -5.320  13.237 (delta_t =  18.557 [sec])
Background time interval of the image:
-239.064  -5.320 (delta_t = 233.744 [sec])
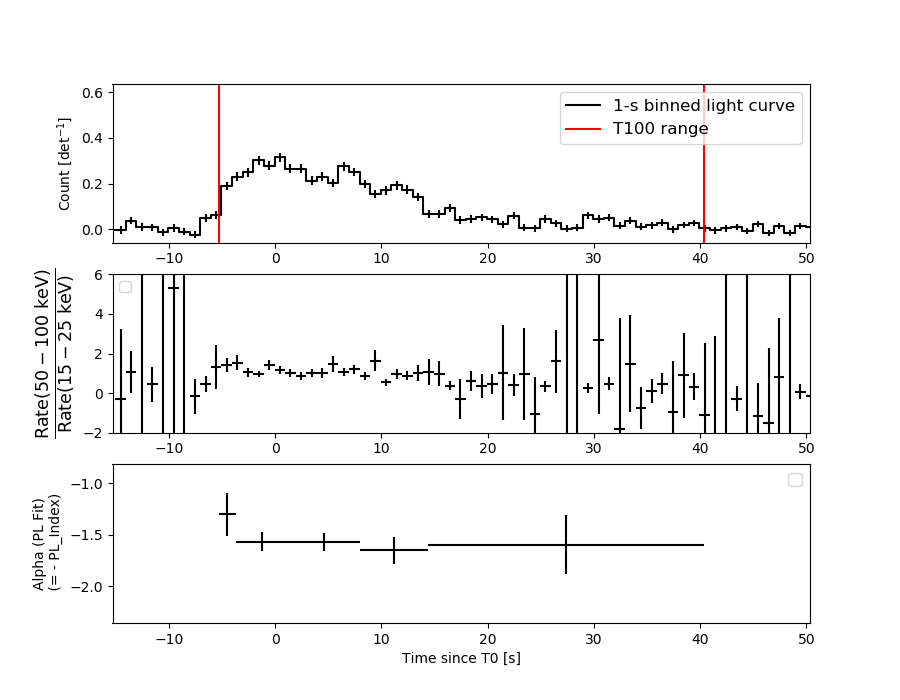
Light Curves
Note: The mask-weighted lightcurves have units of either count/det or counts/sec/det, where a det is 0.4 x 0.4 = 0.16 sq cm.
Full-time range; 1 s binning
Other quick-look light curves:
- 64 ms binning (zoomed)
- 16 ms binning (zoomed)
- 8 ms binning (zoomed)
- 2 ms binning (zoomed)
- SN=5 or 10 s binning (full-time range)
- Raw light curve
Spectra
- 64 ms binning (zoomed)
- 16 ms binning (zoomed)
- 8 ms binning (zoomed)
- 2 ms binning (zoomed)
- SN=5 or 10 s binning (full-time range)
- Raw light curve
Spectra
Notes:
- 1) The fitting includes the systematic errors.
- 2) When the burst includes telescope slew time periods, the fitting uses an average response file made from multiple 5-s response files through out the slew time plus single time preiod for the non-slew times, and weighted by the total counts in the corresponding time period using addrmf. An average response file is needed becuase a spectral fit using the pre-slew DRM will introduce some errors in both a spectral shape and a normalization if the PHA file contains a lot of the slew/post-slew time interval.
- 3) For fits to more complicated models (e.g. a power-law over a cutoff power-law), the BAT team has decided to require a chi-square improvement of more than 6 for each extra dof.
Time averaged spectrum fit using the average DRM
Power-law model
Time interval is from   -5.320 sec. to   40.340 sec.

Spectral model in power-law:
------------------------------------------------------------
Parameters  : value       lower 90%   higher 90%
Photon index: -1.57969     ( -0.0704107   0.0701956 )
Norm@50keV  : 7.86962E-03    ( -0.000309696   0.000309378 )
------------------------------------------------------------
#Fit statistic  : Chi-Squared                   53.71     using 59 bins.
 Reduced chi-squared = 0.942281
# Null hypothesis probability of 5.99e-01 with 57 degrees of freedom

Photon flux (15-150 keV)    in 45.66 sec: 1.00506 ( -0.041645  0.04174 ) ph/cm2/s
Energy fluence (15-150 keV)             : 3.3695e-06 ( -1.40667e-07  1.41134e-07 ) ergs/cm2
Cutoff power-law model
Time interval is from   -5.320 sec. to   40.340 sec.
Spectral model in the cutoff power-law:
------------------------------------------------------------
Parameters  : value       lower 90%   higher 90%
Photon index: -1.18279     ( -0.281534   0.301273 )
Epeak [keV] : 106.394      ( -25.4217 123.17 )
Norm@50keV  : 1.22841E-02    ( -0.00325353   0.00480189 )
------------------------------------------------------------
#Fit statistic  : Chi-Squared                   47.77     using 59 bins.
 Reduced chi-squared = 0.853036
# Null hypothesis probability of 7.75e-01 with 56 degrees of freedom

Photon flux (15-150 keV)    in 45.66 sec: 0.981459 ( -0.044619  0.044701 ) ph/cm2/s
Energy fluence (15-150 keV)             : 2.26535e-06 ( -1.51786e-07  1.60173e-07 ) ergs/cm2
1-s peak spectrum fit
Power-law model
Time interval is from    0.068 sec. to    1.068 sec.

Spectral model in power-law:
------------------------------------------------------------
Parameters  : value       lower 90%   higher 90%
Photon index: -1.55624     ( -0.172355   0.169486 )
Norm@50keV  : 2.14502E-02    ( -0.00231602   0.00229796 )
------------------------------------------------------------
#Fit statistic  : Chi-Squared                   66.85     using 59 bins.
 Reduced chi-squared = 1.17281
# Null hypothesis probability of 1.75e-01 with 57 degrees of freedom

Photon flux (15-150 keV)    in 1 sec: 2.72048 ( -0.2835  0.28371 ) ph/cm2/s
Energy fluence (15-150 keV)             : 2.01786e-07 ( -2.34496e-08  2.36431e-08 ) ergs/cm2
Cutoff power-law model
Time interval is from    0.068 sec. to    1.068 sec.
Spectral model in the cutoff power-law:
------------------------------------------------------------
Parameters  : value       lower 90%   higher 90%
Photon index: -1.00867     ( -0.619359   0.788987 )
Epeak [keV] : 88.0603      ( -27.7553 -88.0605 )
Norm@50keV  : 4.14900E-02    ( -0.0212228   0.0639227 )
------------------------------------------------------------
#Fit statistic  : Chi-Squared                   64.91     using 59 bins.
 Reduced chi-squared = 1.15911
# Null hypothesis probability of 1.94e-01 with 56 degrees of freedom

Photon flux (15-150 keV)    in 1 sec: 2.67765 ( -0.28981  0.28905 ) ph/cm2/s
Energy fluence (15-150 keV)             : 1.94639e-07 ( -2.52676e-08  2.53141e-08 ) ergs/cm2
Time-resolved spectra
Distribution
T90 vs. Hardness ratio plot
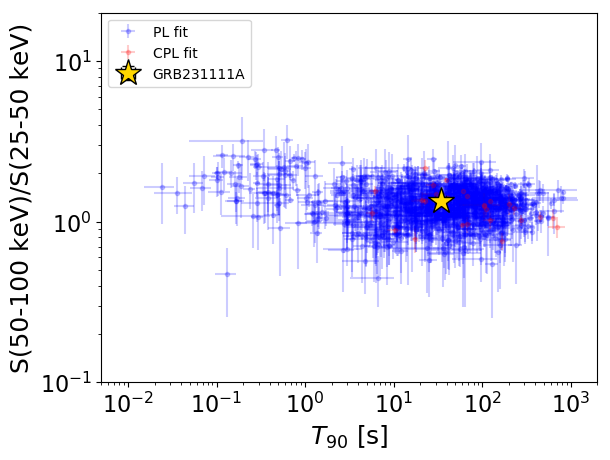
T90                                   = 34.076 sec.
Hardness ratio (energy fluence ratio) = 1.33822800624
S(15-50 keV) vs. S(50-150 keV) plot
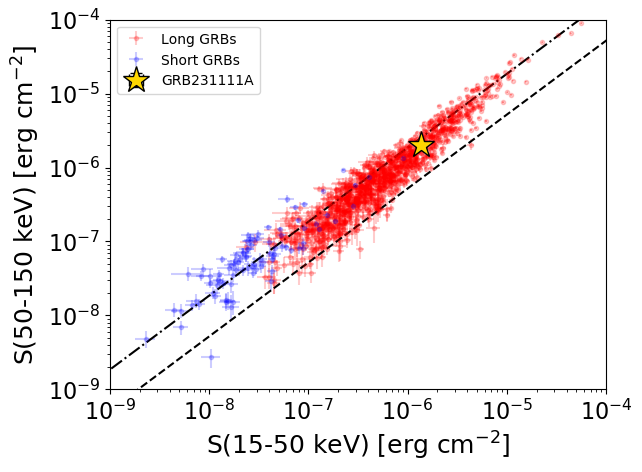
S(15-50 keV)  = 1.3599233e-06
S(50-150 keV) = 2.0096235e-06
The dash-dotted line and the dashed line traces the fluences calculated from the Band function with Epeak = 15 and 150 keV, respectively. Both lines assume a canonical values of alpha = -1 and beta = -2.5.
Mask shadow pattern
IMX = -5.755117822250061E-01, IMY = 4.044529944815041E-01
Spacecraft aspect plot
Bright source in the pre-burst/pre-slew/post-slew images
Pre-burst image of 15-350 keV band
Time interval of the image:
-239.064000 -5.320000

# RAcent  DECcent POSerr Theta    Phi  PeakCts   SNR AngSep     Name
#  [deg]    [deg]    ['] [deg]  [deg]                   [']
299.6142  35.1948    1.3  51.0 -159.0   8.0134   8.7    1.2	Cyg X-1
308.2034  40.9745    5.2  44.3 -167.0   1.3981   2.2    4.4	Cyg X-3
326.0531  38.3853    5.4  45.3  173.2   1.7871   2.1    6.8	Cyg X-2
341.7406  50.7953    2.6  32.1  156.9   2.4059   4.3 ------	UNKNOWN
Pre-slew background subtracted image of 15-350 keV band
Time interval of the image:
-5.320000 13.236590

# RAcent  DECcent POSerr Theta    Phi  PeakCts   SNR AngSep     Name
#  [deg]    [deg]    ['] [deg]  [deg]                   [']
299.6924  35.2691    5.4  50.9 -159.1  -0.4039  -2.1    6.4	Cyg X-1
307.9560  41.0976    5.1  44.2 -166.7   0.2605   2.3   11.2	Cyg X-3
326.2554  38.1584    5.5  45.5  172.9  -0.3026  -2.1   10.6	Cyg X-2
 77.6332  44.7854    2.6  44.6   50.7   1.4478   4.5 ------	UNKNOWN
  0.6335  66.7972    2.3  15.8  133.2   0.3723   5.1 ------	UNKNOWN
124.3693  45.3621    2.5  49.5    6.2   0.9749   4.6 ------	UNKNOWN
290.1988  52.4401    0.3  35.1 -144.9   4.4317  43.9 ------	UNKNOWN
Post-slew image of 15-350 keV band
Time interval of the image:
87.236590 401.636600

# RAcent  DECcent POSerr Theta    Phi  PeakCts   SNR AngSep     Name
#  [deg]    [deg]    ['] [deg]  [deg]                   [']
254.4395  35.3926    5.6  30.5  -78.4   1.3850   2.1    3.1	Her X-1
288.7725  10.9959    6.8  41.5 -146.5  -1.4142  -1.7    3.4	GRS 1915+105
299.6205  35.1989    0.5  18.5 -173.4  11.5476  22.3    1.5	Cyg X-1
308.1290  40.9178    7.6  16.8  157.8   0.8168   1.5    2.3	Cyg X-3
326.1920  38.3208  192.7  28.5  136.6   0.0409   0.1    1.0	Cyg X-2
 34.0694  74.1259    3.2  43.7   53.9   7.3578   3.6 ------	UNKNOWN
309.6326  34.5486    2.5  22.6  166.0   2.3332   4.6 ------	UNKNOWN
292.1352  53.2047    2.8   1.4   87.4   2.0903   4.2 ------	UNKNOWN
312.7755  -3.1664    2.1  58.8 -175.2  11.8019   5.4 ------	UNKNOWN
233.6059  33.1846    2.3  44.4  -61.2  10.9472   4.9 ------	UNKNOWN