Analysis Summary
Notes:
- 1) No attempt has been made to eliminate the non-significant decimal places.
- 2) This batgrbproduct analysis is done using the HEASARC data.
- 3) This batgrbproduct analysis is using the flight position for the mask-weighting calculation.
======================================================================
BAT GRB EVENT DATA PROCESSING REPORT
Process Script Ver: batgrbproduct v2.48
Process Start Time: Tue Dec 26 15:37:22 EST 2023
Host Name: batproc1
Current Working Dir: /local/data/bat1/alien/Swift_3rdBATcatalog/event/batevent_reproc/trigger1197027
======================================================================
Trigger: 01197027 Segment: 000
BAT Trigger Time: 721883032.064 [s; MET]
Trigger Stop: 721883032.192 [s; MET]
UTC: 2023-11-17T03:03:19.680140 [includes UTCF correction]
Where From?: TDRSS position message
BAT
RA: 332.409522560922 Dec: 13.5136059442377 [deg; J2000]
Catalogged Source?: NO
Point Source?: YES
GRB Indicated?: YES [ by BAT flight software ]
Image S/N Ratio: 24.19
Image Trigger?: NO
Rate S/N Ratio: 255.998046867549 [ if not an image trigger ]
Image S/N Ratio: 24.19
Analysis Position: [ source = BAT ]
RA: 332.409522560922 Dec: 13.5136059442377 [deg; J2000]
Refined Position: [ source = BAT pre-slew burst ]
RA: 332.404189217709 Dec: 13.5172795169078 [deg; J2000]
{ 22h 09m 37.0s , +13d 31' 02.2" }
+/- 0.603261094350448 [arcmin] (estimated 90% radius based on SNR)
+/- 0.186191084959103 [arcmin] (formal 1-sigma fit error)
SNR: 62.6155517748003
Angular difference between the analysis and refined position is 0.381300 arcmin
Partial Coding Fraction: 0.8359375 [ including projection effects ]
Duration
T90: 0.667999863624573 +/- 0.0729931905000922
Measured from: -0.0199999809265137
to: 0.647999882698059 [s; relative to TRIGTIME]
T50: 0.199999928474426 +/- 0.00894431669225064
Measured from: 0.0479999780654907
to: 0.247999906539917 [s; relative to TRIGTIME]
Fluence
Peak Flux (peak 1 second)
Measured from: -0.0479999780654907
to: 0.952000021934509 [s; relative to TRIGTIME]
Total Fluence
Measured from: -0.455999970436096
to: 1.30400002002716 [s; relative to TRIGTIME]
Band 1 Band 2 Band 3 Band 4
15-25 25-50 50-100 100-350 keV
Total 0.962306 1.343971 1.036657 0.290423
0.020515 0.023899 0.022056 0.014677 [error]
Peak 0.878971 1.279303 1.000736 0.285306
0.018761 0.022530 0.021103 0.013808 [error]
[ fluence units of on-axis counts / fully illuminated detector ]
======================================================================
====== Table of the duration information =============================
Value tstart tstop
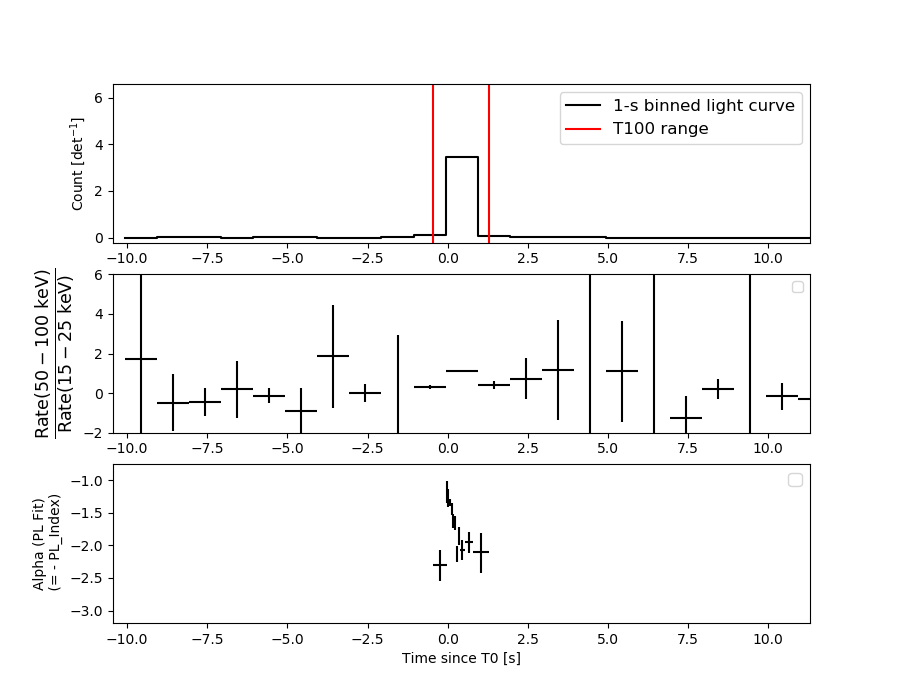
T100 1.760 -0.456 1.304
T90 0.668 -0.020 0.648
T50 0.200 0.048 0.248
Peak 1.000 -0.048 0.952
====== Spectral Analysis Summary =====================================
Model : spectral model: simple power-law (PL) and cutoff power-law (CPL)
Ph_index : photon index: E^{Ph_index}
Ph_90err : 90% error of the photon index
Epeak : Epeak in keV
Epeak_90err: 90% error of Epeak
Norm : normalization at 50 keV in both the PL model and CPL model
Nomr_90err : 90% error of the normalization
chi2 : Chi-Squared
dof : degree of freedo
=== Time-averaged spectral analysis ===
(Best model with acceptable fit: PL)
Model Ph_index Ph_90err_low Ph_90err_hi Epeak Epeak_90err_low Epeak_90err_hi Norm Nomr_90err_low Norm_90err_hi chi2 dof
PL -1.550 -0.044 0.044 - - - 1.36e-01 -3.19e-03 3.19e-03 62.420 57
CPL -1.323 -0.175 0.182 165.656 -49.533 326.339 1.73e-01 -2.83e-02 3.53e-02 57.490 56
=== 1-s peak spectral analysis ===
(Best model with acceptable fit: PL)
Model Ph_index Ph_90err_low Ph_90err_hi Epeak Epeak_90err_low Epeak_90err_hi Norm Nomr_90err_low Norm_90err_hi chi2 dof
PL -1.510 -0.043 0.043 - - - 2.28e-01 -5.32e-03 5.32e-03 60.720 57
CPL -1.261 -0.175 0.181 165.533 -46.787 235.611 2.96e-01 -4.84e-02 6.03e-02 54.740 56
=== Fluence/Peak Flux Summary ===
Model Band1 Band2 Band3 Band4 Band5 Total
15-25 25-50 50-100 100-350 15-150 15-350 keV
Fluence PL 3.20e-07 5.71e-07 7.80e-07 2.20e-06 2.25e-06 3.87e-06 erg/cm2
90%_error_low -1.48e-08 -1.55e-08 -2.25e-08 -1.41e-07 -5.52e-08 -1.54e-07 erg/cm2
90%_error_hi 1.50e-08 1.54e-08 2.24e-08 1.47e-07 5.52e-08 1.58e-07 erg/cm2
Peak flux PL 9.49e+00 9.50e+00 6.67e+00 7.42e+00 2.86e+01 3.31e+01 ph/cm2/s
90%_error_low -4.40e-01 -2.65e-01 -1.83e-01 -4.29e-01 -7.39e-01 -7.71e-01 ph/cm2/s
90%_error_hi 4.49e-01 2.64e-01 1.82e-01 4.44e-01 7.41e-01 7.71e-01 ph/cm2/s
Fluence CPL 3.03e-07 5.79e-07 7.96e-07 1.65e-06 2.22e-06 3.33e-06 erg/cm2
90%_error_low -1.93e-08 -1.67e-08 -2.59e-08 -3.18e-07 -5.98e-08 -3.21e-07 erg/cm2
90%_error_hi 1.97e-08 1.68e-08 2.60e-08 4.10e-07 5.96e-08 4.10e-07 erg/cm2
Peak flux CPL 8.90e+00 9.61e+00 6.85e+00 5.85e+00 2.81e+01 3.12e+01 ph/cm2/s
90%_error_low -5.84e-01 -2.79e-01 -2.20e-01 -8.81e-01 -8.05e-01 -1.28e+00 ph/cm2/s
90%_error_hi 5.97e-01 2.80e-01 2.22e-01 1.08e+00 8.08e-01 1.42e+00 ph/cm2/s
======================================================================
Image
Pre-slew 15.0-350.0 keV image (Event data)
#   RAcent    DECcent   POSerr    Theta     Phi              Peak Cts       SNR   Name
  332.4042    13.5173   0.0031    28.7908  -178.2153         3.6243840     62.616 TRIG_01197027

Foreground time interval of the image:
 -0.456   1.304 (delta_t =   1.760 [sec])
Background time interval of the image:
-239.064  -0.456 (delta_t = 238.608 [sec])
Light Curves
Note: The mask-weighted lightcurves have units of either count/det or counts/sec/det, where a det is 0.4 x 0.4 = 0.16 sq cm.
Full-time range; 1 s binning
Other quick-look light curves:
- 64 ms binning (zoomed)
- 16 ms binning (zoomed)
- 8 ms binning (zoomed)
- 2 ms binning (zoomed)
- SN=5 or 10 s binning (full-time range)
- Raw light curve
Spectra
- 64 ms binning (zoomed)
- 16 ms binning (zoomed)
- 8 ms binning (zoomed)
- 2 ms binning (zoomed)
- SN=5 or 10 s binning (full-time range)
- Raw light curve
Spectra
Notes:
- 1) The fitting includes the systematic errors.
- 2) When the burst includes telescope slew time periods, the fitting uses an average response file made from multiple 5-s response files through out the slew time plus single time preiod for the non-slew times, and weighted by the total counts in the corresponding time period using addrmf. An average response file is needed becuase a spectral fit using the pre-slew DRM will introduce some errors in both a spectral shape and a normalization if the PHA file contains a lot of the slew/post-slew time interval.
- 3) For fits to more complicated models (e.g. a power-law over a cutoff power-law), the BAT team has decided to require a chi-square improvement of more than 6 for each extra dof.
Time averaged spectrum fit using the average DRM
Power-law model
Time interval is from   -0.456 sec. to    1.304 sec.

Spectral model in power-law:
------------------------------------------------------------
Parameters  : value       lower 90%   higher 90%
Photon index: -1.55019     ( -0.0436437   0.0435536 )
Norm@50keV  : 0.136010    ( -0.00319437   0.00319427 )
------------------------------------------------------------
#Fit statistic  : Chi-Squared                   62.42     using 59 bins.
 Reduced chi-squared = 1.09509
# Null hypothesis probability of 2.90e-01 with 57 degrees of freedom

Photon flux (15-150 keV)    in 1.76 sec: 17.2195 ( -0.4519  0.4532 ) ph/cm2/s
Energy fluence (15-150 keV)             : 2.25379e-06 ( -5.52036e-08  5.52077e-08 ) ergs/cm2
Cutoff power-law model
Time interval is from   -0.456 sec. to    1.304 sec.
Spectral model in the cutoff power-law:
------------------------------------------------------------
Parameters  : value       lower 90%   higher 90%
Photon index: -1.3226     ( -0.175458   0.182393 )
Epeak [keV] : 165.656      ( -49.5329 326.339 )
Norm@50keV  : 0.172595    ( -0.0283084   0.0353287 )
------------------------------------------------------------
#Fit statistic  : Chi-Squared                   57.49     using 59 bins.
 Reduced chi-squared = 1.02661
# Null hypothesis probability of 4.20e-01 with 56 degrees of freedom

Photon flux (15-150 keV)    in 1.76 sec: 16.9353 ( -0.4962  0.4985 ) ph/cm2/s
Energy fluence (15-150 keV)             : 2.22471e-06 ( -5.98361e-08  5.96397e-08 ) ergs/cm2
1-s peak spectrum fit
Power-law model
Time interval is from   -0.048 sec. to    0.952 sec.

Spectral model in power-law:
------------------------------------------------------------
Parameters  : value       lower 90%   higher 90%
Photon index: -1.5104     ( -0.0428411   0.0427523 )
Norm@50keV  : 0.228392    ( -0.00531923   0.00531914 )
------------------------------------------------------------
#Fit statistic  : Chi-Squared                   60.72     using 59 bins.
 Reduced chi-squared = 1.06526
# Null hypothesis probability of 3.43e-01 with 57 degrees of freedom

Photon flux (15-150 keV)    in 1 sec: 28.5936 ( -0.7389  0.7407 ) ph/cm2/s
Energy fluence (15-150 keV)             : 2.16327e-06 ( -5.26988e-08  5.27823e-08 ) ergs/cm2
Cutoff power-law model
Time interval is from   -0.048 sec. to    0.952 sec.
Spectral model in the cutoff power-law:
------------------------------------------------------------
Parameters  : value       lower 90%   higher 90%
Photon index: -1.2611     ( -0.174696   0.181484 )
Epeak [keV] : 165.533      ( -46.7874 235.61 )
Norm@50keV  : 0.296386    ( -0.0483893   0.0602865 )
------------------------------------------------------------
#Fit statistic  : Chi-Squared                   54.74     using 59 bins.
 Reduced chi-squared = 0.9775
# Null hypothesis probability of 5.23e-01 with 56 degrees of freedom

Photon flux (15-150 keV)    in 1 sec: 28.1039 ( -0.805  0.8083 ) ph/cm2/s
Energy fluence (15-150 keV)             : 2.13413e-06 ( -5.68741e-08  5.67067e-08 ) ergs/cm2
Time-resolved spectra
Distribution
T90 vs. Hardness ratio plot
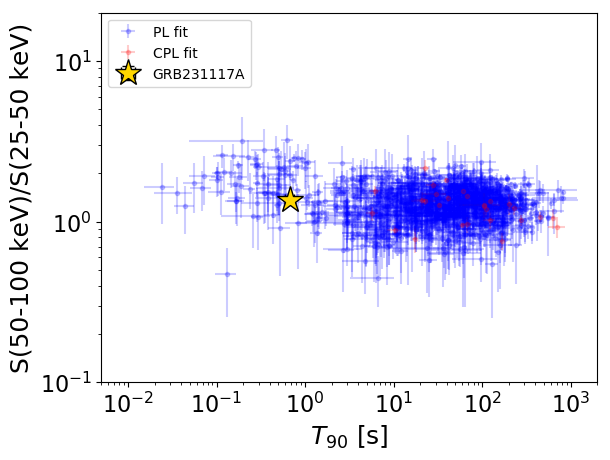
T90                                   = 0.6679999 sec.
Hardness ratio (energy fluence ratio) = 1.36587169762
S(15-50 keV) vs. S(50-150 keV) plot
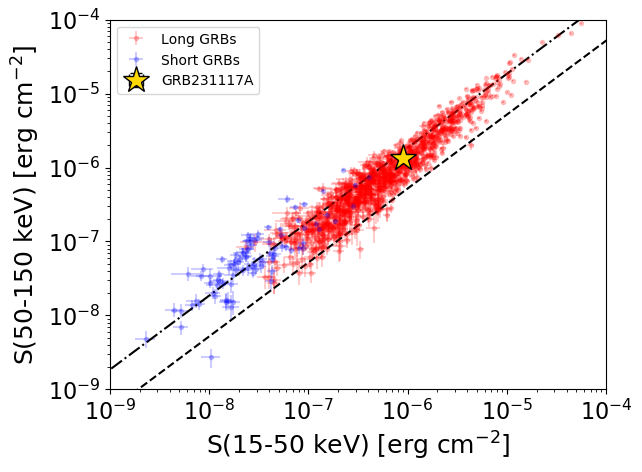
S(15-50 keV)  = 8.913825e-07
S(50-150 keV) = 1.3623977e-06
The dash-dotted line and the dashed line traces the fluences calculated from the Band function with Epeak = 15 and 150 keV, respectively. Both lines assume a canonical values of alpha = -1 and beta = -2.5.
Mask shadow pattern
IMX = -5.492785693867425E-01, IMY = 1.711529166567113E-02
Spacecraft aspect plot
Bright source in the pre-burst/pre-slew/post-slew images
Pre-burst image of 15-350 keV band
Time interval of the image:
-239.064000 -0.456000

# RAcent  DECcent POSerr Theta    Phi  PeakCts   SNR AngSep     Name
#  [deg]    [deg]    ['] [deg]  [deg]                   [']
299.6106  35.2031    0.8  25.0  -90.6   7.2020  14.5    1.0	Cyg X-1
307.9756  40.8142    7.6  17.0  -81.9   0.7471   1.5   10.3	Cyg X-3
326.1968  38.3059    4.6   5.2 -132.7   1.1141   2.5    1.5	Cyg X-2
359.3416   1.9813    2.8  47.8  145.0   5.5399   4.1  125.3	UNKNOWN
324.0712  40.6307    2.3   5.2 -100.9   2.1026   5.1 ------	UNKNOWN
308.1417  39.4463    3.0  17.2  -86.5   1.7480   3.8 ------	UNKNOWN
Pre-slew background subtracted image of 15-350 keV band
Time interval of the image:
-0.456000 1.304000

# RAcent  DECcent POSerr Theta    Phi  PeakCts   SNR AngSep     Name
#  [deg]    [deg]    ['] [deg]  [deg]                   [']
299.7522  35.2729   14.7  24.9  -90.6   0.0505   0.8    9.0	Cyg X-1
308.0232  41.0813    7.1  16.9  -81.0   0.0886   1.6    8.7	Cyg X-3
326.1788  38.1782    6.4   5.3 -133.5  -0.0880  -1.8    8.6	Cyg X-2
332.4042  13.5173    0.2  28.8 -178.2   3.6244  62.6 ------	UNKNOWN
327.2174  29.2285    2.4  13.3 -161.6   0.2318   4.8 ------	UNKNOWN
Post-slew image of 15-350 keV band
Time interval of the image:
84.836630 717.679700
720.936000 962.976000

# RAcent  DECcent POSerr Theta    Phi  PeakCts   SNR AngSep     Name
#  [deg]    [deg]    ['] [deg]  [deg]                   [']
299.6229  35.2075    0.7  36.6  -31.2  34.6895  16.4    1.6	Cyg X-1
308.3368  40.8826    0.0  34.5  -16.3   0.7504   0.4   11.1	Cyg X-3
326.2699  38.5064    0.0  25.6    5.5  -0.3406  -0.2   12.0	Cyg X-2
317.0781  60.4666    2.9  48.3    6.6   9.7613   3.9 ------	UNKNOWN
327.7328  11.0793    2.4   5.2 -100.9   7.2299   4.9 ------	UNKNOWN
315.5018   9.0429    4.0  17.2  -86.7   4.4153   2.9 ------	UNKNOWN
303.0190  33.0693    2.7  33.1  -32.2   8.2673   4.3 ------	UNKNOWN