Analysis Summary
Notes:
- 1) No attempt has been made to eliminate the non-significant decimal places.
- 2) This batgrbproduct analysis is done using the HEASARC data.
- 3) This batgrbproduct analysis is using the flight position for the mask-weighting calculation.
======================================================================
BAT GRB EVENT DATA PROCESSING REPORT
Process Script Ver: batgrbproduct v2.48
Process Start Time: Tue Dec 26 15:35:50 EST 2023
Host Name: batproc1
Current Working Dir: /local/data/bat1/alien/Swift_3rdBATcatalog/event/batevent_reproc/trigger1197311
======================================================================
Trigger: 01197311 Segment: 000
BAT Trigger Time: 722020625.6 [s; MET]
Trigger Stop: 722020626.624 [s; MET]
UTC: 2023-11-18T17:16:33.206740 [includes UTCF correction]
Where From?: TDRSS position message
BAT
RA: 4.84300825958335 Dec: -48.0355229992106 [deg; J2000]
Catalogged Source?: NO
Point Source?: YES
GRB Indicated?: YES [ by BAT flight software ]
Image S/N Ratio: 20.93
Image Trigger?: NO
Rate S/N Ratio: 109.261155036911 [ if not an image trigger ]
Image S/N Ratio: 20.93
Analysis Position: [ source = BAT ]
RA: 4.84300825958335 Dec: -48.0355229992106 [deg; J2000]
Refined Position: [ source = BAT pre-slew burst ]
RA: 4.84002144555348 Dec: -48.0435836136321 [deg; J2000]
{ 00h 19m 21.6s , -48d 02' 36.9" }
+/- 0.771656755759291 [arcmin] (estimated 90% radius based on SNR)
+/- 0.276696807313094 [arcmin] (formal 1-sigma fit error)
SNR: 44.0495021802502
Angular difference between the analysis and refined position is 0.498259 arcmin
Partial Coding Fraction: 0.5546875 [ including projection effects ]
Duration
T90: 151.488000035286 +/- 94.0267835021085
Measured from: -4.28799998760223
to: 147.200000047684 [s; relative to TRIGTIME]
T50: 6.94400000572205 +/- 7.22240067068257
Measured from: -1.27999997138977
to: 5.66400003433228 [s; relative to TRIGTIME]
Fluence
Peak Flux (peak 1 second)
Measured from: -0.0759999752044678
to: 0.924000024795532 [s; relative to TRIGTIME]
Total Fluence
Measured from: -6.84800004959106
to: 250.447999954224 [s; relative to TRIGTIME]
Band 1 Band 2 Band 3 Band 4
15-25 25-50 50-100 100-350 keV
Total 1.479493 2.282292 1.915264 0.661529
0.107738 0.112908 0.098957 0.084262 [error]
Peak 0.228087 0.405804 0.420003 0.143980
0.014191 0.017673 0.017622 0.013066 [error]
[ fluence units of on-axis counts / fully illuminated detector ]
======================================================================
====== Table of the duration information =============================
Value tstart tstop
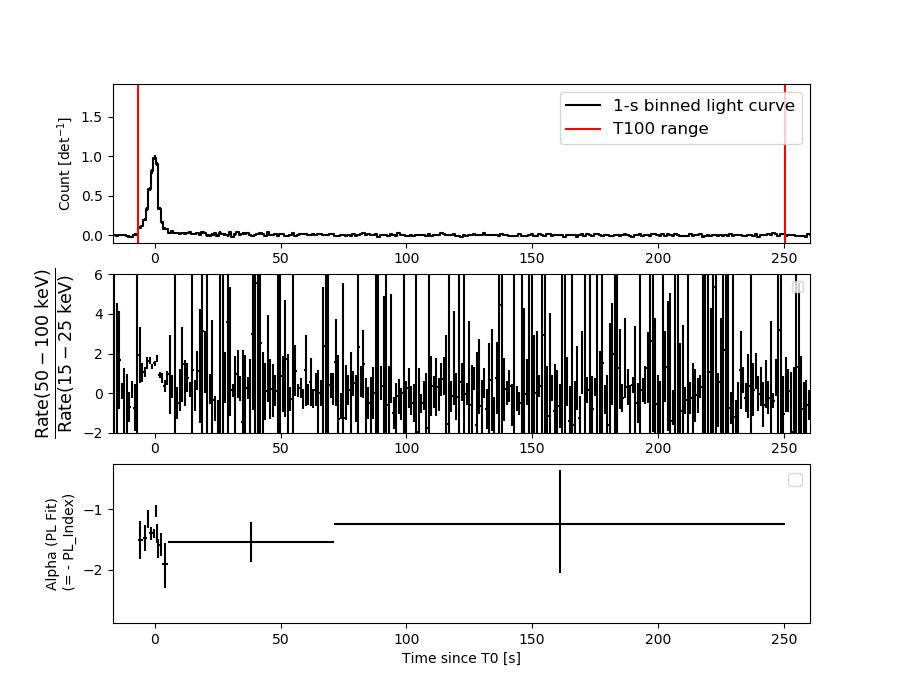
T100 257.296 -6.848 250.448
T90 151.488 -4.288 147.200
T50 6.944 -1.280 5.664
Peak 1.000 -0.076 0.924
====== Spectral Analysis Summary =====================================
Model : spectral model: simple power-law (PL) and cutoff power-law (CPL)
Ph_index : photon index: E^{Ph_index}
Ph_90err : 90% error of the photon index
Epeak : Epeak in keV
Epeak_90err: 90% error of Epeak
Norm : normalization at 50 keV in both the PL model and CPL model
Nomr_90err : 90% error of the normalization
chi2 : Chi-Squared
dof : degree of freedo
=== Time-averaged spectral analysis ===
(Best model with acceptable fit: PL)
Model Ph_index Ph_90err_low Ph_90err_hi Epeak Epeak_90err_low Epeak_90err_hi Norm Nomr_90err_low Norm_90err_hi chi2 dof
PL -1.387 -0.097 0.097 - - - 1.68e-03 -8.94e-05 8.94e-05 55.720 57
CPL -1.373 -0.111 0.330 9930.270 -9930.270 -9930.270 1.70e-03 -1.09e-04 6.95e-04 55.870 56
=== 1-s peak spectral analysis ===
(Best model with acceptable fit: N/A)
Model Ph_index Ph_90err_low Ph_90err_hi Epeak Epeak_90err_low Epeak_90err_hi Norm Nomr_90err_low Norm_90err_hi chi2 dof
PL -1.143 -0.078 0.078 - - - 8.25e-02 -3.80e-03 3.80e-03 55.800 57
CPL -0.606 -0.330 0.357 145.042 -36.884 134.505 1.46e-01 -4.20e-02 6.45e-02 47.750 56
=== Fluence/Peak Flux Summary ===
Model Band1 Band2 Band3 Band4 Band5 Total
15-25 25-50 50-100 100-350 15-150 15-350 keV
Fluence PL 4.96e-07 9.76e-07 1.49e-06 4.98e-06 4.18e-06 7.95e-06 erg/cm2
90%_error_low -4.98e-08 -5.88e-08 -9.89e-08 -7.03e-07 -2.43e-07 -7.70e-07 erg/cm2
90%_error_hi 5.14e-08 5.84e-08 9.84e-08 7.81e-07 2.44e-07 8.33e-07 erg/cm2
Peak flux PL 6.12e-04 9.28e-03 1.07e-01 9.38e+00 4.73e-01 9.40e+00 ph/cm2/s
90%_error_low N/A N/A N/A N/A N/A N/A ph/cm2/s
90%_error_hi N/A N/A N/A N/A N/A N/A ph/cm2/s
Fluence CPL 4.98e-07 9.74e-07 1.49e-06 5.01e-06 4.19e-06 7.69e-06 erg/cm2
90%_error_low -6.40e-08 -5.90e-08 -1.00e-07 -2.06e-06 -2.73e-07 -1.67e-06 erg/cm2
90%_error_hi 5.31e-08 6.38e-08 1.14e-07 7.85e-07 2.02e-07 1.05e-06 erg/cm2
Peak flux CPL 2.12e+00 3.11e+00 2.90e+00 2.57e+00 9.42e+00 1.07e+01 ph/cm2/s
90%_error_low -2.67e-01 -1.83e-01 -1.77e-01 -6.52e-01 -4.71e-01 -8.15e-01 ph/cm2/s
90%_error_hi 2.75e-01 1.85e-01 1.79e-01 9.24e-01 4.71e-01 1.01e+00 ph/cm2/s
======================================================================
Image
Pre-slew 15.0-350.0 keV image (Event data)
#   RAcent    DECcent   POSerr    Theta     Phi              Peak Cts       SNR   Name
    4.8400   -48.0436   0.0044    33.6517  -134.2177         4.8647375     44.050 TRIG_01197311

Foreground time interval of the image:
 -6.848  12.701 (delta_t =  19.549 [sec])
Background time interval of the image:
-239.600  -6.848 (delta_t = 232.752 [sec])
Light Curves
Note: The mask-weighted lightcurves have units of either count/det or counts/sec/det, where a det is 0.4 x 0.4 = 0.16 sq cm.
Full-time range; 1 s binning
Other quick-look light curves:
- 64 ms binning (zoomed)
- 16 ms binning (zoomed)
- 8 ms binning (zoomed)
- 2 ms binning (zoomed)
- SN=5 or 10 s binning (full-time range)
- Raw light curve
Spectra
- 64 ms binning (zoomed)
- 16 ms binning (zoomed)
- 8 ms binning (zoomed)
- 2 ms binning (zoomed)
- SN=5 or 10 s binning (full-time range)
- Raw light curve
Spectra
Notes:
- 1) The fitting includes the systematic errors.
- 2) When the burst includes telescope slew time periods, the fitting uses an average response file made from multiple 5-s response files through out the slew time plus single time preiod for the non-slew times, and weighted by the total counts in the corresponding time period using addrmf. An average response file is needed becuase a spectral fit using the pre-slew DRM will introduce some errors in both a spectral shape and a normalization if the PHA file contains a lot of the slew/post-slew time interval.
- 3) For fits to more complicated models (e.g. a power-law over a cutoff power-law), the BAT team has decided to require a chi-square improvement of more than 6 for each extra dof.
Time averaged spectrum fit using the average DRM
Power-law model

Time interval is from   -6.848 sec. to  250.448 sec.

Spectral model in power-law:
------------------------------------------------------------
Parameters  : value       lower 90%   higher 90%
Photon index: -1.38705     ( -0.0967608   0.0971427 )
Norm@50keV  : 1.67784E-03    ( -8.93955e-05   8.93589e-05 )
------------------------------------------------------------
#Fit statistic  : Chi-Squared                   55.72     using 59 bins.
 Reduced chi-squared = 0.977544
# Null hypothesis probability of 5.23e-01 with 57 degrees of freedom

Photon flux (15-150 keV)    in 257.3 sec: 0.203741 ( -0.011428  0.011461 ) ph/cm2/s
Energy fluence (15-150 keV)             : 4.18311e-06 ( -2.42711e-07  2.43795e-07 ) ergs/cm2
Cutoff power-law model
Time interval is from   -6.848 sec. to  250.448 sec.
Spectral model in the cutoff power-law:
------------------------------------------------------------
Parameters  : value       lower 90%   higher 90%
Photon index: -1.3732     ( -0.099298   0.341149 )
Epeak [keV] : 9930.27      ( -9999.36 -9999.36 )
Norm@50keV  : 1.70310E-03    ( -8.96053e-05   0.000714042 )
------------------------------------------------------------
#Fit statistic  : Chi-Squared                   55.87     using 59 bins.
 Reduced chi-squared = 0.997679
# Null hypothesis probability of 4.80e-01 with 56 degrees of freedom

Photon flux (15-150 keV)    in 257.3 sec: 0.203997 ( -0.012474  0.011665 ) ph/cm2/s
Energy fluence (15-150 keV)             : 4.18967e-06 ( -2.72702e-07  2.02307e-07 ) ergs/cm2
1-s peak spectrum fit
Power-law model
Time interval is from   -0.076 sec. to    0.924 sec.

Spectral model in power-law:
------------------------------------------------------------
Parameters  : value       lower 90%   higher 90%
Photon index: -1.14325     ( -0.0780846   0.0784511 )
Norm@50keV  : 8.25499E-02    ( -0.00379928   0.00379875 )
------------------------------------------------------------
#Fit statistic  : Chi-Squared                   55.80     using 59 bins.
 Reduced chi-squared = 0.978947
# Null hypothesis probability of 5.20e-01 with 57 degrees of freedom

Photon flux (15-150 keV)    in 1 sec: 0.473115 (    ) ph/cm2/s
Energy fluence (15-150 keV)             : 8.51628e-07 ( -4.30722e-08  4.32009e-08 ) ergs/cm2
Cutoff power-law model
Time interval is from   -0.076 sec. to    0.924 sec.
Spectral model in the cutoff power-law:
------------------------------------------------------------
Parameters  : value       lower 90%   higher 90%
Photon index: -0.606252     ( -0.330102   0.357336 )
Epeak [keV] : 145.042      ( -36.884 134.506 )
Norm@50keV  : 0.145644    ( -0.0420186   0.0644659 )
------------------------------------------------------------
#Fit statistic  : Chi-Squared                   47.75     using 59 bins.
 Reduced chi-squared = 0.852679
# Null hypothesis probability of 7.76e-01 with 56 degrees of freedom

Photon flux (15-150 keV)    in 1 sec: 9.42416 ( -0.47077  0.47071 ) ph/cm2/s
Energy fluence (15-150 keV)             : 1.90766e-07 ( -2.88387e-08  2.40467e-08 ) ergs/cm2
Time-resolved spectra
Distribution
T90 vs. Hardness ratio plot
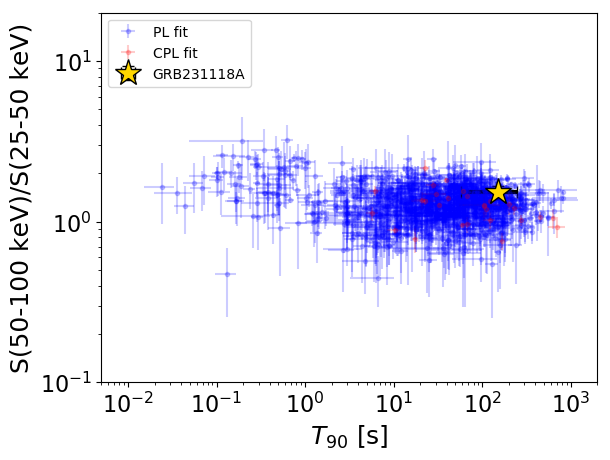
T90                                   = 151.488 sec.
Hardness ratio (energy fluence ratio) = 1.52943119797
S(15-50 keV) vs. S(50-150 keV) plot
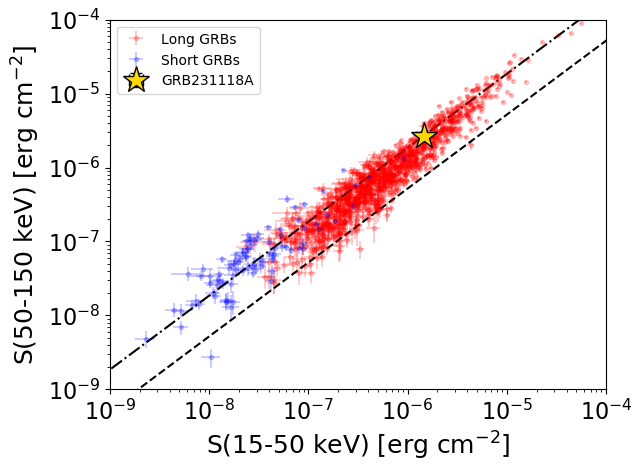
S(15-50 keV)  = 1.4724124e-06
S(50-150 keV) = 2.710759e-06
The dash-dotted line and the dashed line traces the fluences calculated from the Band function with Epeak = 15 and 150 keV, respectively. Both lines assume a canonical values of alpha = -1 and beta = -2.5.
Mask shadow pattern
IMX = -4.642506576847473E-01, IMY = 4.771047898462376E-01
Spacecraft aspect plot
Bright source in the pre-burst/pre-slew/post-slew images
Pre-burst image of 15-350 keV band
Time interval of the image:
-239.600000 -6.848000

# RAcent  DECcent POSerr Theta    Phi  PeakCts   SNR AngSep     Name
#  [deg]    [deg]    ['] [deg]  [deg]                   [']
 52.6470 -30.1047    2.9  45.7  162.8   3.3520   4.1 ------	UNKNOWN
312.7461   2.2456    2.2  55.2  -32.3   9.2798   5.3 ------	UNKNOWN
Pre-slew background subtracted image of 15-350 keV band
Time interval of the image:
-6.848000 12.700590

# RAcent  DECcent POSerr Theta    Phi  PeakCts   SNR AngSep     Name
#  [deg]    [deg]    ['] [deg]  [deg]                   [']
334.8134  30.1612    2.3  53.7   10.9   1.9574   5.0 ------	UNKNOWN
 60.7956 -46.0940    2.9  55.6 -178.9   1.2162   4.0 ------	UNKNOWN
326.8634  14.1058    2.8  48.0  -10.7   0.6643   4.0 ------	UNKNOWN
 60.2243 -56.8071    2.2  58.9 -166.8   2.7479   5.3 ------	UNKNOWN
315.7638  16.8041    2.1  58.5  -15.0   2.6172   5.5 ------	UNKNOWN
  4.8400 -48.0436    0.3  33.7 -134.2   4.8643  44.0 ------	UNKNOWN
Post-slew image of 15-350 keV band
Time interval of the image:
83.500600 962.531700

# RAcent  DECcent POSerr Theta    Phi  PeakCts   SNR AngSep     Name
#  [deg]    [deg]    ['] [deg]  [deg]                   [']
 76.2666 -48.5982    3.3  45.7  162.8  10.6251   3.5 ------	UNKNOWN
113.9720 -68.9348    3.5  52.0 -161.5   9.9853   3.3 ------	UNKNOWN