Analysis Summary
Notes:
- 1) No attempt has been made to eliminate the non-significant decimal places.
- 2) This batgrbproduct analysis is done using the HEASARC data.
- 3) This batgrbproduct analysis is using the flight position for the mask-weighting calculation.
======================================================================
                  BAT GRB EVENT DATA PROCESSING REPORT
    Process Script Ver: batgrbproduct v2.48
    Process Start Time: Tue Dec 26 15:32:31 EST 2023
             Host Name: batproc1
   Current Working Dir: /local/data/bat1/alien/Swift_3rdBATcatalog/event/batevent_reproc/trigger1199764
======================================================================

  Trigger: 01199764      Segment: 000

  BAT Trigger Time: 722927191.552   [s; MET]
      Trigger Stop: 722927192.576   [s; MET]
               UTC: 2023-11-29T05:05:59.096760    [includes UTCF correction]
       Where From?: TDRSS position message

  BAT
    RA: 317.536113005641   Dec: 41.5435082108941  [deg; J2000]

     Catalogged Source?: NO
     Point Source?:      YES
     GRB Indicated?:     YES    [ by BAT flight software ]
     Image S/N Ratio:    10.94
     Image Trigger?:     NO
     Rate S/N Ratio:     22.5166604983954  [ if not an image trigger ]
     Image S/N Ratio:    10.94

  Analysis Position:   [ source = BAT ]
    RA: 317.536113005641   Dec: 41.5435082108941  [deg; J2000]

  Refined Position:   [ source = BAT pre-slew burst ]
    RA: 317.541006827999   Dec: 41.5303277336599  [deg; J2000]
        { 21h 10m 09.8s , +41d 31' 49.2" }
         +/- 0.960403201923415 [arcmin] (estimated 90% radius based on SNR)
         +/- 0.302363079126228 [arcmin] (formal 1-sigma fit error)
    SNR: 32.2243871575495

  Angular difference between the analysis and refined position is 0.820803 arcmin

  Partial Coding Fraction: 0.4648438    [ including projection effects ]

  Duration
     T90: 106.324000000954 +/- 2.01832399649924
        Measured from: 1.91999995708466
                   to: 108.243999958038     [s; relative to TRIGTIME]
     T50: 66.5199999809265 +/- 1.33670045524915
        Measured from: 21.3359999656677
                   to: 87.8559999465942     [s; relative to TRIGTIME]


  Fluence
     Peak Flux  (peak 1 second)
        Measured from: 88.7120000123978
                   to: 89.7120000123978     [s; relative to TRIGTIME]
     Total Fluence
        Measured from: -1.74800002574921
                   to: 122.071999907494     [s; relative to TRIGTIME]

             Band 1     Band 2     Band 3     Band 4
              15-25      25-50     50-100    100-350     keV
 Total     5.992320   7.791618   5.442700   1.119425
           0.100741   0.108182   0.094911   0.075159 [error]
 Peak      0.154099   0.219204   0.098329   0.006792
           0.009586   0.010520   0.007905   0.005306 [error]

     [ fluence units of on-axis counts / fully illuminated detector ]

======================================================================


====== Table of the duration information =============================

        Value   tstart    tstop
T100  123.820   -1.748  122.072
T90   106.324    1.920  108.244
T50    66.520   21.336   87.856
Peak    1.000   88.712   89.712


====== Spectral Analysis Summary =====================================

Model      : spectral model: simple power-law (PL) and cutoff power-law (CPL)
Ph_index   : photon index: E^{Ph_index}
Ph_90err   : 90% error of the photon index
Epeak      : Epeak in keV
Epeak_90err: 90% error of Epeak
Norm       : normalization at 50 keV in both the PL model and CPL model
Nomr_90err : 90% error of the normalization
chi2       : Chi-Squared
dof        : degree of freedo

=== Time-averaged spectral analysis ===
(Best model with acceptable fit: CPL)

Model Ph_index Ph_90err_low Ph_90err_hi  Epeak  Epeak_90err_low  Epeak_90err_hi  Norm       Nomr_90err_low    Norm_90err_hi    chi2    dof
PL      -1.684    -0.039      0.039       -           -               -         1.08e-02     -2.19e-04          2.19e-04      58.180   57
CPL     -1.388    -0.165      0.171      114.047     -22.584        70.822      1.47e-02     -2.26e-03          2.79e-03      48.570   56


=== 1-s peak spectral analysis ===
(Best model with acceptable fit: CPL)

Model Ph_index Ph_90err_low Ph_90err_hi  Epeak  Epeak_90err_low  Epeak_90err_hi  Norm       Nomr_90err_low    Norm_90err_hi    chi2    dof
PL      -1.902     -0.102     0.099       -           -               -         2.75e-02     -1.89e-03          1.87e-03      80.320   57
CPL     -0.619     -0.517     0.589       47.146      -4.763         6.465      1.44e-01     -6.92e-02          1.64e-01      59.240   56


=== Fluence/Peak Flux Summary ===

              Model    Band1     Band2     Band3     Band4     Band5     Total
                       15-25     25-50    50-100    100-350    15-150    15-350    keV
Fluence         PL   2.02e-06  3.32e-06  4.14e-06  1.02e-05  1.24e-05  1.97e-05   erg/cm2
      90%_error_low -8.35e-08 -7.92e-08 -1.04e-07 -5.82e-07 -2.56e-07 -6.35e-07   erg/cm2
      90%_error_hi   8.50e-08  7.91e-08  1.04e-07  6.05e-07  2.57e-07  6.51e-07   erg/cm2
Peak flux       PL   1.67e+00  1.32e+00  7.07e-01  5.51e-01  3.94e+00  4.25e+00   ph/cm2/s
      90%_error_low -1.47e-01 -8.10e-02 -6.18e-02 -8.62e-02 -2.44e-01 -2.59e-01   ph/cm2/s
      90%_error_hi   1.50e-01  8.10e-02  6.18e-02  9.48e-02  2.44e-01  2.59e-01   ph/cm2/s

Fluence        CPL   1.88e-06  3.37e-06  4.24e-06  7.10e-06  1.21e-05  1.66e-05   erg/cm2
      90%_error_low -1.12e-07 -8.44e-08 -1.18e-07 -1.24e-06 -2.92e-07 -1.27e-06   erg/cm2
      90%_error_hi   1.14e-07  8.47e-08  1.19e-07  1.56e-06  2.91e-07  1.58e-06   erg/cm2
Peak flux      CPL   1.44e+00  1.53e+00  7.27e-01  1.46e-01  3.81e+00  3.84e+00   ph/cm2/s
      90%_error_low -1.71e-01 -1.14e-01 -7.65e-02 -6.22e-02 -2.49e-01 -2.58e-01   ph/cm2/s
      90%_error_hi   1.73e-01  1.17e-01  7.46e-02  9.47e-02  2.49e-01  2.61e-01   ph/cm2/s

======================================================================
Image
Pre-slew 15.0-350.0 keV image (Event data)
#   RAcent    DECcent   POSerr    Theta     Phi              Peak Cts       SNR   Name
  317.5410    41.5303   0.0060    42.3540   -20.5187         4.5324260     32.224 TRIG_01199764

Foreground time interval of the image:
 -1.748  17.149 (delta_t =  18.897 [sec])
Background time interval of the image:
-32.251  -1.748 (delta_t =  30.503 [sec])
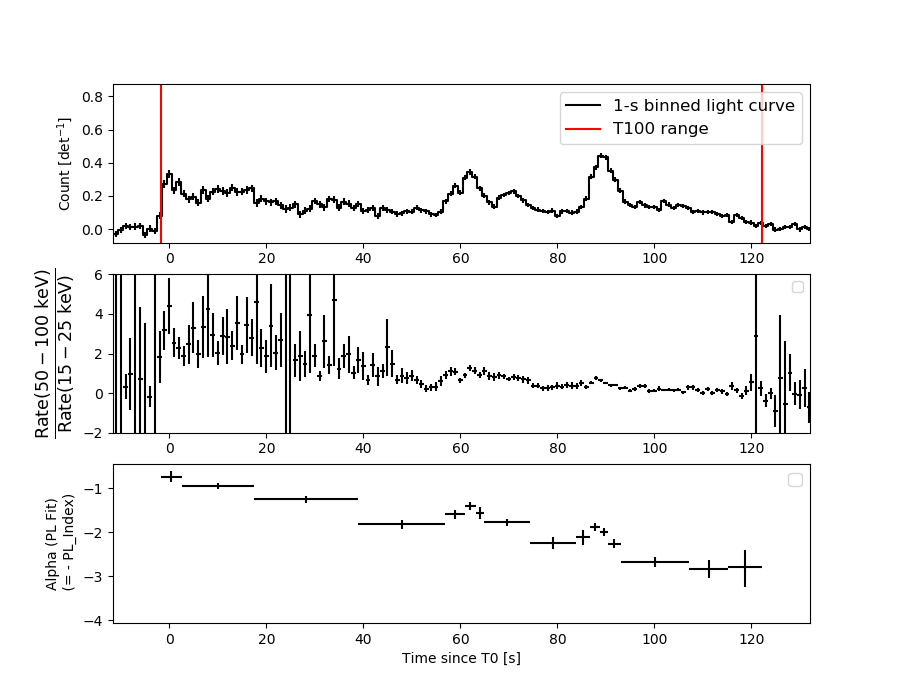
Light Curves
Note: The mask-weighted lightcurves have units of either count/det or counts/sec/det, where a det is 0.4 x 0.4 = 0.16 sq cm.
Full-time range; 1 s binning
Other quick-look light curves:
- 64 ms binning (zoomed)
- 16 ms binning (zoomed)
- 8 ms binning (zoomed)
- 2 ms binning (zoomed)
- SN=5 or 10 s binning (full-time range)
- Raw light curve
Spectra
- 64 ms binning (zoomed)
- 16 ms binning (zoomed)
- 8 ms binning (zoomed)
- 2 ms binning (zoomed)
- SN=5 or 10 s binning (full-time range)
- Raw light curve
Spectra
Notes:
- 1) The fitting includes the systematic errors.
- 2) When the burst includes telescope slew time periods, the fitting uses an average response file made from multiple 5-s response files through out the slew time plus single time preiod for the non-slew times, and weighted by the total counts in the corresponding time period using addrmf. An average response file is needed becuase a spectral fit using the pre-slew DRM will introduce some errors in both a spectral shape and a normalization if the PHA file contains a lot of the slew/post-slew time interval.
- 3) For fits to more complicated models (e.g. a power-law over a cutoff power-law), the BAT team has decided to require a chi-square improvement of more than 6 for each extra dof.
Time averaged spectrum fit using the average DRM
Power-law model
Time interval is from   -1.748 sec. to  122.072 sec.

Spectral model in power-law:
------------------------------------------------------------
Parameters  : value       lower 90%   higher 90%
Photon index: -1.68358     ( -0.0394022   0.0393366 )
Norm@50keV  : 1.07732E-02    ( -0.000219114   0.000219107 )
------------------------------------------------------------
#Fit statistic  : Chi-Squared                   58.18     using 59 bins.
 Reduced chi-squared = 1.0207
# Null hypothesis probability of 4.32e-01 with 57 degrees of freedom

Photon flux (15-150 keV)    in 123.8 sec: 1.42275 ( -0.03406  0.0342 ) ph/cm2/s
Energy fluence (15-150 keV)             : 1.23672e-05 ( -2.56436e-07  2.56641e-07 ) ergs/cm2
Cutoff power-law model
Time interval is from   -1.748 sec. to  122.072 sec.
Spectral model in the cutoff power-law:
------------------------------------------------------------
Parameters  : value       lower 90%   higher 90%
Photon index: -1.3877     ( -0.164591   0.170709 )
Epeak [keV] : 114.047      ( -22.5842 70.8221 )
Norm@50keV  : 1.46684E-02    ( -0.0022633   0.00278643 )
------------------------------------------------------------
#Fit statistic  : Chi-Squared                   48.57     using 59 bins.
 Reduced chi-squared = 0.867321
# Null hypothesis probability of 7.49e-01 with 56 degrees of freedom

Photon flux (15-150 keV)    in 123.8 sec: 1.38528 ( -0.03908  0.03936 ) ph/cm2/s
Energy fluence (15-150 keV)             : 1.21172e-05 ( -2.91629e-07  2.90521e-07 ) ergs/cm2
1-s peak spectrum fit
Power-law model
Time interval is from   88.712 sec. to   89.712 sec.

Spectral model in power-law:
------------------------------------------------------------
Parameters  : value       lower 90%   higher 90%
Photon index: -1.90241     ( -0.101738   0.0993167 )
Norm@50keV  : 2.74505E-02    ( -0.00189056   0.00187497 )
------------------------------------------------------------
#Fit statistic  : Chi-Squared                   80.32     using 59 bins.
 Reduced chi-squared = 1.40912
# Null hypothesis probability of 2.26e-02 with 57 degrees of freedom

Photon flux (15-150 keV)    in 1 sec: 3.94373 ( -0.24399  0.24413 ) ph/cm2/s
Energy fluence (15-150 keV)             : 2.52418e-07 ( -1.71353e-08  1.72379e-08 ) ergs/cm2
Cutoff power-law model
Time interval is from   88.712 sec. to   89.712 sec.
Spectral model in the cutoff power-law:
------------------------------------------------------------
Parameters  : value       lower 90%   higher 90%
Photon index: -0.619354     ( -0.516689   0.589107 )
Epeak [keV] : 47.1456      ( -4.76258 6.4657 )
Norm@50keV  : 0.143501    ( -0.069219   0.163836 )
------------------------------------------------------------
#Fit statistic  : Chi-Squared                   59.24     using 59 bins.
 Reduced chi-squared = 1.05786
# Null hypothesis probability of 3.58e-01 with 56 degrees of freedom

Photon flux (15-150 keV)    in 1 sec: 3.81466 ( -0.24913  0.24939 ) ph/cm2/s
Energy fluence (15-150 keV)             : 2.32049e-07 ( -1.82676e-08  1.86427e-08 ) ergs/cm2
Time-resolved spectra
Distribution
T90 vs. Hardness ratio plot
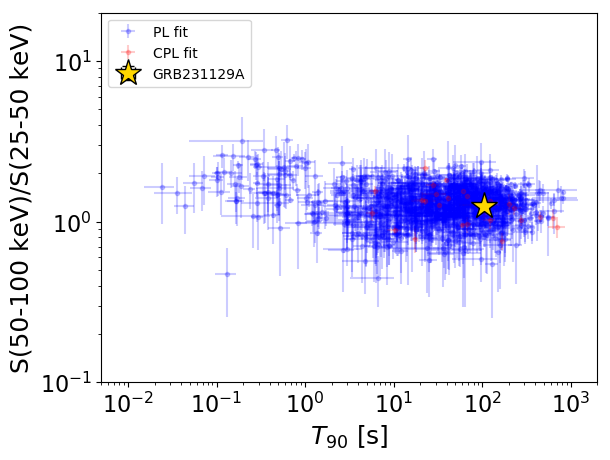
T90                                   = 106.324 sec.
Hardness ratio (energy fluence ratio) = 1.25649269566
S(15-50 keV) vs. S(50-150 keV) plot
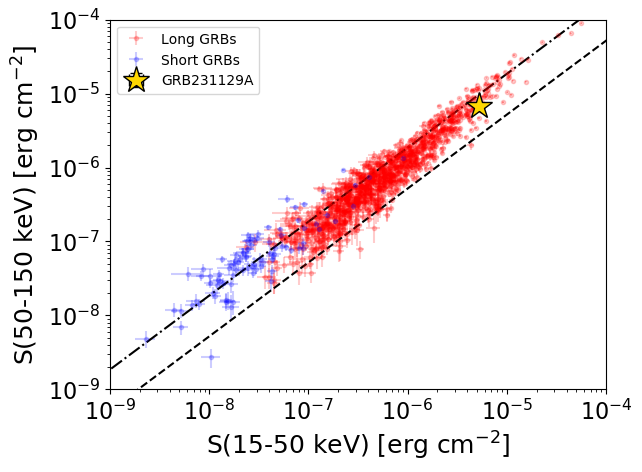
S(15-50 keV)  = 5.24811e-06
S(50-150 keV) = 6.868973e-06
The dash-dotted line and the dashed line traces the fluences calculated from the Band function with Epeak = 15 and 150 keV, respectively. Both lines assume a canonical values of alpha = -1 and beta = -2.5.
Mask shadow pattern
IMX = 8.538162070997549E-01, IMY = 3.195459684732280E-01
Spacecraft aspect plot
Bright source in the pre-burst/pre-slew/post-slew images
Pre-burst image of 15-350 keV band
Time interval of the image:
-32.251400 -1.748000

# RAcent  DECcent POSerr Theta    Phi  PeakCts   SNR AngSep     Name
#  [deg]    [deg]    ['] [deg]  [deg]                   [']
299.6535  35.2002    3.8  52.3  -36.5   1.0101   3.0    3.1	Cyg X-1
308.0221  40.8356   12.9  48.1  -26.7  -0.1504  -0.9    8.1	Cyg X-3
326.2725  38.4367  269.7  35.3  -17.2   0.0043   0.0    8.4	Cyg X-2
315.3641  50.2504    2.2  49.0  -12.4   0.9285   5.1 ------	UNKNOWN
313.5159  34.8716    2.2  41.5  -31.5   0.6418   5.2 ------	UNKNOWN
Pre-slew background subtracted image of 15-350 keV band
Time interval of the image:
-1.748000 17.148600

# RAcent  DECcent POSerr Theta    Phi  PeakCts   SNR AngSep     Name
#  [deg]    [deg]    ['] [deg]  [deg]                   [']
299.6107  35.1513   11.1  52.3  -36.6  -0.3942  -1.0    3.2	Cyg X-1
308.1274  41.1351    5.0  48.1  -26.3   0.4455   2.3   11.0	Cyg X-3
326.1656  38.3173   25.4  35.3  -17.4   0.0495   0.5    0.4	Cyg X-2
 28.9539  26.1490    2.4  39.2   78.4   1.3527   4.9 ------	UNKNOWN
319.2085  59.4478    2.5  54.1   -2.2   1.4598   4.6 ------	UNKNOWN
319.7056  38.5871    2.6  39.3  -22.6   0.5356   4.4 ------	UNKNOWN
317.5410  41.5303    0.4  42.4  -20.5   4.5325  32.2 ------	UNKNOWN
321.9086 -22.7670    2.6  43.8 -123.1   1.3289   4.4 ------	UNKNOWN
Post-slew image of 15-350 keV band
Time interval of the image:
99.948610 476.748600

# RAcent  DECcent POSerr Theta    Phi  PeakCts   SNR AngSep     Name
#  [deg]    [deg]    ['] [deg]  [deg]                   [']
254.5268  35.3941    5.6  48.6  -48.1  -6.2903  -2.1    4.6	Her X-1
288.8882  10.8638   45.9  39.6 -105.1   0.5386   0.3    7.2	GRS 1915+105
299.5858  35.1851    0.4  15.4  -81.1  18.7038  27.8    1.0	Cyg X-1
308.0862  41.0012    2.4   7.1  -63.8   3.0695   4.8    3.1	Cyg X-3
326.1165  38.2453    4.2   7.4  141.1   1.7415   2.7    5.3	Cyg X-2
  1.8586  51.0318    3.6  31.6   84.6   4.2980   3.2 ------	UNKNOWN
336.6650  62.3640    3.2  23.7   49.7   2.9769   3.5 ------	UNKNOWN
341.7662  14.3445    2.5  34.4  162.6   4.2576   4.7 ------	UNKNOWN
334.9901  15.2964    2.7  30.3  172.3   3.5149   4.3 ------	UNKNOWN
263.8728  46.3134    2.1  38.2  -36.7   5.2737   5.7 ------	UNKNOWN
261.1624  36.9663    3.4  43.1  -49.3   5.2503   3.5 ------	UNKNOWN