Analysis Summary
Notes:
- 1) No attempt has been made to eliminate the non-significant decimal places.
- 2) This batgrbproduct analysis is done using the HEASARC data.
- 3) This batgrbproduct analysis is using the flight position for the mask-weighting calculation.
======================================================================
                  BAT GRB EVENT DATA PROCESSING REPORT
    Process Script Ver: batgrbproduct v2.48
    Process Start Time: Tue Dec 26 15:30:18 EST 2023
             Host Name: batproc1
   Current Working Dir: /local/data/bat1/alien/Swift_3rdBATcatalog/event/batevent_reproc/trigger1200812
======================================================================

  Trigger: 01200812      Segment: 000

  BAT Trigger Time: 723487472   [s; MET]
      Trigger Stop: 723487536   [s; MET]
               UTC: 2023-12-05T16:43:59.506460    [includes UTCF correction]
       Where From?: TDRSS position message

  BAT
    RA: 54.1545616599091   Dec: 27.146354688855  [deg; J2000]

     Catalogged Source?: NO
     Point Source?:      YES
     GRB Indicated?:     YES    [ by BAT flight software ]
     Image S/N Ratio:    16.23
     Image Trigger?:     YES
     Rate S/N Ratio:     0  [ if not an image trigger ]
     Image S/N Ratio:    16.23

  Analysis Position:   [ source = BAT ]
    RA: 54.1545616599091   Dec: 27.146354688855  [deg; J2000]

  Refined Position:   [ source = BAT pre-slew burst ]
    RA: 54.1505267917781   Dec: 27.1462970484266  [deg; J2000]
        { 03h 36m 36.1s , +27d 08' 46.7" }
         +/- 0.97814002710332 [arcmin] (estimated 90% radius based on SNR)
         +/- 0.410163277288769 [arcmin] (formal 1-sigma fit error)
    SNR: 31.3928823456744

  Angular difference between the analysis and refined position is 0.215452 arcmin

  Partial Coding Fraction: 0.5078125    [ including projection effects ]

  Duration
     T90: 64 +/- 16
        Measured from: -31
                   to: 33     [s; relative to TRIGTIME]
     T50: 16 +/- 16
        Measured from: -15
                   to: 1     [s; relative to TRIGTIME]


  Fluence
     Peak Flux  (peak 1 second)
        Measured from: -7.5
                   to: -6.5     [s; relative to TRIGTIME]
     Total Fluence
        Measured from: -31
                   to: 81     [s; relative to TRIGTIME]

             Band 1     Band 2     Band 3     Band 4
              15-25      25-50     50-100    100-350     keV
 Total     2.768013   4.058473   3.439446   1.021334
           0.101446   0.106947   0.093032   0.074000 [error]
 Peak      0.043035   0.098737   0.065070   0.024565
           0.010079   0.011675   0.010116   0.008259 [error]

     [ fluence units of on-axis counts / fully illuminated detector ]

======================================================================


====== Table of the duration information =============================

        Value   tstart    tstop
T100  112.000  -31.000   81.000
T90    64.000  -31.000   33.000
T50    16.000  -15.000    1.000
Peak    1.000   -7.500   -6.500


====== Spectral Analysis Summary =====================================

Model      : spectral model: simple power-law (PL) and cutoff power-law (CPL)
Ph_index   : photon index: E^{Ph_index}
Ph_90err   : 90% error of the photon index
Epeak      : Epeak in keV
Epeak_90err: 90% error of Epeak
Norm       : normalization at 50 keV in both the PL model and CPL model
Nomr_90err : 90% error of the normalization
chi2       : Chi-Squared
dof        : degree of freedo

=== Time-averaged spectral analysis ===
(Best model with acceptable fit: PL)

Model Ph_index Ph_90err_low Ph_90err_hi  Epeak  Epeak_90err_low  Epeak_90err_hi  Norm       Nomr_90err_low    Norm_90err_hi    chi2    dof
PL      -1.392    -0.057      0.057       -           -               -         6.96e-03     -2.10e-04          2.10e-04      39.810   57
CPL     -1.353    -0.140      0.169      931.580    -931.580      -931.580      7.25e-03     -4.75e-04          1.26e-03      39.990   56


=== 1-s peak spectral analysis ===
(Best model with acceptable fit: PL)

Model Ph_index Ph_90err_low Ph_90err_hi  Epeak  Epeak_90err_low  Epeak_90err_hi  Norm       Nomr_90err_low    Norm_90err_hi    chi2    dof
PL      -1.248     -0.221     0.228       -           -               -         1.58e-02     -2.21e-03          2.21e-03      59.370   57
CPL     -0.578     -0.772     1.192      104.474     -40.998      -104.474      3.54e-02     -2.10e-02          1.12e-01      57.930   56


=== Fluence/Peak Flux Summary ===

              Model    Band1     Band2     Band3     Band4     Band5     Total
                       15-25     25-50    50-100    100-350    15-150    15-350    keV
Fluence         PL   9.00e-07  1.77e-06  2.69e-06  8.94e-06  7.55e-06  1.43e-05   erg/cm2
      90%_error_low -5.62e-08 -6.45e-08 -9.62e-08 -7.24e-07 -2.39e-07 -7.72e-07   erg/cm2
      90%_error_hi   5.76e-08  6.42e-08  9.58e-08  7.68e-07  2.39e-07  8.06e-07   erg/cm2
Peak flux       PL   5.11e-01  5.98e-01  5.04e-01  7.17e-01  1.87e+00  2.33e+00   ph/cm2/s
      90%_error_low -1.25e-01 -9.70e-02 -8.04e-02 -2.07e-01 -2.70e-01 -3.36e-01   ph/cm2/s
      90%_error_hi   1.33e-01  9.53e-02  7.96e-02  2.54e-01  2.70e-01  3.40e-01   ph/cm2/s

Fluence        CPL   9.03e-07  1.77e-06  2.69e-06  9.07e-06  7.56e-06  1.44e-05   erg/cm2
      90%_error_low -7.84e-08 -6.45e-08 -9.80e-08 -2.22e-06 -2.63e-07 -2.33e-06   erg/cm2
      90%_error_hi   5.93e-08  3.39e-08  1.08e-07  5.65e-07  1.28e-07  3.80e-07   erg/cm2
Peak flux      CPL   4.64e-01  6.49e-01  5.35e-01  3.39e-01  1.85e+00  1.99e+00   ph/cm2/s
      90%_error_low -1.40e-01 -1.21e-01 -9.23e-02 -2.22e-01 -2.72e-01 -3.51e-01   ph/cm2/s
      90%_error_hi   1.48e-01  1.30e-01  9.54e-02  4.65e-01  2.73e-01  5.50e-01   ph/cm2/s

======================================================================
Image
Pre-slew 15.0-350.0 keV image (Event data)
#   RAcent    DECcent   POSerr    Theta     Phi              Peak Cts       SNR   Name
   54.1505    27.1463   0.0061    31.9898    36.9517         9.2384534     31.393 TRIG_01200812

Foreground time interval of the image:
-16.899  72.901 (delta_t =  89.800 [sec])
Background time interval of the image:
Light Curves
Note: The mask-weighted lightcurves have units of either count/det or counts/sec/det, where a det is 0.4 x 0.4 = 0.16 sq cm.
Full-time range; 1 s binning
Other quick-look light curves:
- 64 ms binning (zoomed)
- 16 ms binning (zoomed)
- 8 ms binning (zoomed)
- 2 ms binning (zoomed)
- SN=5 or 10 s binning (full-time range)
- Raw light curve
Spectra
- 64 ms binning (zoomed)
- 16 ms binning (zoomed)
- 8 ms binning (zoomed)
- 2 ms binning (zoomed)
- SN=5 or 10 s binning (full-time range)
- Raw light curve
Spectra
Notes:
- 1) The fitting includes the systematic errors.
- 2) When the burst includes telescope slew time periods, the fitting uses an average response file made from multiple 5-s response files through out the slew time plus single time preiod for the non-slew times, and weighted by the total counts in the corresponding time period using addrmf. An average response file is needed becuase a spectral fit using the pre-slew DRM will introduce some errors in both a spectral shape and a normalization if the PHA file contains a lot of the slew/post-slew time interval.
- 3) For fits to more complicated models (e.g. a power-law over a cutoff power-law), the BAT team has decided to require a chi-square improvement of more than 6 for each extra dof.
Time averaged spectrum fit using the average DRM
Power-law model

Time interval is from  -31.000 sec. to   81.000 sec.

Spectral model in power-law:
------------------------------------------------------------
Parameters  : value       lower 90%   higher 90%
Photon index: -1.39231     ( -0.0571092   0.0572663 )
Norm@50keV  : 6.96323E-03    ( -0.000210158   0.000210103 )
------------------------------------------------------------
#Fit statistic  : Chi-Squared                   39.81     using 59 bins.
 Reduced chi-squared = 0.698421
# Null hypothesis probability of 9.59e-01 with 57 degrees of freedom

Photon flux (15-150 keV)    in 112 sec: 0.846538 ( -0.028379  0.028512 ) ph/cm2/s
Energy fluence (15-150 keV)             : 7.54863e-06 ( -2.3879e-07  2.39047e-07 ) ergs/cm2
Cutoff power-law model
Time interval is from  -31.000 sec. to   81.000 sec.
Spectral model in the cutoff power-law:
------------------------------------------------------------
Parameters  : value       lower 90%   higher 90%
Photon index: -1.38885     ( -0.139783   0.169389 )
Epeak [keV] : 9998.76      ( -9998.76 -9998.76 )
Norm@50keV  : 6.98848E-03    ( -0.000210545   0.00152295 )
------------------------------------------------------------
#Fit statistic  : Chi-Squared                   39.82     using 59 bins.
 Reduced chi-squared = 0.711071
# Null hypothesis probability of 9.50e-01 with 56 degrees of freedom

Photon flux (15-150 keV)    in 112 sec: 0.847495 ( -0.033044  0.029149 ) ph/cm2/s
Energy fluence (15-150 keV)             : 7.55559e-06 ( -2.63228e-07  1.28071e-07 ) ergs/cm2
1-s peak spectrum fit
Power-law model
Time interval is from   -7.500 sec. to   -6.500 sec.

Spectral model in power-law:
------------------------------------------------------------
Parameters  : value       lower 90%   higher 90%
Photon index: -1.24754     ( -0.220897   0.228285 )
Norm@50keV  : 1.58141E-02    ( -0.00221235   0.00221235 )
------------------------------------------------------------
#Fit statistic  : Chi-Squared                   59.37     using 59 bins.
 Reduced chi-squared = 1.04158
# Null hypothesis probability of 3.89e-01 with 57 degrees of freedom

Photon flux (15-150 keV)    in 1 sec: 1.86965 ( -0.26955  0.27011 ) ph/cm2/s
Energy fluence (15-150 keV)             : 1.58387e-07 ( -2.39496e-08  2.4116e-08 ) ergs/cm2
Cutoff power-law model
Time interval is from   -7.500 sec. to   -6.500 sec.
Spectral model in the cutoff power-law:
------------------------------------------------------------
Parameters  : value       lower 90%   higher 90%
Photon index: -0.578462     ( -0.771893   1.19231 )
Epeak [keV] : 104.474      ( -41.0215 -104.498 )
Norm@50keV  : 3.53781E-02    ( -0.020989   0.112507 )
------------------------------------------------------------
#Fit statistic  : Chi-Squared                   57.93     using 59 bins.
 Reduced chi-squared = 1.03446
# Null hypothesis probability of 4.04e-01 with 56 degrees of freedom

Photon flux (15-150 keV)    in 1 sec: 1.84533 ( -0.27216  0.27253 ) ph/cm2/s
Energy fluence (15-150 keV)             : 1.50845e-07 ( -2.72872e-08  2.66352e-08 ) ergs/cm2
Time-resolved spectra
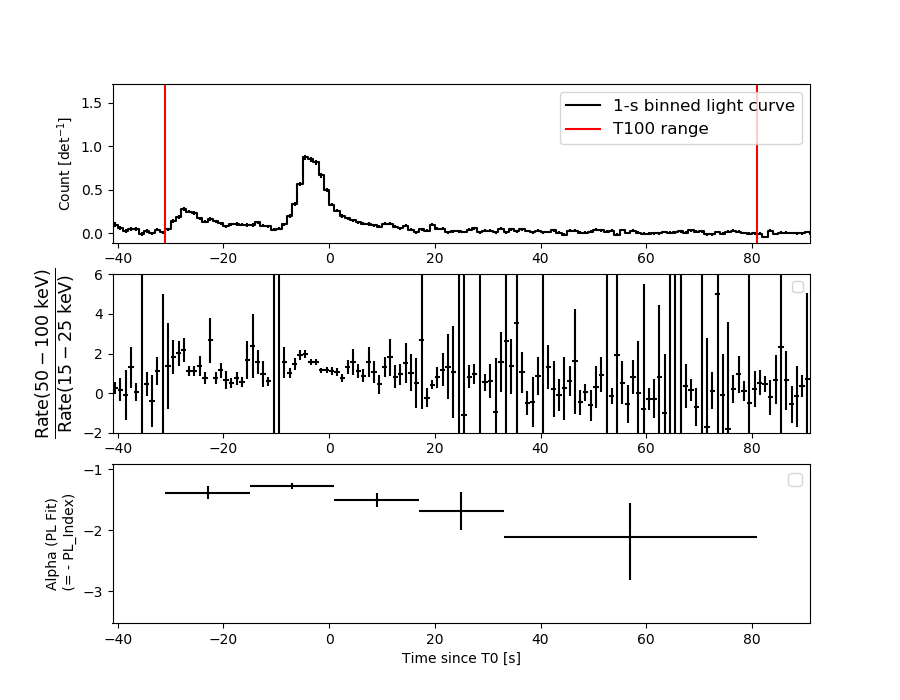
Distribution
T90 vs. Hardness ratio plot
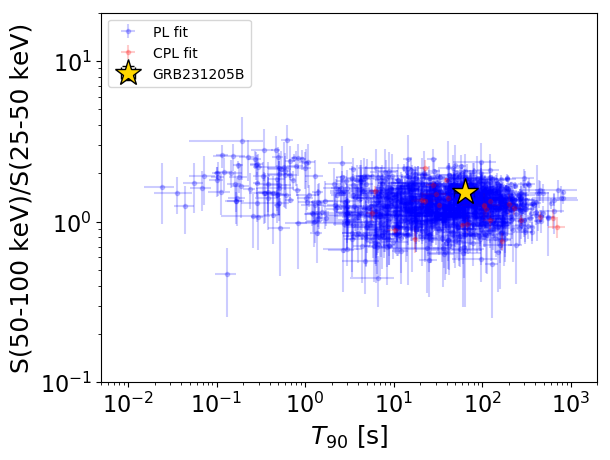
T90                                   = 64.0 sec.
Hardness ratio (energy fluence ratio) = 1.52384318235
S(15-50 keV) vs. S(50-150 keV) plot
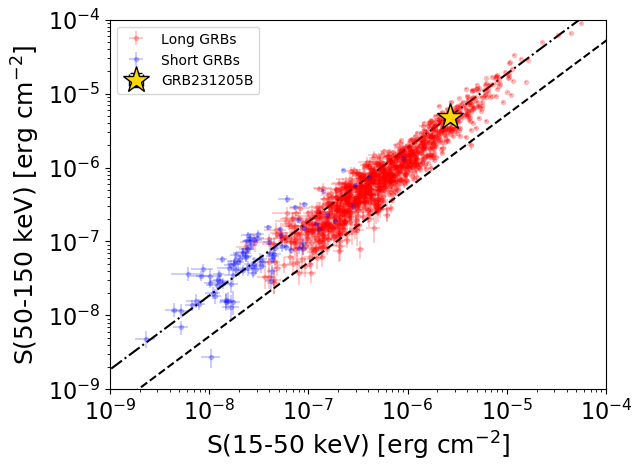
S(15-50 keV)  = 2.6673269e-06
S(50-150 keV) = 4.881258e-06
The dash-dotted line and the dashed line traces the fluences calculated from the Band function with Epeak = 15 and 150 keV, respectively. Both lines assume a canonical values of alpha = -1 and beta = -2.5.
Mask shadow pattern
IMX = 4.991616332418481E-01, IMY = -3.754864819192321E-01
Spacecraft aspect plot
Bright source in the pre-burst/pre-slew/post-slew images
Pre-burst image of 15-350 keV band
Time interval of the image:
Pre-slew background subtracted image of 15-350 keV band
Time interval of the image:
-16.899410 72.900600

# RAcent  DECcent POSerr Theta    Phi  PeakCts   SNR AngSep     Name
#  [deg]    [deg]    ['] [deg]  [deg]                   [']
 83.6525  22.0451    1.0  24.6   94.6   3.6644  11.7    2.1	Crab
105.6410  10.9587    2.7  35.0  139.1   1.5327   4.3 ------	UNKNOWN
 54.1505  27.1463    0.4  32.0   37.0   9.2393  31.4 ------	UNKNOWN
 45.8368  25.2114    3.7  35.6   24.7   0.9673   3.1 ------	UNKNOWN
 90.8596   0.2377    2.7  18.8  158.0   0.8172   4.3 ------	UNKNOWN
116.1753 -27.9139    4.0  50.7 -164.4   1.4636   2.9 ------	UNKNOWN
 42.4116  -8.5877    2.8  30.9  -39.2   1.0655   4.2 ------	UNKNOWN
 99.0709 -43.2234    3.6  49.7 -137.6   2.2356   3.2 ------	UNKNOWN
 36.9294 -27.4887    3.5  43.7  -64.1   3.3571   3.4 ------	UNKNOWN
Post-slew image of 15-350 keV band
Time interval of the image:
214.300630 599.400600

# RAcent  DECcent POSerr Theta    Phi  PeakCts   SNR AngSep     Name
#  [deg]    [deg]    ['] [deg]  [deg]                   [']
 83.6282  22.0254    0.6  27.2   81.9  16.3503  18.0    0.7	Crab
 88.7334  36.4808    3.3  30.6   51.1   2.9559   3.5 ------	UNKNOWN
 48.4338  27.1317    2.6   5.1 -100.9   2.3917   4.3 ------	UNKNOWN
 25.0957 -22.6632    2.6  57.2 -160.1  11.8551   4.4 ------	UNKNOWN
  3.9163  45.2645    3.0  43.6  -64.1  10.6604   3.8 ------	UNKNOWN
 12.5813   0.4449    2.6  48.0 -129.0  11.8285   4.3 ------	UNKNOWN