Analysis Summary
Notes:
- 1) No attempt has been made to eliminate the non-significant decimal places.
- 2) This batgrbproduct analysis is done using the HEASARC data.
- 3) This batgrbproduct analysis is using the flight position for the mask-weighting calculation.
======================================================================
                  BAT GRB EVENT DATA PROCESSING REPORT
    Process Script Ver: batgrbproduct v2.48
    Process Start Time: Tue Dec 26 15:28:49 EST 2023
             Host Name: batproc1
   Current Working Dir: /local/data/bat1/alien/Swift_3rdBATcatalog/event/batevent_reproc/trigger1201696
======================================================================

  Trigger: 01201696      Segment: 000

  BAT Trigger Time: 723936577.024   [s; MET]
      Trigger Stop: 723936579.072   [s; MET]
               UTC: 2023-12-10T21:29:04.499760    [includes UTCF correction]
       Where From?: TDRSS position message

  BAT
    RA: 95.7721784977718   Dec: -48.3592989761389  [deg; J2000]

     Catalogged Source?: NO
     Point Source?:      YES
     GRB Indicated?:     YES    [ by BAT flight software ]
     Image S/N Ratio:    7.31
     Image Trigger?:     NO
     Rate S/N Ratio:     14.5258390463339  [ if not an image trigger ]
     Image S/N Ratio:    7.31

  Analysis Position:   [ source = BAT ]
    RA: 95.7721784977718   Dec: -48.3592989761389  [deg; J2000]

  Refined Position:   [ source = BAT pre-slew burst ]
    RA: 95.8029273090081   Dec: -48.33462905801  [deg; J2000]
        { 06h 23m 12.7s , -48d 20' 04.7" }
         +/- 1.76124979931963 [arcmin] (estimated 90% radius based on SNR)
         +/- 0.831462225112337 [arcmin] (formal 1-sigma fit error)
    SNR: 13.5501962366866

  Angular difference between the analysis and refined position is 1.922102 arcmin

  Partial Coding Fraction: 0.1757812    [ including projection effects ]

  Duration
     T90: 7.47200012207031 +/- 0.647950639186933
        Measured from: 0.00799989700317383
                   to: 7.48000001907349     [s; relative to TRIGTIME]
     T50: 4.04800009727478 +/- 0.892134507562476
        Measured from: 0.791999936103821
                   to: 4.8400000333786     [s; relative to TRIGTIME]


  Fluence
     Peak Flux  (peak 1 second)
        Measured from: -0.236000061035156
                   to: 0.763999938964844     [s; relative to TRIGTIME]
     Total Fluence
        Measured from: -0.23199999332428
                   to: 7.81599998474121     [s; relative to TRIGTIME]

             Band 1     Band 2     Band 3     Band 4
              15-25      25-50     50-100    100-350     keV
 Total     0.355790   0.603001   0.723198   0.239182
           0.064681   0.074500   0.070092   0.065404 [error]
 Peak      0.098924   0.176927   0.149546   0.059458
           0.024763   0.028756   0.026426   0.023517 [error]

     [ fluence units of on-axis counts / fully illuminated detector ]

======================================================================


====== Table of the duration information =============================

        Value   tstart    tstop
T100    8.048   -0.232    7.816
T90     7.472    0.008    7.480
T50     4.048    0.792    4.840
Peak    1.000   -0.236    0.764


====== Spectral Analysis Summary =====================================

Model      : spectral model: simple power-law (PL) and cutoff power-law (CPL)
Ph_index   : photon index: E^{Ph_index}
Ph_90err   : 90% error of the photon index
Epeak      : Epeak in keV
Epeak_90err: 90% error of Epeak
Norm       : normalization at 50 keV in both the PL model and CPL model
Nomr_90err : 90% error of the normalization
chi2       : Chi-Squared
dof        : degree of freedo

=== Time-averaged spectral analysis ===
(Best model with acceptable fit: PL)

Model Ph_index Ph_90err_low Ph_90err_hi  Epeak  Epeak_90err_low  Epeak_90err_hi  Norm       Nomr_90err_low    Norm_90err_hi    chi2    dof
PL      -1.080    -0.185      0.190       -           -               -         1.70e-02     -1.93e-03          1.93e-03      51.580   57
CPL     -0.022    -0.859      1.093      105.238     -27.658       189.557      5.11e-02     -2.97e-02          9.86e-02      46.990   56


=== 1-s peak spectral analysis ===
(Best model with acceptable fit: PL)

Model Ph_index Ph_90err_low Ph_90err_hi  Epeak  Epeak_90err_low  Epeak_90err_hi  Norm       Nomr_90err_low    Norm_90err_hi    chi2    dof
PL      -1.284     -0.274     0.282       -           -               -         3.24e-02     -5.75e-03          5.75e-03      62.700   57
CPL      0.820     -1.912     2.910       62.205     -13.714       152.901      4.30e-01     -4.30e-01          1.33e+01      59.140   56


=== Fluence/Peak Flux Summary ===

              Model    Band1     Band2     Band3     Band4     Band5     Total
                       15-25     25-50    50-100    100-350    15-150    15-350    keV
Fluence         PL   1.18e-07  2.81e-07  5.31e-07  2.44e-06  1.44e-06  3.37e-06   erg/cm2
      90%_error_low -2.51e-08 -3.82e-08 -6.64e-08 -6.09e-07 -1.73e-07 -6.55e-07   erg/cm2
      90%_error_hi   2.69e-08  3.77e-08  6.59e-08  7.38e-07  1.74e-07  7.62e-07   erg/cm2
Peak flux       PL   1.08e+00  1.24e+00  1.02e+00  1.40e+00  3.85e+00  4.74e+00   ph/cm2/s
      90%_error_low -3.24e-01 -2.52e-01 -2.07e-01 -4.91e-01 -7.04e-01 -8.61e-01   ph/cm2/s
      90%_error_hi   3.51e-01  2.47e-01  2.05e-01  6.31e-01  7.06e-01  8.71e-01   ph/cm2/s

Fluence        CPL   9.16e-08  3.02e-07  5.88e-07  7.80e-07  1.37e-06  1.76e-06   erg/cm2
      90%_error_low -3.12e-08 -4.47e-08 -8.19e-08 -4.20e-07 -1.87e-07 -4.48e-07   erg/cm2
      90%_error_hi   3.34e-08  4.58e-08  8.43e-08  1.11e-06  1.86e-07  1.09e-06   erg/cm2
Peak flux      CPL   8.08e-01  1.55e+00  1.11e+00  2.07e-01  3.64e+00  3.67e+00   ph/cm2/s
      90%_error_low -3.98e-01 -3.81e-01 -3.00e-01 -2.07e-01 -7.41e-01 -7.67e-01   ph/cm2/s
      90%_error_hi   4.31e-01  3.91e-01  2.69e-01  9.06e-01  7.48e-01  9.62e-01   ph/cm2/s

======================================================================
Image
Pre-slew 15.0-350.0 keV image (Event data)
#   RAcent    DECcent   POSerr    Theta     Phi              Peak Cts       SNR   Name
   95.8029   -48.3346   0.0142    40.3544   130.9056         2.2126246     13.550 TRIG_01201696

Foreground time interval of the image:
 -0.232   7.816 (delta_t =   8.048 [sec])
Background time interval of the image:
-60.024  -0.232 (delta_t =  59.792 [sec])
Light Curves
Note: The mask-weighted lightcurves have units of either count/det or counts/sec/det, where a det is 0.4 x 0.4 = 0.16 sq cm.
Full-time range; 1 s binning
Other quick-look light curves:
- 64 ms binning (zoomed)
- 16 ms binning (zoomed)
- 8 ms binning (zoomed)
- 2 ms binning (zoomed)
- SN=5 or 10 s binning (full-time range)
- Raw light curve
Spectra
- 64 ms binning (zoomed)
- 16 ms binning (zoomed)
- 8 ms binning (zoomed)
- 2 ms binning (zoomed)
- SN=5 or 10 s binning (full-time range)
- Raw light curve
Spectra
Notes:
- 1) The fitting includes the systematic errors.
- 2) When the burst includes telescope slew time periods, the fitting uses an average response file made from multiple 5-s response files through out the slew time plus single time preiod for the non-slew times, and weighted by the total counts in the corresponding time period using addrmf. An average response file is needed becuase a spectral fit using the pre-slew DRM will introduce some errors in both a spectral shape and a normalization if the PHA file contains a lot of the slew/post-slew time interval.
- 3) For fits to more complicated models (e.g. a power-law over a cutoff power-law), the BAT team has decided to require a chi-square improvement of more than 6 for each extra dof.
Time averaged spectrum fit using the average DRM
Power-law model
Time interval is from   -0.232 sec. to    7.816 sec.

Spectral model in power-law:
------------------------------------------------------------
Parameters  : value       lower 90%   higher 90%
Photon index: -1.07991     ( -0.184608   0.190344 )
Norm@50keV  : 1.69820E-02    ( -0.00193414   0.00192939 )
------------------------------------------------------------
#Fit statistic  : Chi-Squared                   51.58     using 59 bins.
 Reduced chi-squared = 0.904912
# Null hypothesis probability of 6.78e-01 with 57 degrees of freedom

Photon flux (15-150 keV)    in 8.048 sec: 1.96615 ( -0.23036  0.23112 ) ph/cm2/s
Energy fluence (15-150 keV)             : 1.43836e-06 ( -1.727e-07  1.73537e-07 ) ergs/cm2
Cutoff power-law model
Time interval is from   -0.232 sec. to    7.816 sec.
Spectral model in the cutoff power-law:
------------------------------------------------------------
Parameters  : value       lower 90%   higher 90%
Photon index: -0.0218736     ( -0.858706   1.09268 )
Epeak [keV] : 105.238      ( -27.6574 189.557 )
Norm@50keV  : 5.10524E-02    ( -0.0297203   0.0985828 )
------------------------------------------------------------
#Fit statistic  : Chi-Squared                   46.99     using 59 bins.
 Reduced chi-squared = 0.839107
# Null hypothesis probability of 7.99e-01 with 56 degrees of freedom

Photon flux (15-150 keV)    in 8.048 sec: 1.88908 ( -0.24087  0.24026 ) ph/cm2/s
Energy fluence (15-150 keV)             : 1.36851e-06 ( -1.86831e-07  1.86055e-07 ) ergs/cm2
1-s peak spectrum fit
Power-law model
Time interval is from   -0.236 sec. to    0.764 sec.

Spectral model in power-law:
------------------------------------------------------------
Parameters  : value       lower 90%   higher 90%
Photon index: -1.28448     ( -0.27385   0.282152 )
Norm@50keV  : 3.23748E-02    ( -0.00575484   0.0057542 )
------------------------------------------------------------
#Fit statistic  : Chi-Squared                   62.70     using 59 bins.
 Reduced chi-squared = 1.1
# Null hypothesis probability of 2.81e-01 with 57 degrees of freedom

Photon flux (15-150 keV)    in 1 sec: 3.85166 ( -0.70426  0.70633 ) ph/cm2/s
Energy fluence (15-150 keV)             : 3.21181e-07 ( -6.13266e-08  6.18465e-08 ) ergs/cm2
Cutoff power-law model
Time interval is from   -0.236 sec. to    0.764 sec.
Spectral model in the cutoff power-law:
------------------------------------------------------------
Parameters  : value       lower 90%   higher 90%
Photon index: 0.820086     ( -1.92575   2.897 )
Epeak [keV] : 62.2049      ( -13.5005 153.115 )
Norm@50keV  : 0.429509    ( -0.444428   13.2521 )
------------------------------------------------------------
#Fit statistic  : Chi-Squared                   59.14     using 59 bins.
 Reduced chi-squared = 1.05607
# Null hypothesis probability of 3.62e-01 with 56 degrees of freedom

Photon flux (15-150 keV)    in 1 sec: 3.64194 ( -0.74146  0.74777 ) ph/cm2/s
Energy fluence (15-150 keV)             : 2.70377e-07 ( -6.58597e-08  7.92702e-08 ) ergs/cm2
Time-resolved spectra
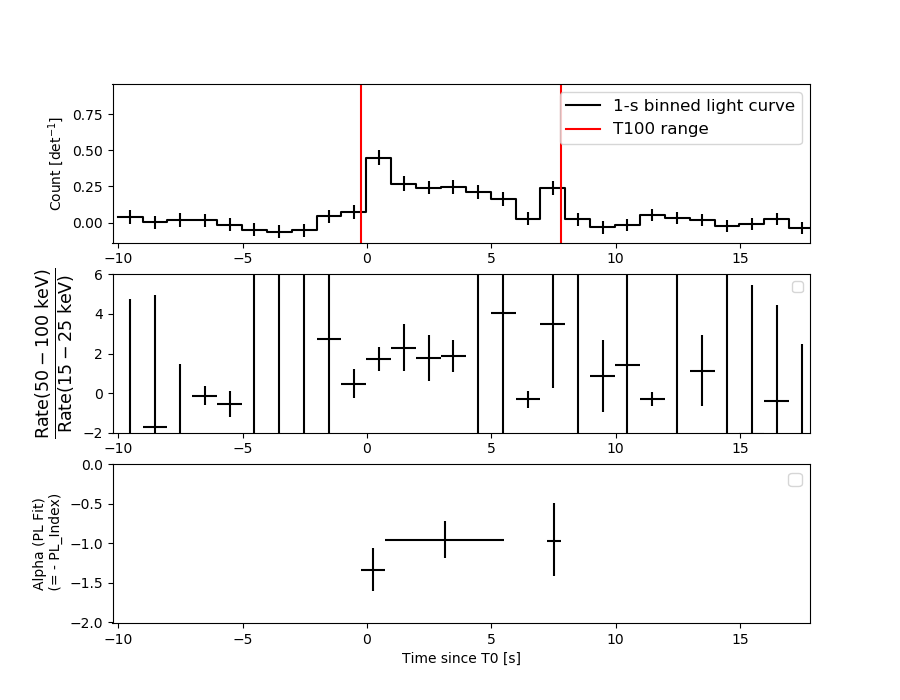
Distribution
T90 vs. Hardness ratio plot
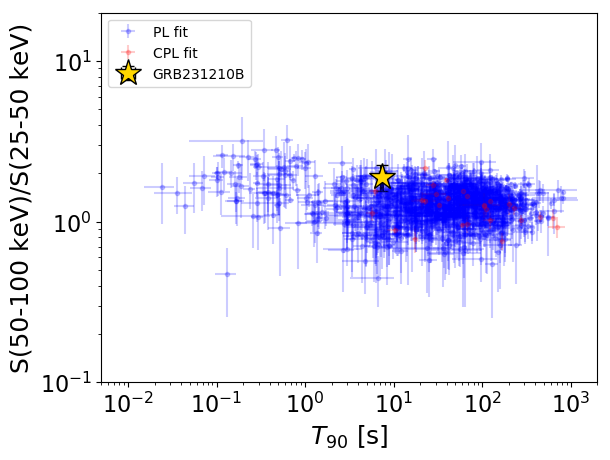
T90                                   = 7.472 sec.
Hardness ratio (energy fluence ratio) = 1.89225677439
S(15-50 keV) vs. S(50-150 keV) plot
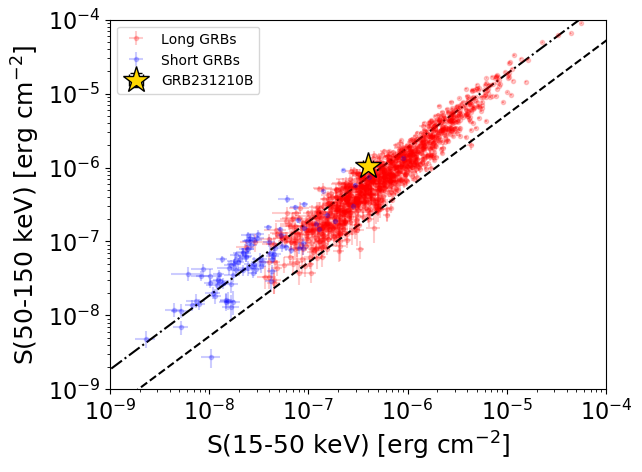
S(15-50 keV)  = 3.984621e-07
S(50-150 keV) = 1.0399164e-06
The dash-dotted line and the dashed line traces the fluences calculated from the Band function with Epeak = 15 and 150 keV, respectively. Both lines assume a canonical values of alpha = -1 and beta = -2.5.
Mask shadow pattern
IMX = -5.563924175074301E-01, IMY = -6.421907002046583E-01
Spacecraft aspect plot
Bright source in the pre-burst/pre-slew/post-slew images
Pre-burst image of 15-350 keV band
Time interval of the image:
-60.024000 -0.232000

# RAcent  DECcent POSerr Theta    Phi  PeakCts   SNR AngSep     Name
#  [deg]    [deg]    ['] [deg]  [deg]                   [']
170.2950 -60.7705    5.4  42.9 -163.3   1.0192   2.1    8.9	Cen X-3
186.4773 -62.8648    4.0  41.9 -151.7   1.3702   2.9    7.5	GX 301-2
  2.3069 -27.8225    2.8  47.9   16.6   2.1589   4.2 ------	UNKNOWN
336.4816 -34.5162    2.5  45.3  -15.0   1.7975   4.6 ------	UNKNOWN
314.2927 -42.7935    2.5  42.6  -42.5   2.5598   4.6 ------	UNKNOWN
271.3023 -57.4866    2.6  39.5  -89.5   4.7619   4.5 ------	UNKNOWN
Pre-slew background subtracted image of 15-350 keV band
Time interval of the image:
-0.232000 7.816000

# RAcent  DECcent POSerr Theta    Phi  PeakCts   SNR AngSep     Name
#  [deg]    [deg]    ['] [deg]  [deg]                   [']
170.0480 -60.5454   11.2  43.1 -163.5   0.1045   1.0    9.2	Cen X-3
186.5873 -62.7760    7.2  42.0 -151.6   0.1573   1.6    1.9	GX 301-2
 95.8029 -48.3346    0.9  40.4  130.9   2.2127  13.6 ------	UNKNOWN
167.4290 -44.7867    2.3  58.4 -169.1   1.9142   5.0 ------	UNKNOWN
333.1368 -22.7047    2.6  57.4  -15.1   1.3371   4.5 ------	UNKNOWN
322.8812 -33.4091    2.5  49.4  -29.4   0.6956   4.7 ------	UNKNOWN
299.1133 -43.7757    2.3  45.6  -57.8   1.3094   5.0 ------	UNKNOWN
Post-slew image of 15-350 keV band
Time interval of the image:
108.676590 963.046000

# RAcent  DECcent POSerr Theta    Phi  PeakCts   SNR AngSep     Name
#  [deg]    [deg]    ['] [deg]  [deg]                   [']
135.5401 -40.3504    4.9  29.2 -163.3  -3.6834  -2.3   12.3	Vela X-1
170.0248 -60.6161    5.6  42.3 -116.9  11.7764   2.1    8.6	Cen X-3
 50.0398 -16.8541    2.4  48.7   41.8  14.5053   4.7 ------	UNKNOWN
 39.1273 -39.0541    2.6  41.0    9.0   9.7320   4.5 ------	UNKNOWN
163.9943 -25.2806    2.2  57.2 -160.1  35.6540   5.2 ------	UNKNOWN
355.9474 -57.6120    2.4  55.2  -32.3  40.9968   4.8 ------	UNKNOWN