Analysis Summary
Notes:
- 1) No attempt has been made to eliminate the non-significant decimal places.
- 2) This batgrbproduct analysis is done using the HEASARC data.
- 3) This batgrbproduct analysis is using the flight position for the mask-weighting calculation.
======================================================================
                  BAT GRB EVENT DATA PROCESSING REPORT
    Process Script Ver: batgrbproduct v2.48
    Process Start Time: Tue Dec 26 15:25:43 EST 2023
             Host Name: batproc1
   Current Working Dir: /local/data/bat1/alien/Swift_3rdBATcatalog/event/batevent_reproc/trigger1202386
======================================================================

  Trigger: 01202386      Segment: 000

  BAT Trigger Time: 724278300.864   [s; MET]
      Trigger Stop: 724278301.888   [s; MET]
               UTC: 2023-12-14T20:24:28.316380    [includes UTCF correction]
       Where From?: TDRSS position message

  BAT
    RA: 305.736484932457   Dec: -72.4361154998792  [deg; J2000]

     Catalogged Source?: NO
     Point Source?:      YES
     GRB Indicated?:     YES    [ by BAT flight software ]
     Image S/N Ratio:    16.02
     Image Trigger?:     NO
     Rate S/N Ratio:     27.9642629082191  [ if not an image trigger ]
     Image S/N Ratio:    16.02

  Analysis Position:   [ source = BAT ]
    RA: 305.736484932457   Dec: -72.4361154998792  [deg; J2000]

  Refined Position:   [ source = BAT pre-slew burst ]
    RA: 305.668811260806   Dec: -72.4314385742254  [deg; J2000]
        { 20h 22m 40.5s , -72d 25' 53.2" }
         +/- 0.917669604417294 [arcmin] (estimated 90% radius based on SNR)
         +/- 0.308116697577104 [arcmin] (formal 1-sigma fit error)
    SNR: 34.3893208094765

  Angular difference between the analysis and refined position is 1.257185 arcmin

  Partial Coding Fraction: 0.390625    [ including projection effects ]

  Duration
     T90: 27.635999917984 +/- 4.5686374361287
        Measured from: -2.39599990844727
                   to: 25.2400000095367     [s; relative to TRIGTIME]
     T50: 13.8199999332428 +/- 0.536730813787334
        Measured from: 2.25600004196167
                   to: 16.0759999752045     [s; relative to TRIGTIME]


  Fluence
     Peak Flux  (peak 1 second)
        Measured from: 12.5720000267029
                   to: 13.5720000267029     [s; relative to TRIGTIME]
     Total Fluence
        Measured from: -5.36799991130829
                   to: 49.4200000762939     [s; relative to TRIGTIME]

             Band 1     Band 2     Band 3     Band 4
              15-25      25-50     50-100    100-350     keV
 Total     2.829022   4.972183   4.628298   1.432183
           0.111239   0.129912   0.122912   0.105672 [error]
 Peak      0.229280   0.433734   0.584797   0.157477
           0.019901   0.025371   0.026148   0.019641 [error]

     [ fluence units of on-axis counts / fully illuminated detector ]

======================================================================


====== Table of the duration information =============================

        Value   tstart    tstop
T100   54.788   -5.368   49.420
T90    27.636   -2.396   25.240
T50    13.820    2.256   16.076
Peak    1.000   12.572   13.572


====== Spectral Analysis Summary =====================================

Model      : spectral model: simple power-law (PL) and cutoff power-law (CPL)
Ph_index   : photon index: E^{Ph_index}
Ph_90err   : 90% error of the photon index
Epeak      : Epeak in keV
Epeak_90err: 90% error of Epeak
Norm       : normalization at 50 keV in both the PL model and CPL model
Nomr_90err : 90% error of the normalization
chi2       : Chi-Squared
dof        : degree of freedo

=== Time-averaged spectral analysis ===
(Best model with acceptable fit: CPL)

Model Ph_index Ph_90err_low Ph_90err_hi  Epeak  Epeak_90err_low  Epeak_90err_hi  Norm       Nomr_90err_low    Norm_90err_hi    chi2    dof
PL      -1.251    -0.054      0.054       -           -               -         1.80e-02     -5.39e-04          5.38e-04      69.430   57
CPL     -0.882    -0.223      0.235      171.015     -45.038       163.706      2.63e-02     -5.31e-03          7.02e-03      61.210   56


=== 1-s peak spectral analysis ===
(Best model with acceptable fit: N/A)

Model Ph_index Ph_90err_low Ph_90err_hi  Epeak  Epeak_90err_low  Epeak_90err_hi  Norm       Nomr_90err_low    Norm_90err_hi    chi2    dof
PL      -0.893     -0.092     0.094       -           -               -         9.90e-02     -5.50e-03          5.48e-03      67.550   57
CPL     -0.608     -0.318     0.388      296.024    -135.166      -296.024      1.31e-01     -3.44e-02          5.75e-02      65.700   56


=== Fluence/Peak Flux Summary ===

              Model    Band1     Band2     Band3     Band4     Band5     Total
                       15-25     25-50    50-100    100-350    15-150    15-350    keV
Fluence         PL   9.96e-07  2.13e-06  3.58e-06  1.38e-05  9.85e-06  2.05e-05   erg/cm2
      90%_error_low -5.97e-08 -7.64e-08 -1.24e-07 -1.06e-06 -3.14e-07 -1.13e-06   erg/cm2
      90%_error_hi   6.10e-08  7.61e-08  1.24e-07  1.12e-06  3.15e-07  1.18e-06   erg/cm2
Peak flux       PL   8.53e-04  1.04e-02  1.34e-01  1.17e+01  6.07e-01  1.18e+01   ph/cm2/s
      90%_error_low 5.34e-05     N/A   -6.59e-03 -6.23e-01 -3.02e-02 -6.03e-01   ph/cm2/s
      90%_error_hi   2.40e-04     N/A    1.46e-02  9.16e-01  6.14e-02  9.63e-01   ph/cm2/s

Fluence        CPL   9.09e-07  2.18e-06  3.71e-06  8.62e-06  9.65e-06  1.54e-05   erg/cm2
      90%_error_low -7.64e-08 -8.36e-08 -1.47e-07 -1.98e-06 -3.39e-07 -1.98e-06   erg/cm2
      90%_error_hi   7.80e-08  8.43e-08  1.48e-07  2.72e-06  3.38e-07  2.70e-06   erg/cm2
Peak flux      CPL   2.10e+00  1.86e-08  5.15e-05  7.55e-02  1.39e-04  1.53e-01   ph/cm2/s
      90%_error_low -3.34e-01 -1.86e-08 -5.15e-05 -7.55e-02 -1.39e-04 -1.53e-01   ph/cm2/s
      90%_error_hi   3.42e-01  -1.86e-08  -5.15e-05  -7.55e-02  -1.39e-04  -1.53e-01   ph/cm2/s

======================================================================
Image
Pre-slew 15.0-350.0 keV image (Event data)
#   RAcent    DECcent   POSerr    Theta     Phi              Peak Cts       SNR   Name
  305.6688   -72.4314   0.0055    34.8187  -124.5726         8.6888983     34.389 TRIG_01202386

Foreground time interval of the image:
 -5.368  14.637 (delta_t =  20.005 [sec])
Background time interval of the image:
-60.864  -5.368 (delta_t =  55.496 [sec])
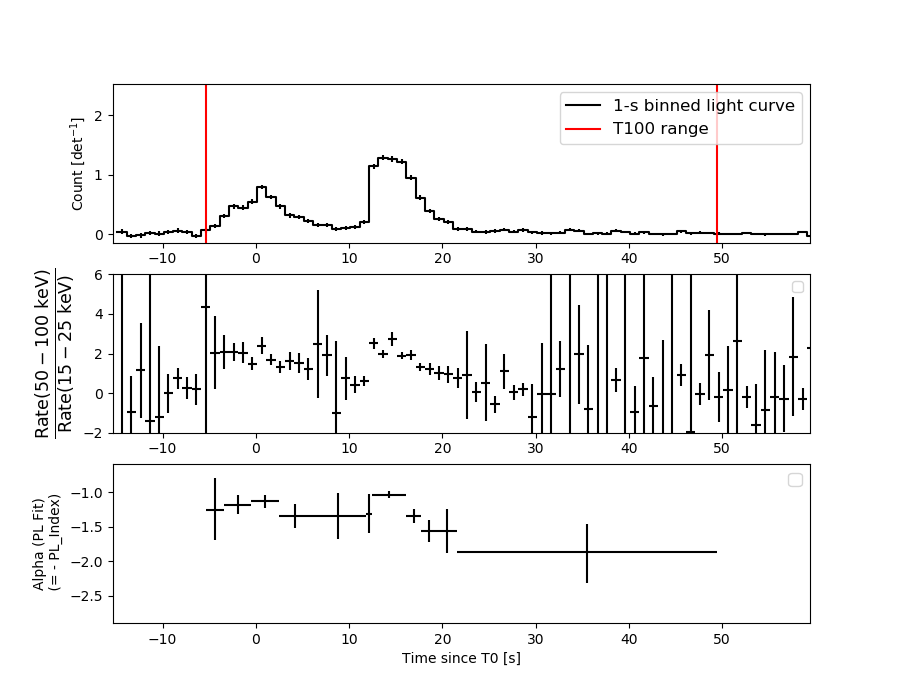
Light Curves
Note: The mask-weighted lightcurves have units of either count/det or counts/sec/det, where a det is 0.4 x 0.4 = 0.16 sq cm.
Full-time range; 1 s binning
Other quick-look light curves:
- 64 ms binning (zoomed)
- 16 ms binning (zoomed)
- 8 ms binning (zoomed)
- 2 ms binning (zoomed)
- SN=5 or 10 s binning (full-time range)
- Raw light curve
Spectra
- 64 ms binning (zoomed)
- 16 ms binning (zoomed)
- 8 ms binning (zoomed)
- 2 ms binning (zoomed)
- SN=5 or 10 s binning (full-time range)
- Raw light curve
Spectra
Notes:
- 1) The fitting includes the systematic errors.
- 2) When the burst includes telescope slew time periods, the fitting uses an average response file made from multiple 5-s response files through out the slew time plus single time preiod for the non-slew times, and weighted by the total counts in the corresponding time period using addrmf. An average response file is needed becuase a spectral fit using the pre-slew DRM will introduce some errors in both a spectral shape and a normalization if the PHA file contains a lot of the slew/post-slew time interval.
- 3) For fits to more complicated models (e.g. a power-law over a cutoff power-law), the BAT team has decided to require a chi-square improvement of more than 6 for each extra dof.
Time averaged spectrum fit using the average DRM
Power-law model
Time interval is from   -5.368 sec. to   49.420 sec.

Spectral model in power-law:
------------------------------------------------------------
Parameters  : value       lower 90%   higher 90%
Photon index: -1.25119     ( -0.0536518   0.0538469 )
Norm@50keV  : 1.79607E-02    ( -0.000538575   0.000538445 )
------------------------------------------------------------
#Fit statistic  : Chi-Squared                   69.43     using 59 bins.
 Reduced chi-squared = 1.21807
# Null hypothesis probability of 1.25e-01 with 57 degrees of freedom

Photon flux (15-150 keV)    in 54.79 sec: 2.12469 ( -0.06791  0.06802 ) ph/cm2/s
Energy fluence (15-150 keV)             : 9.84648e-06 ( -3.14316e-07  3.15106e-07 ) ergs/cm2
Cutoff power-law model
Time interval is from   -5.368 sec. to   49.420 sec.
Spectral model in the cutoff power-law:
------------------------------------------------------------
Parameters  : value       lower 90%   higher 90%
Photon index: -0.882333     ( -0.222689   0.234526 )
Epeak [keV] : 171.015      ( -45.0378 163.706 )
Norm@50keV  : 2.63279E-02    ( -0.00530745   0.0070244 )
------------------------------------------------------------
#Fit statistic  : Chi-Squared                   61.21     using 59 bins.
 Reduced chi-squared = 1.09304
# Null hypothesis probability of 2.94e-01 with 56 degrees of freedom

Photon flux (15-150 keV)    in 54.79 sec: 2.08175 ( -0.07218  0.07238 ) ph/cm2/s
Energy fluence (15-150 keV)             : 9.6534e-06 ( -3.39287e-07  3.37659e-07 ) ergs/cm2
1-s peak spectrum fit
Power-law model
Time interval is from   12.572 sec. to   13.572 sec.

Spectral model in power-law:
------------------------------------------------------------
Parameters  : value       lower 90%   higher 90%
Photon index: -0.892976     ( -0.0921557   0.0938206 )
Norm@50keV  : 9.89504E-02    ( -0.00549766   0.00547629 )
------------------------------------------------------------
#Fit statistic  : Chi-Squared                   67.55     using 59 bins.
 Reduced chi-squared = 1.18509
# Null hypothesis probability of 1.60e-01 with 57 degrees of freedom

Photon flux (15-150 keV)    in 1 sec: 0.606597 ( -0.030182  0.061394 ) ph/cm2/s
Energy fluence (15-150 keV)             : 1.11365e-06 ( -6.41076e-08  6.42543e-08 ) ergs/cm2
Cutoff power-law model
Time interval is from   12.572 sec. to   13.572 sec.
Spectral model in the cutoff power-law:
------------------------------------------------------------
Parameters  : value       lower 90%   higher 90%
Photon index: -0.608339     ( -0.318442   0.388363 )
Epeak [keV] : 296.024      ( -135.166 -296.024 )
Norm@50keV  : 0.130861    ( -0.0344049   0.0574791 )
------------------------------------------------------------
#Fit statistic  : Chi-Squared                   65.70     using 59 bins.
 Reduced chi-squared = 1.17321
# Null hypothesis probability of 1.76e-01 with 56 degrees of freedom

Photon flux (15-150 keV)    in 1 sec: 1.38775E-04 ( -0.000138775  -0.000138775 ) ph/cm2/s
Energy fluence (15-150 keV)             : 1.10599e-06 ( -6.56387e-08  6.55038e-08 ) ergs/cm2
Time-resolved spectra
Distribution
T90 vs. Hardness ratio plot
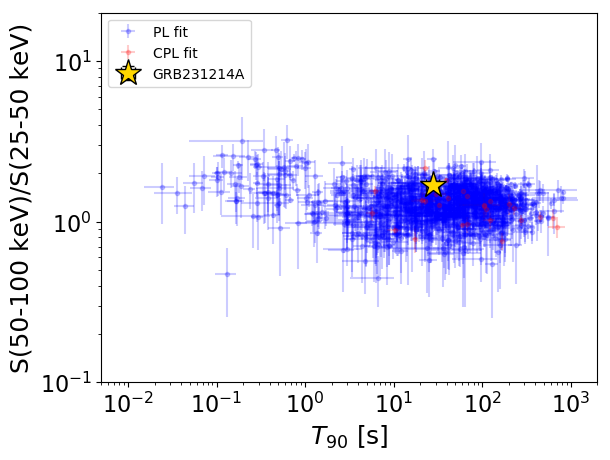
T90                                   = 27.636 sec.
Hardness ratio (energy fluence ratio) = 1.70211889077
S(15-50 keV) vs. S(50-150 keV) plot
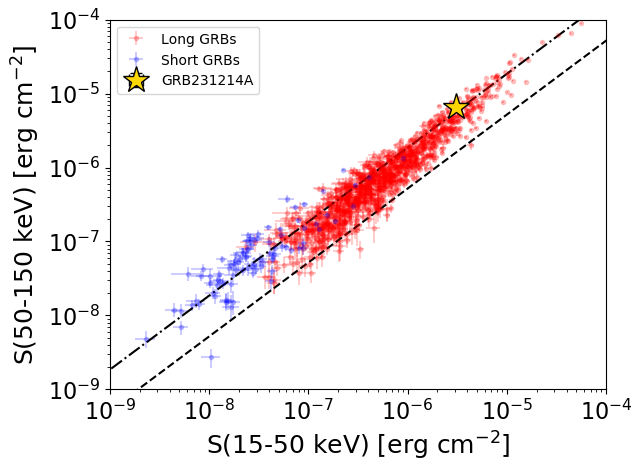
S(15-50 keV)  = 3.0905547e-06
S(50-150 keV) = 6.562794e-06
The dash-dotted line and the dashed line traces the fluences calculated from the Band function with Epeak = 15 and 150 keV, respectively. Both lines assume a canonical values of alpha = -1 and beta = -2.5.
Mask shadow pattern
IMX = -3.946623614373017E-01, IMY = 5.726816273078305E-01
Spacecraft aspect plot
Bright source in the pre-burst/pre-slew/post-slew images
Pre-burst image of 15-350 keV band
Time interval of the image:
-60.864000 -5.368000

# RAcent  DECcent POSerr Theta    Phi  PeakCts   SNR AngSep     Name
#  [deg]    [deg]    ['] [deg]  [deg]                   [']
 37.6571 -28.0064    2.6  31.6   84.7   1.7794   4.4 ------	UNKNOWN
323.3415 -24.5655    2.0  42.6  -42.5   2.6147   5.7 ------	UNKNOWN
209.3041 -74.2015    3.0  55.0 -145.4   5.4037   3.8 ------	UNKNOWN
311.7520 -32.4721    2.5  44.4  -61.1   5.1089   4.5 ------	UNKNOWN
Pre-slew background subtracted image of 15-350 keV band
Time interval of the image:
-5.368000 14.636600

# RAcent  DECcent POSerr Theta    Phi  PeakCts   SNR AngSep     Name
#  [deg]    [deg]    ['] [deg]  [deg]                   [']
 10.1890   1.6620    3.3  51.7   30.7   2.2033   3.5 ------	UNKNOWN
337.1696 -20.5096    2.4  38.1  -23.0   0.9037   4.8 ------	UNKNOWN
305.6689 -72.4314    0.3  34.8 -124.6   8.6882  34.4 ------	UNKNOWN
Post-slew image of 15-350 keV band
Time interval of the image:
88.836600 481.636600

# RAcent  DECcent POSerr Theta    Phi  PeakCts   SNR AngSep     Name
#  [deg]    [deg]    ['] [deg]  [deg]                   [']
170.4314 -60.4623   13.5  43.6  171.5   1.5040   0.9   10.2	Cen X-3
186.5147 -62.8857    9.9  38.6 -179.0   1.5313   1.2    7.9	GX 301-2
264.8492 -44.5841   21.1  33.8  -95.8   0.8099   0.5    9.2	4U 1735-44
145.5902 -60.0095    3.1  46.8  154.8   9.7704   3.7 ------	UNKNOWN
343.8640 -40.2967    2.7  37.1   12.6   4.7571   4.2 ------	UNKNOWN
175.1518 -58.2136    2.4  45.0  175.8   9.0972   4.9 ------	UNKNOWN
287.9265 -29.1171    2.6  44.4  -61.2  18.1806   4.5 ------	UNKNOWN