Analysis Summary
Notes:
- 1) No attempt has been made to eliminate the non-significant decimal places.
- 2) This batgrbproduct analysis is done using the HEASARC data.
- 3) This batgrbproduct analysis is using the flight position for the mask-weighting calculation.
======================================================================
                  BAT GRB EVENT DATA PROCESSING REPORT
    Process Script Ver: batgrbproduct v2.48
    Process Start Time: Tue Dec 26 15:21:53 EST 2023
             Host Name: batproc1
   Current Working Dir: /local/data/bat1/alien/Swift_3rdBATcatalog/event/batevent_reproc/trigger1202522
======================================================================

  Trigger: 01202522      Segment: 000

  BAT Trigger Time: 724326477.824   [s; MET]
      Trigger Stop: 724326479.872   [s; MET]
               UTC: 2023-12-15T09:47:25.273080    [includes UTCF correction]
       Where From?: TDRSS position message

  BAT
    RA: 9.75000608289667   Dec: 57.6422967295133  [deg; J2000]

     Catalogged Source?: NO
     Point Source?:      YES
     GRB Indicated?:     YES    [ by BAT flight software ]
     Image S/N Ratio:    9.55
     Image Trigger?:     NO
     Rate S/N Ratio:     98.4428768372806  [ if not an image trigger ]
     Image S/N Ratio:    9.55

  Analysis Position:   [ source = BAT ]
    RA: 9.75000608289667   Dec: 57.6422967295133  [deg; J2000]

  Refined Position:   [ source = BAT pre-slew burst ]
    RA: 9.72981974483865   Dec: 57.6337025644225  [deg; J2000]
        { 00h 38m 55.2s , +57d 38' 01.3" }
         +/- 1.29658815140801 [arcmin] (estimated 90% radius based on SNR)
         +/- 0.564341848036143 [arcmin] (formal 1-sigma fit error)
    SNR: 20.988074460736

  Angular difference between the analysis and refined position is 0.828368 arcmin

  Partial Coding Fraction: 0.06542969    [ including projection effects ]

  Duration
     T90: 22.0960000753403 +/- 3.47252532735092
        Measured from: -5.79200005531311
                   to: 16.3040000200272     [s; relative to TRIGTIME]
     T50: 7.04000008106232 +/- 1.43260322573292
        Measured from: -1.79200005531311
                   to: 5.24800002574921     [s; relative to TRIGTIME]


  Fluence
     Peak Flux  (peak 1 second)
        Measured from: 0.179999947547913
                   to: 1.17999994754791     [s; relative to TRIGTIME]
     Total Fluence
        Measured from: -7.03999996185303
                   to: 21.1200000047684     [s; relative to TRIGTIME]

             Band 1     Band 2     Band 3     Band 4
              15-25      25-50     50-100    100-350     keV
 Total     2.055800   3.826335   4.786562   2.606511
           0.185494   0.213855   0.209811   0.187671 [error]
 Peak      0.099387   0.365054   0.570215   0.242444
           0.039289   0.050311   0.056179   0.047175 [error]

     [ fluence units of on-axis counts / fully illuminated detector ]

======================================================================


====== Table of the duration information =============================

        Value   tstart    tstop
T100   28.160   -7.040   21.120
T90    22.096   -5.792   16.304
T50     7.040   -1.792    5.248
Peak    1.000    0.180    1.180


====== Spectral Analysis Summary =====================================

Model      : spectral model: simple power-law (PL) and cutoff power-law (CPL)
Ph_index   : photon index: E^{Ph_index}
Ph_90err   : 90% error of the photon index
Epeak      : Epeak in keV
Epeak_90err: 90% error of Epeak
Norm       : normalization at 50 keV in both the PL model and CPL model
Nomr_90err : 90% error of the normalization
chi2       : Chi-Squared
dof        : degree of freedo

=== Time-averaged spectral analysis ===
(Best model with acceptable fit: PL)

Model Ph_index Ph_90err_low Ph_90err_hi  Epeak  Epeak_90err_low  Epeak_90err_hi  Norm       Nomr_90err_low    Norm_90err_hi    chi2    dof
PL      -1.031    -0.090      0.092       -           -               -         3.45e-02     -1.88e-03          1.86e-03      55.810   57
CPL     -1.013    -0.106      0.367     9879.710    -9879.710      -9879.710      3.49e-02     -2.16e-03          1.44e-03      55.990   56


=== 1-s peak spectral analysis ===
(Best model with acceptable fit: N/A)

Model Ph_index Ph_90err_low Ph_90err_hi  Epeak  Epeak_90err_low  Epeak_90err_hi  Norm       Nomr_90err_low    Norm_90err_hi    chi2    dof
PL      -0.920     -0.210     0.219       -           -               -         8.64e-02     -1.21e-02          1.19e-02      66.970   57
CPL      0.220     -0.983     1.260      124.516     -34.580       320.670      2.45e-01     -1.44e-01          4.61e-01      62.970   56


=== Fluence/Peak Flux Summary ===

              Model    Band1     Band2     Band3     Band4     Band5     Total
                       15-25     25-50    50-100    100-350    15-150    15-350    keV
Fluence         PL   8.00e-07  1.96e-06  3.84e-06  1.86e-05  1.04e-05  2.52e-05   erg/cm2
      90%_error_low -9.14e-08 -1.38e-07 -1.97e-07 -2.13e-06 -5.24e-07 -2.19e-06   erg/cm2
      90%_error_hi   9.57e-08  1.37e-07  1.97e-07  2.32e-06  5.25e-07  2.35e-06   erg/cm2
Peak flux       PL   1.26e-04  1.69e-03  4.31e-02  3.63e+00  1.03e-01  2.38e+00   ph/cm2/s
      90%_error_low     N/A       N/A   3.14e-03 3.88e-01     N/A   1.69e+00   ph/cm2/s
      90%_error_hi      N/A       N/A    1.09e-01  6.22e+00     N/A    7.63e+00   ph/cm2/s

Fluence        CPL   7.98e-07  2.03e-06  3.85e-06  1.84e-05  1.04e-05  2.50e-05   erg/cm2
      90%_error_low -1.24e-07 -1.85e-07 -2.01e-07 -5.99e-06 -5.20e-07 -5.91e-06   erg/cm2
      90%_error_hi   6.97e-08  7.36e-08  2.67e-07  1.33e-06  5.12e-07  1.30e-06   erg/cm2
Peak flux      CPL   2.06e-05  2.21e-04  1.20e-02  1.60e+00  2.36e-02  1.65e+00   ph/cm2/s
      90%_error_low -2.06e-05 -2.21e-04 -1.20e-02 -1.60e+00 -2.36e-02 -1.65e+00   ph/cm2/s
      90%_error_hi   -2.06e-05  -2.21e-04  -1.20e-02  -1.60e+00  -2.36e-02  -1.65e+00   ph/cm2/s

======================================================================
Image
Pre-slew 15.0-350.0 keV image (Event data)

#   RAcent    DECcent   POSerr    Theta     Phi              Peak Cts       SNR   Name
    9.7298    57.6337   0.0091    57.1930  -174.1937        14.3297439     20.988 TRIG_01202522

Foreground time interval of the image:
 -7.040  21.120 (delta_t =  28.160 [sec])
Background time interval of the image:
-239.824  -7.040 (delta_t = 232.784 [sec])
Light Curves
Note: The mask-weighted lightcurves have units of either count/det or counts/sec/det, where a det is 0.4 x 0.4 = 0.16 sq cm.
Full-time range; 1 s binning
Other quick-look light curves:
- 64 ms binning (zoomed)
- 16 ms binning (zoomed)
- 8 ms binning (zoomed)
- 2 ms binning (zoomed)
- SN=5 or 10 s binning (full-time range)
- Raw light curve
Spectra
- 64 ms binning (zoomed)
- 16 ms binning (zoomed)
- 8 ms binning (zoomed)
- 2 ms binning (zoomed)
- SN=5 or 10 s binning (full-time range)
- Raw light curve
Spectra
Notes:
- 1) The fitting includes the systematic errors.
- 2) When the burst includes telescope slew time periods, the fitting uses an average response file made from multiple 5-s response files through out the slew time plus single time preiod for the non-slew times, and weighted by the total counts in the corresponding time period using addrmf. An average response file is needed becuase a spectral fit using the pre-slew DRM will introduce some errors in both a spectral shape and a normalization if the PHA file contains a lot of the slew/post-slew time interval.
- 3) For fits to more complicated models (e.g. a power-law over a cutoff power-law), the BAT team has decided to require a chi-square improvement of more than 6 for each extra dof.
Time averaged spectrum fit using the average DRM
Power-law model

Time interval is from   -7.040 sec. to   21.120 sec.

Spectral model in power-law:
------------------------------------------------------------
Parameters  : value       lower 90%   higher 90%
Photon index: -1.03128     ( -0.0898922   0.0917248 )
Norm@50keV  : 3.44510E-02    ( -0.00187769   0.0018622 )
------------------------------------------------------------
#Fit statistic  : Chi-Squared                   55.81     using 59 bins.
 Reduced chi-squared = 0.979123
# Null hypothesis probability of 5.20e-01 with 57 degrees of freedom

Photon flux (15-150 keV)    in 28.16 sec: 3.97370 ( -0.2258  0.22679 ) ph/cm2/s
Energy fluence (15-150 keV)             : 1.03777e-05 ( -5.24426e-07  5.24666e-07 ) ergs/cm2
Cutoff power-law model

Time interval is from   -7.040 sec. to   21.120 sec.
Spectral model in the cutoff power-law:
------------------------------------------------------------
Parameters  : value       lower 90%   higher 90%
Photon index: -1.02503     ( -0.106016   0.367008 )
Epeak [keV] : 9999.99      ( -9999.99 -9999.99 )
Norm@50keV  : 3.46515E-02    ( -0.00187888   0.00172177 )
------------------------------------------------------------
#Fit statistic  : Chi-Squared                   55.81     using 59 bins.
 Reduced chi-squared = 0.996607
# Null hypothesis probability of 4.82e-01 with 56 degrees of freedom

Photon flux (15-150 keV)    in 28.16 sec: 3.97132 ( -0.23369  0.2282 ) ph/cm2/s
Energy fluence (15-150 keV)             : 1.03818e-05 ( -5.19856e-07  5.12078e-07 ) ergs/cm2
1-s peak spectrum fit
Power-law model

Time interval is from    0.180 sec. to    1.180 sec.

Spectral model in power-law:
------------------------------------------------------------
Parameters  : value       lower 90%   higher 90%
Photon index: -0.919778     ( -0.210331   0.219477 )
Norm@50keV  : 8.63562E-02    ( -0.01208   0.0119194 )
------------------------------------------------------------
#Fit statistic  : Chi-Squared                   66.97     using 59 bins.
 Reduced chi-squared = 1.17491
# Null hypothesis probability of 1.72e-01 with 57 degrees of freedom

Photon flux (15-150 keV)    in 1 sec: 0.102950 (    ) ph/cm2/s
Energy fluence (15-150 keV)             : 9.619e-07 ( -1.2818e-07  1.28284e-07 ) ergs/cm2
Cutoff power-law model
Time interval is from    0.180 sec. to    1.180 sec.
Spectral model in the cutoff power-law:
------------------------------------------------------------
Parameters  : value       lower 90%   higher 90%
Photon index: 0.220065     ( -0.9826   1.25958 )
Epeak [keV] : 124.516      ( -34.5802 320.669 )
Norm@50keV  : 0.244962    ( -0.143571   0.460534 )
------------------------------------------------------------
#Fit statistic  : Chi-Squared                   62.97     using 59 bins.
 Reduced chi-squared = 1.12446
# Null hypothesis probability of 2.43e-01 with 56 degrees of freedom

Photon flux (15-150 keV)    in 1 sec: 2.35713E-02 ( -0.0235713  -0.0235713 ) ph/cm2/s
Energy fluence (15-150 keV)             : 9.54113e-07 ( -1.33591e-07  1.32238e-07 ) ergs/cm2
Time-resolved spectra

Distribution
T90 vs. Hardness ratio plot

T90                                   = 22.096 sec.
Hardness ratio (energy fluence ratio) = 1.95713109594
S(15-50 keV) vs. S(50-150 keV) plot
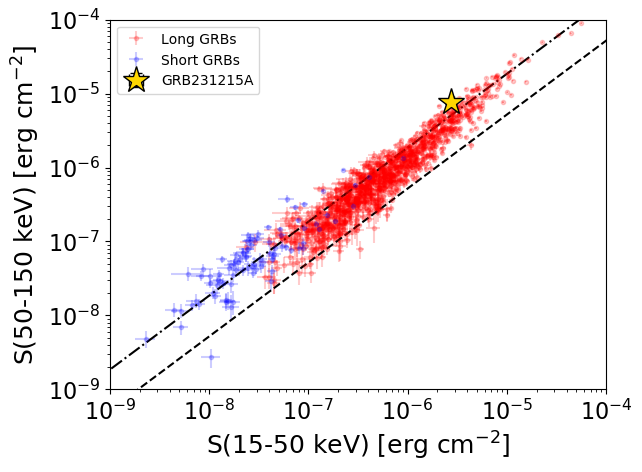
S(15-50 keV)  = 2.7617152e-06
S(50-150 keV) = 7.616004e-06
The dash-dotted line and the dashed line traces the fluences calculated from the Band function with Epeak = 15 and 150 keV, respectively. Both lines assume a canonical values of alpha = -1 and beta = -2.5.
Mask shadow pattern

IMX = -1.543322842016900E+00, IMY = 1.569353617951765E-01
Spacecraft aspect plot

Bright source in the pre-burst/pre-slew/post-slew images
Pre-burst image of 15-350 keV band
Time interval of the image:
-239.824000 -7.040000

# RAcent  DECcent POSerr Theta    Phi  PeakCts   SNR AngSep     Name
#  [deg]    [deg]    ['] [deg]  [deg]                   [']
 98.9896  26.0216    2.1  31.6   84.7   3.6983   5.5 ------	UNKNOWN
 44.9802  72.5856    2.0  37.4 -166.9   2.7386   5.7 ------	UNKNOWN
187.7312  41.3832    2.8  44.4  -61.2   6.9021   4.1 ------	UNKNOWN
Pre-slew background subtracted image of 15-350 keV band
Time interval of the image:
-7.040000 21.120000

# RAcent  DECcent POSerr Theta    Phi  PeakCts   SNR AngSep     Name
#  [deg]    [deg]    ['] [deg]  [deg]                   [']
 88.8185  21.5761    3.4  40.1   94.8   1.2125   3.4 ------	UNKNOWN
 78.1280  45.9002    2.1  29.2  137.1   0.6467   5.4 ------	UNKNOWN
  9.7298  57.6337    0.6  57.2 -174.2  14.3340  20.8 ------	UNKNOWN
  9.3605  76.8847    2.9  44.3 -155.6   0.6977   4.0 ------	UNKNOWN
173.4315  55.1581    3.7  29.7  -74.4   0.4385   3.1 ------	UNKNOWN
Post-slew image of 15-350 keV band
Time interval of the image:
217.476590 664.076600

# RAcent  DECcent POSerr Theta    Phi  PeakCts   SNR AngSep     Name
#  [deg]    [deg]    ['] [deg]  [deg]                   [']
170.3945 -60.5898    4.2  54.3   -8.0   3.3557   2.7    3.1	Cen X-3
186.7995 -62.7886    9.8  52.4  -17.8   1.8559   1.2    4.1	GX 301-2
244.9889 -15.6126    1.1  41.8 -106.0  32.9606  10.3    1.7	Sco X-1
171.0281  -2.6884    4.3  32.1   77.1   2.9885   2.7 ------	UNKNOWN
163.5477 -25.7401    2.9  39.0   36.6   4.2599   4.0 ------	UNKNOWN
226.0558  17.4344    1.8  37.4 -167.0   5.2388   6.4 ------	UNKNOWN