Analysis Summary
Notes:
- 1) No attempt has been made to eliminate the non-significant decimal places.
- 2) This batgrbproduct analysis is done using the HEASARC data.
- 3) This batgrbproduct analysis is using the flight position for the mask-weighting calculation.
======================================================================
BAT GRB EVENT DATA PROCESSING REPORT
Process Script Ver: batgrbproduct v2.48
Process Start Time: Sat Mar 9 14:15:25 EST 2024
Host Name: batproc1
Current Working Dir: /local/data/bat1/alien/Swift_3rdBATcatalog/event/batevent_reproc/trigger1202749
======================================================================
Trigger: 01202749 Segment: 000
BAT Trigger Time: 724444574.592 [s; MET]
Trigger Stop: 724444575.104 [s; MET]
UTC: 2023-12-16T18:35:42.032980 [includes UTCF correction]
Where From?: TDRSS position message
BAT
RA: 39.7587790592505 Dec: 33.5959734832109 [deg; J2000]
Catalogged Source?: NO
Point Source?: YES
GRB Indicated?: YES [ by BAT flight software ]
Image S/N Ratio: 8.94
Image Trigger?: NO
Rate S/N Ratio: 17.606816861659 [ if not an image trigger ]
Image S/N Ratio: 8.94
Analysis Position: [ source = BAT ]
RA: 39.7587790592505 Dec: 33.5959734832109 [deg; J2000]
Refined Position: [ source = BAT pre-slew burst ]
RA: 39.777872259361 Dec: 33.6151710870154 [deg; J2000]
{ 02h 39m 06.7s , +33d 36' 54.6" }
+/- 2.04845508316876 [arcmin] (estimated 90% radius based on SNR)
+/- 0.827386591553676 [arcmin] (formal 1-sigma fit error)
SNR: 10.9200206035495
Angular difference between the analysis and refined position is 1.495704 arcmin
Partial Coding Fraction: 0.59375 [ including projection effects ]
Duration
T90: 51.1399999856949 +/- 3.05003085178843
Measured from: -0.527999997138977
to: 50.6119999885559 [s; relative to TRIGTIME]
T50: 43.1480000019073 +/- 2.6436943518876
Measured from: 0.991999983787537
to: 44.1399999856949 [s; relative to TRIGTIME]
Fluence
Peak Flux (peak 1 second)
Measured from: -0.508000016212463
to: 0.491999983787537 [s; relative to TRIGTIME]
Total Fluence
Measured from: -1.12000000476837
to: 51.3600000143051 [s; relative to TRIGTIME]
Band 1 Band 2 Band 3 Band 4
15-25 25-50 50-100 100-350 keV
Total 0.486259 0.575854 0.480620 0.049493
0.060896 0.063500 0.055361 0.050958 [error]
Peak 0.047574 0.092767 0.063155 0.027142
0.010135 0.011287 0.010001 0.008308 [error]
[ fluence units of on-axis counts / fully illuminated detector ]
======================================================================
====== Table of the duration information =============================
Value tstart tstop
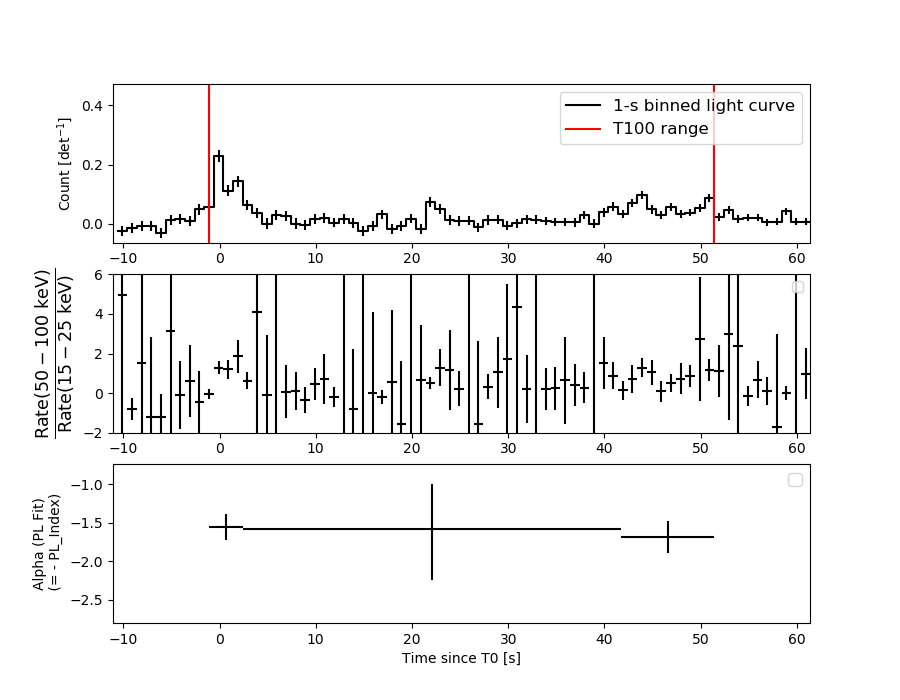
T100 52.480 -1.120 51.360
T90 51.140 -0.528 50.612
T50 43.148 0.992 44.140
Peak 1.000 -0.508 0.492
====== Spectral Analysis Summary =====================================
Model : spectral model: simple power-law (PL) and cutoff power-law (CPL)
Ph_index : photon index: E^{Ph_index}
Ph_90err : 90% error of the photon index
Epeak : Epeak in keV
Epeak_90err: 90% error of Epeak
Norm : normalization at 50 keV in both the PL model and CPL model
Nomr_90err : 90% error of the normalization
chi2 : Chi-Squared
dof : degree of freedo
=== Time-averaged spectral analysis ===
(Best model with acceptable fit: PL)
Model Ph_index Ph_90err_low Ph_90err_hi Epeak Epeak_90err_low Epeak_90err_hi Norm Nomr_90err_low Norm_90err_hi chi2 dof
PL -1.608 -0.199 0.195 - - - 2.07e-03 -2.45e-04 2.43e-04 45.700 57
CPL -1.198 -0.653 0.863 95.964 -37.816 -95.964 3.36e-03 -1.49e-03 5.74e-03 44.810 56
=== 1-s peak spectral analysis ===
(Best model with acceptable fit: PL)
Model Ph_index Ph_90err_low Ph_90err_hi Epeak Epeak_90err_low Epeak_90err_hi Norm Nomr_90err_low Norm_90err_hi chi2 dof
PL -1.454 -0.235 0.234 - - - 1.45e-02 -2.19e-03 2.18e-03 54.190 57
CPL -0.081 -1.141 1.722 67.029 -16.160 92.739 7.58e-02 -7.58e-02 5.53e-01 49.730 56
=== Fluence/Peak Flux Summary ===
Model Band1 Band2 Band3 Band4 Band5 Total
15-25 25-50 50-100 100-350 15-150 15-350 keV
Fluence PL 1.53e-07 2.64e-07 3.46e-07 9.22e-07 1.01e-06 1.68e-06 erg/cm2
90%_error_low -2.74e-08 -3.02e-08 -5.42e-08 -2.70e-07 -1.28e-07 -3.22e-07 erg/cm2
90%_error_hi 2.86e-08 3.01e-08 5.39e-08 3.36e-07 1.30e-07 3.75e-07 erg/cm2
Peak flux PL 5.69e-01 5.89e-01 4.30e-01 5.05e-01 1.78e+00 2.09e+00 ph/cm2/s
90%_error_low -1.36e-01 -9.49e-02 -7.79e-02 -1.59e-01 -2.72e-01 -3.16e-01 ph/cm2/s
90%_error_hi 1.44e-01 9.40e-02 7.72e-02 1.97e-01 2.72e-01 3.18e-01 ph/cm2/s
Fluence CPL 1.44e-07 2.76e-07 3.54e-07 5.03e-07 9.84e-07 1.28e-06 erg/cm2
90%_error_low -3.26e-08 -3.68e-08 -5.78e-08 -3.17e-07 -1.39e-07 -3.50e-07 erg/cm2
90%_error_hi 3.30e-08 3.83e-08 5.92e-08 5.11e-07 1.40e-07 5.48e-07 erg/cm2
Peak flux CPL 4.63e-01 6.80e-01 4.70e-01 1.40e-01 1.72e+00 1.75e+00 ph/cm2/s
90%_error_low -1.58e-01 -1.25e-01 -9.70e-02 -1.04e-01 -2.80e-01 -3.01e-01 ph/cm2/s
90%_error_hi 1.67e-01 1.38e-01 9.53e-02 2.58e-01 2.79e-01 3.39e-01 ph/cm2/s
======================================================================
Image
Pre-slew 15.0-350.0 keV image (Event data)

#   RAcent    DECcent   POSerr    Theta     Phi              Peak Cts       SNR   Name
   39.7779    33.6152   0.0177    38.7215    -8.3340         0.6959546     10.920 TRIG_01202749

Foreground time interval of the image:
 -1.120  10.109 (delta_t =  11.229 [sec])
Background time interval of the image:
-56.891  -1.120 (delta_t =  55.771 [sec])
Light Curves
Note: The mask-weighted lightcurves have units of either count/det or counts/sec/det, where a det is 0.4 x 0.4 = 0.16 sq cm.
Full-time range; 1 s binning
Other quick-look light curves:
- 64 ms binning (zoomed)
- 16 ms binning (zoomed)
- 8 ms binning (zoomed)
- 2 ms binning (zoomed)
- SN=5 or 10 s binning (full-time range)
- Raw light curve
Spectra
- 64 ms binning (zoomed)
- 16 ms binning (zoomed)
- 8 ms binning (zoomed)
- 2 ms binning (zoomed)
- SN=5 or 10 s binning (full-time range)
- Raw light curve
Spectra
Notes:
- 1) The fitting includes the systematic errors.
- 2) When the burst includes telescope slew time periods, the fitting uses an average response file made from multiple 5-s response files through out the slew time plus single time preiod for the non-slew times, and weighted by the total counts in the corresponding time period using addrmf. An average response file is needed becuase a spectral fit using the pre-slew DRM will introduce some errors in both a spectral shape and a normalization if the PHA file contains a lot of the slew/post-slew time interval.
- 3) For fits to more complicated models (e.g. a power-law over a cutoff power-law), the BAT team has decided to require a chi-square improvement of more than 6 for each extra dof.
Time averaged spectrum fit using the average DRM
Power-law model

Time interval is from   -1.120 sec. to   51.360 sec.

Spectral model in power-law:
------------------------------------------------------------
Parameters  : value       lower 90%   higher 90%
Photon index: -1.6084     ( -0.199162   0.194839 )
Norm@50keV  : 2.06673E-03    ( -0.000245323   0.000242588 )
------------------------------------------------------------
#Fit statistic  : Chi-Squared                   45.70     using 59 bins.
 Reduced chi-squared = 0.801754
# Null hypothesis probability of 8.59e-01 with 57 degrees of freedom

Photon flux (15-150 keV)    in 52.48 sec: 0.266289 ( -0.030204  0.030244 ) ph/cm2/s
Energy fluence (15-150 keV)             : 1.01348e-06 ( -1.28355e-07  1.29805e-07 ) ergs/cm2
Cutoff power-law model

Time interval is from   -1.120 sec. to   51.360 sec.
Spectral model in the cutoff power-law:
------------------------------------------------------------
Parameters  : value       lower 90%   higher 90%
Photon index: -1.19829     ( -0.65306   0.863032 )
Epeak [keV] : 95.9637      ( -37.8162 -95.9637 )
Norm@50keV  : 3.36098E-03    ( -0.00149151   0.00574341 )
------------------------------------------------------------
#Fit statistic  : Chi-Squared                   44.81     using 59 bins.
 Reduced chi-squared = 0.800179
# Null hypothesis probability of 8.58e-01 with 56 degrees of freedom

Photon flux (15-150 keV)    in 52.48 sec: 0.261708 ( -0.031447  0.031338 ) ph/cm2/s
Energy fluence (15-150 keV)             : 9.83612e-07 ( -1.38929e-07  1.40149e-07 ) ergs/cm2
1-s peak spectrum fit
Power-law model

Time interval is from   -0.508 sec. to    0.492 sec.

Spectral model in power-law:
------------------------------------------------------------
Parameters  : value       lower 90%   higher 90%
Photon index: -1.45358     ( -0.234691   0.233655 )
Norm@50keV  : 1.44630E-02    ( -0.00219142   0.00218391 )
------------------------------------------------------------
#Fit statistic  : Chi-Squared                   54.19     using 59 bins.
 Reduced chi-squared = 0.950702
# Null hypothesis probability of 5.81e-01 with 57 degrees of freedom

Photon flux (15-150 keV)    in 1 sec: 1.78398 ( -0.2716  0.27217 ) ph/cm2/s
Energy fluence (15-150 keV)             : 1.38331e-07 ( -2.25306e-08  2.2741e-08 ) ergs/cm2
Cutoff power-law model

Time interval is from   -0.508 sec. to    0.492 sec.
Spectral model in the cutoff power-law:
------------------------------------------------------------
Parameters  : value       lower 90%   higher 90%
Photon index: -0.0806125     ( -1.14172   1.7218 )
Epeak [keV] : 67.0294      ( -16.1528 92.7463 )
Norm@50keV  : 7.57985E-02    ( -0.0758352   0.55273 )
------------------------------------------------------------
#Fit statistic  : Chi-Squared                   49.73     using 59 bins.
 Reduced chi-squared = 0.888036
# Null hypothesis probability of 7.10e-01 with 56 degrees of freedom

Photon flux (15-150 keV)    in 1 sec: 1.71980 ( -0.2797  0.27901 ) ph/cm2/s
Energy fluence (15-150 keV)             : 1.26145e-07 ( -2.53799e-08  2.5595e-08 ) ergs/cm2
Time-resolved spectra
Distribution
T90 vs. Hardness ratio plot

T90                                   = 51.14 sec.
Hardness ratio (energy fluence ratio) = 1.31186778727
S(15-50 keV) vs. S(50-150 keV) plot

S(15-50 keV)  = 4.170624e-07
S(50-150 keV) = 5.964144e-07
The dash-dotted line and the dashed line traces the fluences calculated from the Band function with Epeak = 15 and 150 keV, respectively. Both lines assume a canonical values of alpha = -1 and beta = -2.5.
Mask shadow pattern

IMX = 7.933018136795843E-01, IMY = 1.162109312197978E-01
Spacecraft aspect plot

Bright source in the pre-burst/pre-slew/post-slew images
Pre-burst image of 15-350 keV band
Time interval of the image:
-56.891410 -1.120000

# RAcent  DECcent POSerr Theta    Phi  PeakCts   SNR AngSep     Name
#  [deg]    [deg]    ['] [deg]  [deg]                   [']
 83.6354  22.0429    0.8  22.3   71.3   2.3435  15.2    1.7	Crab
 67.5883  47.9083    2.5  42.6   30.4   1.1321   4.7 ------	UNKNOWN
 28.8854  51.6369    2.4  56.6    3.0   2.6738   4.8 ------	UNKNOWN
 56.7704  -9.0195    2.4  18.4 -110.2   0.5924   4.7 ------	UNKNOWN
 25.6088  15.9678    2.2  43.2  -41.2   1.2926   5.2 ------	UNKNOWN
Pre-slew background subtracted image of 15-350 keV band
Time interval of the image:
-1.120000 10.108600

# RAcent  DECcent POSerr Theta    Phi  PeakCts   SNR AngSep     Name
#  [deg]    [deg]    ['] [deg]  [deg]                   [']
 83.5884  22.1499    5.4  22.4   71.1   0.1240   2.1    8.5	Crab
 39.7779  33.6152    1.1  38.7   -8.3   0.6959  10.9 ------	UNKNOWN
 40.8928  18.6346    2.4  29.8  -30.1   0.2539   4.8 ------	UNKNOWN
Post-slew image of 15-350 keV band
Time interval of the image:
112.708590 714.368000
720.408000 837.726200
840.408000 962.511800

# RAcent  DECcent POSerr Theta    Phi  PeakCts   SNR AngSep     Name
#  [deg]    [deg]    ['] [deg]  [deg]                   [']
 78.4881  32.9166    3.4  32.2   77.4   7.7339   3.4 ------	UNKNOWN
 42.1788   3.4336    2.4  30.3  172.4   6.4577   4.8 ------	UNKNOWN