GRB 050509B Light Curves
BAT Light Curves
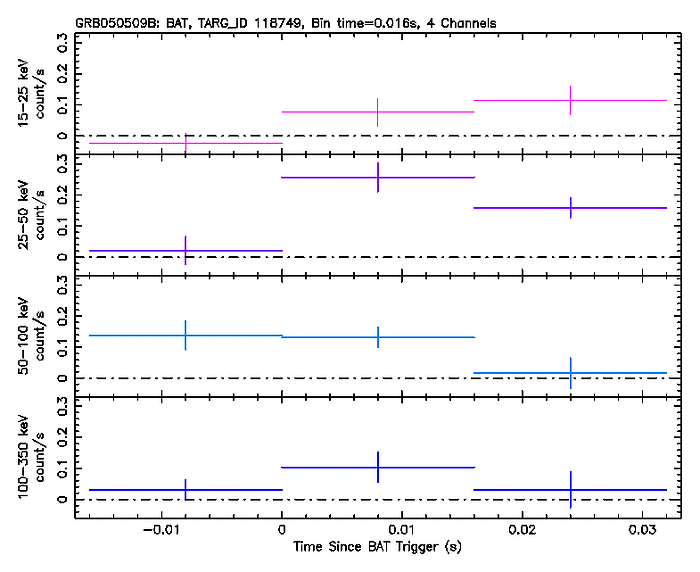
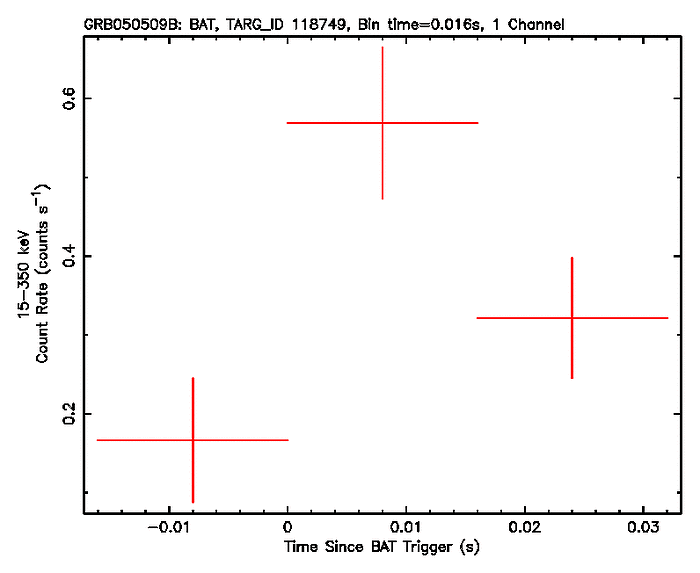
The BAT light curves shown below were produced by running in sequence the Swift software tasks batgrbproduct and batbinevt. From the output of batgrbproduct, e.g. the 64 ms light curve, using the duration and the maximum rate of the burst, a constant time bin was derived. The event data was then rebinned with this time bin using batbinevt in different energy channels. These are the standard BAT energy bands of 15-25 keV, 25-50 keV, 50-100 keV, and 100-350 keV (4-channel), as well as the 15-350 keV energy band (1-channel).
BAT 4-channel Light Curve
BAT 1-channel Light Curve (15-350 keV)
XRT Light Curves
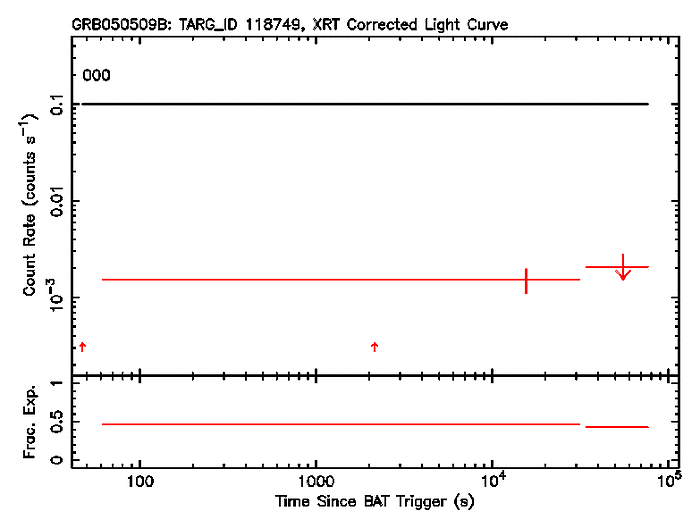
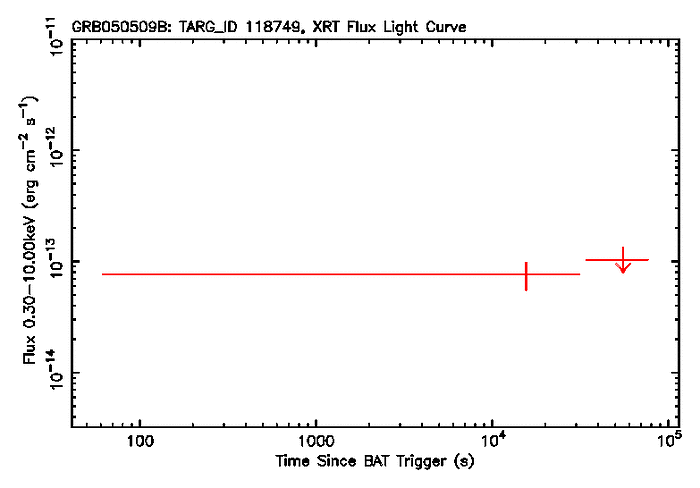
The XRT PC/WT light curves plotted here were extracted using the Swift software task xrtgrblc starting from the cleaned event files. These were first reprocessed from the archive event files using the Swift software task xrtpipeline, with the default parameters. The regions used to extract the events change based on the count rate, e.g. a smaller region for lower count rates. The light curve time bins are derived using a step binning algorithm, where the number of counts/bin depends on the count rate in that bin. A downwards arrow signifies the 3-sigma upper limit for that time bin.
Using xrtgrblc, we derived a corrected, a flux and a hardness ratio light curve.
XRT Corrected Light Curve
The corrected light curve is the net light curve (source - background) corrected for exposure and PSF effects using the Swift software task xrtlccorr. The horizontal lines at the top of the plot indicate the time boundaries of each OBS_ID included in the light curve - they alternate between black and green when the OBS_ID changes. The up-arrows indicate when the region size changed in extracting the light curve. Several changes in quick succession are common as the light curve fades or if there is flaring activity. This is due to the fluctuating count rate.
Shown below the light curve is the fractional exposure for each bin. This
can be quite low if many orbits (or OBS_IDs) are combined in a single bin, or
if there is significant mode switching during a bin.
XRT Flux Converted Light Curve
The corrected light curve was converted to flux in a time-dependent manner. The conversion factors from rate to flux were derived by fitting spectra extracted from the rate-dependent regions. Each spectrum was modelled with a double absorbed power-law using a fixed Galactic absorption from the FTOOL nh. The intrinsic absorption parameter was allowed to vary freely.
The mean flux conversion for this GRB is: 5e-11 ergs cm-2 count-1
XRT Hardness Ratios
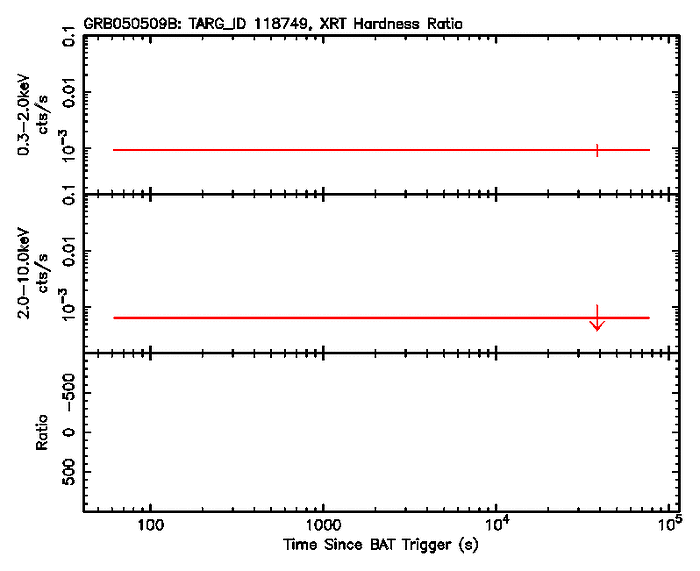
The hardness ratio was calculated as the ratio of the 2-10 keV to 0.3-2 keV light curves. The time bins were determined using the same algorithm as for the corrected curve above, but applied only to the hard light curve (2-10 keV). The bin boundaries were then applied to the soft light curve (0.3-2 keV), and the ratio calculated.
UVOT Light Curves
The UVOT light curves below were extracted from the individual UVOT images from each filter. However, to increase the signal to noise ratio, several images may have been summed. The source and background extraction regions were determined using a combination of Ximage and the Swift software task uvotdetect.
The source extraction region depends on the source brightness, as well as the brightness and size of the nearest neighbors. If the region used was less than 5“, then the aperture correction was most likely estimated using field stars.
The background region was selected from three annuli centered on the burst position - 15“-27“; 27“-35“; or 35“-42“. The region, minus any field source regions, with the lowest mean count rate was chosen. If the chosen region was found to be contaminated, then a custom background region was chosen by a staff scientist.
See this paper for details.
UVOT Magnitude Light Curves
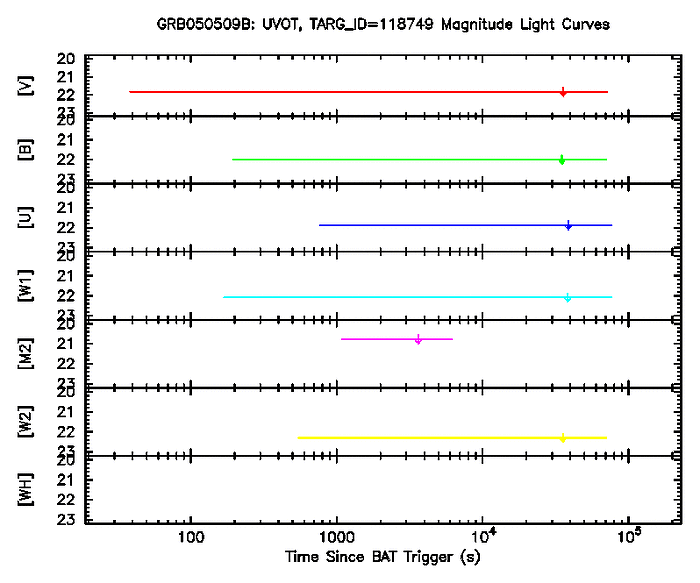
The magnitudes shown below were extracted using the Swift software tool uvotsource. Down-arrows indicate the three-sigma upper limit for that bin.
UVOT Flux Converted Light Curves
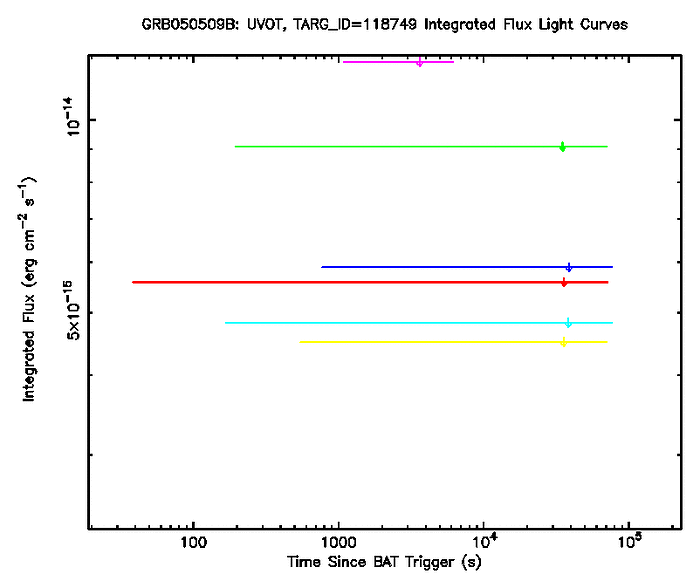
The flux light curves shown below were converted from flux density to integrated flux using flux conversion factors determined by integrating a power-law spectrum of index 1 over the instrument response of each filter. The table below gives the conversion factors used for each filter.
| Filter Name | Conversion Factor* |
|---|---|
| V | 8.240 × 10⁻¹³ |
| B | 1.405 × 10⁻¹² |
| U | 2.286 × 10⁻¹² |
| UVW1 | 3.587 × 10⁻¹² |
| UVM2 | 3.355 × 10⁻¹² |
| UVW2 | 5.030 × 10⁻¹² |
| WHITE | 1.085 × 10⁻¹¹ |
| * Units are: erg cm-2 s-1 mJy-1 | |
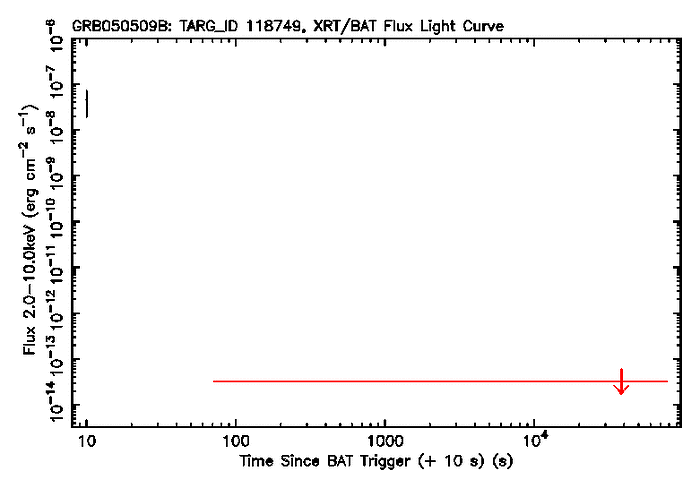
BAT/XRT Flux Light Curves
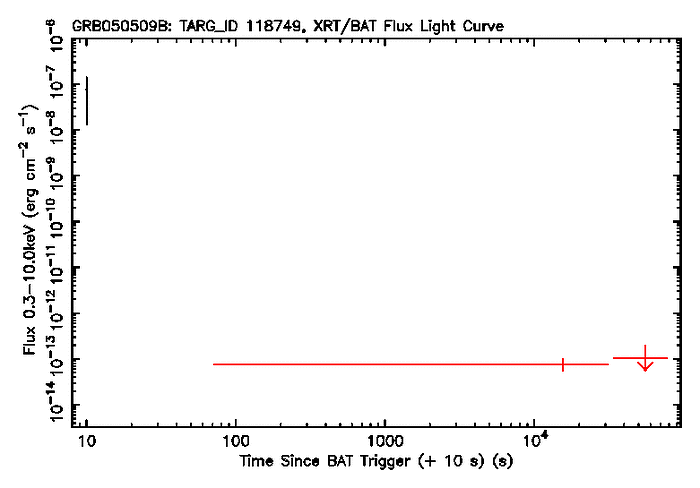
To produce the BAT+XRT light curves, the BAT Bayesian block light curve (15-150 keV) was converted to both the 2-10 keV XRT energy range and the 0.3-10 keV XRT energy range. This was done by extracting a spectrum from the BAT event data for each Bayesian block (as found with the Swift software task batgrbproduct). Each spectrum was fitted with an unabsorbed power-law in Xspec, and the model flux was extrapolated into the respective XRT energy range. The errors in each BAT light curve bin were found by randomly sampling the fitted model parameters within their respective confidence intervals 1000 times, and recalculating the flux each time. The 1-sigma confidence interval in this flux conversion sample is used as the error.
NOTE: This flux conversion method assumes a constant spectrum from the BAT
to XRT energy ranges, which may not be a valid assumption.
BAT+XRT 0.3-10 keV Flux Light Curves
BAT+XRT 2-10 keV Flux Light Curves
