GRB 050904 Images
BAT Images
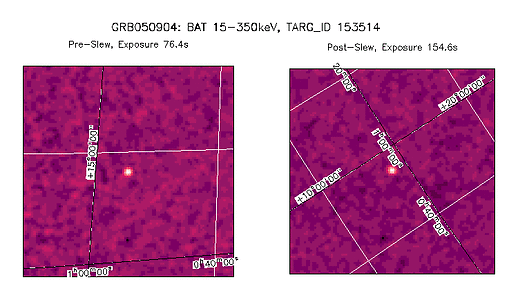
BAT Field of View Images
The image below shows either the pre-slew, post-slew or both, 15-350 keV BAT “postage-stamp” images centered on the GRB. These images are produced by the Swift software task batgrbproduct, and plotted with the Xanadu imaging software tool Ximage.
XRT Images
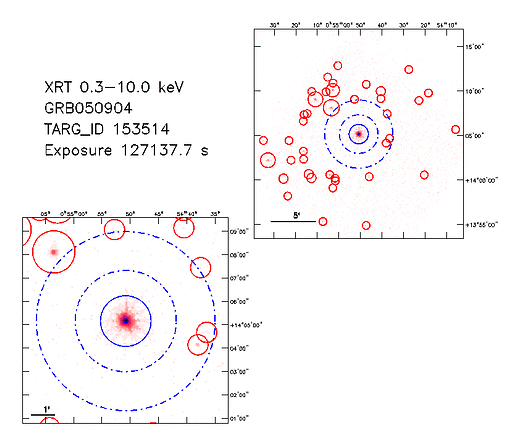
XRT PC Mode Combined Events Image
The image below shows the XRT PC mode combined event data for all OBS_IDs related to this burst. The blue circle (or annulus, if pileup is a factor) is the extraction region used for the interval with the highest raw count rate, and the blue dashed annulus is the background region used for that interval. Red circles indicate field sources detected with the detect command in the Xanadu imaging software tool Ximage, and were excluded from any extracted light curves.
XRT PC Mode Individual Event File Image Mosaic
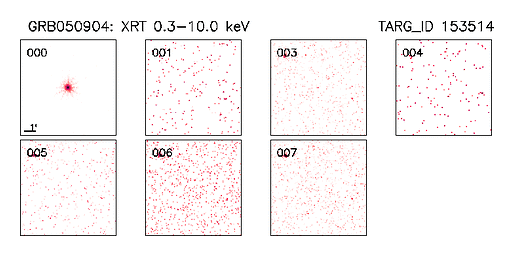
The mosaic of images below shows the event data for every OBS_ID included in the XRT PC mode analysis for this burst. The segment number for each OBS_ID is shown in the upper left of each frame.
NOTE: For some OBS_IDs there are multiple XRT PC submodes used, resulting in
multiple images with the same segment number.
XRT WT Mode Highest Sigma Interval Image
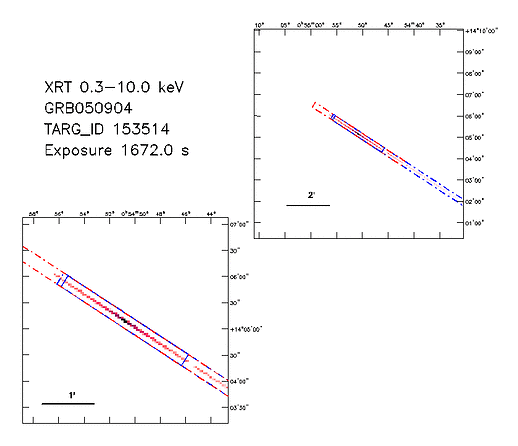
The image below shows the XRT WT mode event data for the interval with the highest signal to noise ratio. The blue box is the extraction region used for this interval, and a smaller red dashed box (if any) indicates the region excluded to account for detector pileup. The blue dashed box is the background region used for that interval, and the large red dashed box indicates the region excluded from the background region.
XRT WT Mode Individual Event File Image Mosaic
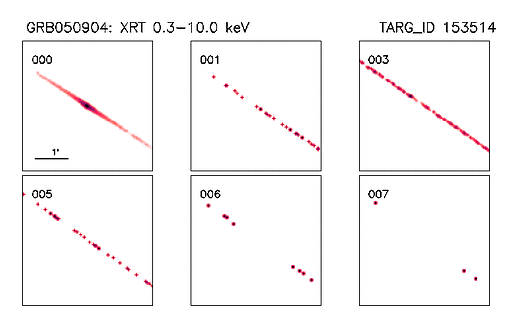
The mosaic of images below shows the event data for every OBS_ID included in the XRT WT mode analysis for this burst. The segment number for each OBS_ID is shown in the upper left of each frame.
NOTE: For some OBS_IDs there are multiple XRT WT submodes used, resulting in
multiple images with the same segment number.
UVOT Images
UVOT Highest Sigma Image
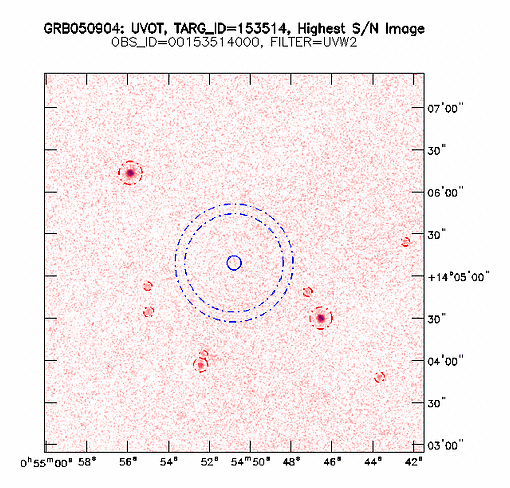
The image below shows the UVOT summed image with the highest signal to noise ratio for this burst. The blue dashed region indicates the background region used for this OBS_ID and filter combination, the solid blue circle indicates the aperture used for photometry, and the red dashed circles indicate detected field sources that were excluded from the background.
UVOT Finding Chart Image
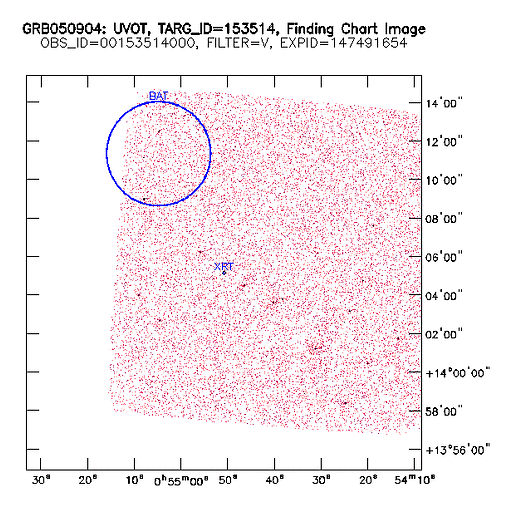
The image below shows the earliest and most sensitive snapshot of this burst. Overplotted on this image are the BAT and XRT error circles.
