Estimated redshift from machine learning (Ukwatta et al. 2016) - may take a few minute to calcaulte
Image
Pre-slew 15.0-350.0 keV image (Event data)

#   RAcent    DECcent   POSerr    Theta     Phi              Peak Cts       SNR   Name
   20.8341    27.7220   0.0235    14.7395   -14.7838         0.6958510      8.179 TRIG_01000255

Foreground time interval of the image:
 30.164  69.840 (delta_t =  39.676 [sec])
Background time interval of the image:
-143.699  30.164 (delta_t = 173.863 [sec])
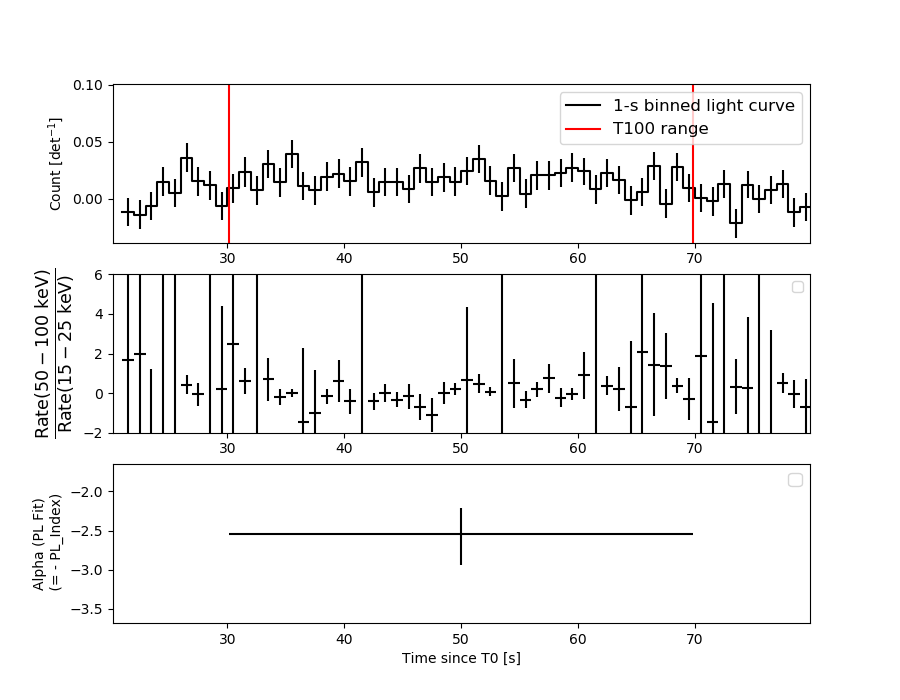
Lightcurves
Notes:
- 1) The mask-weighted light curves are using the flight position.
- 2) Multiple plots of different time binning/intervals are shown to cover all scenarios of short/long GRBs, rate/image triggers, and real/false positives.
- 3) For all the mask-weighted lightcurves, the y-axis units are counts/sec/det where a det is 0.4 x 0.4 = 0.16 sq cm.
- 4) The verticle lines correspond to following: green dotted lines are T50 interval, black dotted lines are T90 interval, blue solid line(s) is a spacecraft slew start time, and orange solid line(s) is a spacecraft slew end time.
- 5) Time of each bin is in the middle of the bin.
1 s binning
From T0-310 s to T0+310 s

From T100_start - 20 s to T100_end + 30 s

Full time interval

64 ms binning
Full time interval

From T100_start to T100_end

From T0-5 sec to T0+5 sec

16 ms binning
From T100_start-5 s to T100_start+5 s

8 ms binning
From T100_start-3 s to T100_start+3 s

2 ms binning
From T100_start-1 s to T100_start+1 s

SN=5 or 10 sec. binning (whichever binning is satisfied first)

SN=5 or 10 sec. binning (T < 200 sec)

Quad-rate summed light curves (from T0-300s to T0+1000s)

Spectral Evolution
Spectra
Notes:
- 1) The fitting includes the systematic errors.
- 2) When the burst includes telescope slew time periods, the fitting uses an average response file made from multiple 5-s response files through out the slew time plus single time preiod for the non-slew times, and weighted by the total counts in the corresponding time period using addrmf. An average response file is needed becuase a spectral fit using the pre-slew DRM will introduce some errors in both a spectral shape and a normalization if the PHA file contains a lot of the slew/post-slew time interval.
- 3) For fits to more complicated models (e.g. a power-law over a cutoff power-law), the BAT team has decided to require a chi-square improvement of more than 6 for each extra dof.
Time averaged spectrum fit using the average DRM
Power-law model

Time interval is from   30.164 sec. to   69.840 sec.

Spectral model in power-law:
------------------------------------------------------------
Parameters  : value       lower 90%   higher 90%
Photon index: 2.54960     ( -0.342528   0.396749 )
Norm@50keV  : 7.63774E-04    ( -0.00022885   0.000233972 )
------------------------------------------------------------
#Fit statistic  : Chi-Squared                   50.77     using 59 bins.
 Reduced chi-squared = 0.890702
# Null hypothesis probability of 7.06e-01 with 57 degrees of freedom

Photon flux (15-150 keV)    in 39.68 sec: 0.154740 ( -0.025303  0.02536 ) ph/cm2/s
Energy fluence (15-150 keV)             : 3.07356e-07 ( -6.57926e-08  7.07657e-08 ) ergs/cm2
Cutoff power-law model

Time interval is from   30.164 sec. to   69.840 sec.
Spectral model in the cutoff power-law:
------------------------------------------------------------
Parameters  : value       lower 90%   higher 90%
Photon index: 0.696954     ( -3.59785   1.31087 )
Epeak [keV] : 21.1615      ( -20.289 7.72568 )
Norm@50keV  : 1.48962E-02    ( -0.0157064   7.14099 )
------------------------------------------------------------
#Fit statistic  : Chi-Squared                   48.56     using 59 bins.
 Reduced chi-squared = 0.867143
# Null hypothesis probability of 7.49e-01 with 56 degrees of freedom

Photon flux (15-150 keV)    in 39.68 sec: 0.149686 ( -0.0246  0.025095 ) ph/cm2/s
Energy fluence (15-150 keV)             : 2.58185e-07 ( -5.59758e-08  8.18479e-08 ) ergs/cm2
Band function

Time interval is from   30.164 sec. to   69.840 sec.


Spectral model in the Band function:
------------------------------------------------------------
Parameters  : value       lower 90%   higher 90%
alpha       :    (     )
beta        :     (     )
Epeak [keV] :       (   )
Norm@50keV   :     (     )
------------------------------------------------------------

Photon flux (15-150 keV)    in  sec:  (    ) ph/cm2/s
Energy fluence (15-150 keV)             : 0 ( 0  0 ) ergs/cm2
Single BB

Spectral model blackbody:
------------------------------------------------------------
Parameters  : value    Lower 90%  Upper 90%
kT [keV]    : 6.27132  (-1.00528  1.18902)
R^2/D10^2   : 0.476301  (-0.246901   0.526842)
(R is the radius in km and D10 is the distance to the source in units of 10 kpc)
------------------------------------------------------------
#Fit statistic  : Chi-Squared                   50.09     using 59 bins.
 Reduced chi-squared =
# Null hypothesis probability of 7.30e-01 with 57 degrees of freedom

Energy  Fluence     90% Error
[keV]   [erg/cm2]   [erg/cm2]
15- 25  1.050e-07   3.301e-08
25- 50  1.151e-07   3.649e-08
50-150  1.259e-08   8.183e-09
15-150  2.326e-07   6.537e-08
Thermal bremsstrahlung (OTTB)

Spectral model: thermal bremsstrahlung
------------------------------------------------------------
Parameters  : value         Lower 90%    Upper 90%
kT [keV]    : 26.3901       (-8.31133      13.7581)
Norm        : 1.40621       (-0.430496     0.688058)
------------------------------------------------------------
#Fit statistic  : Chi-Squared                   48.76     using 59 bins.
 Reduced chi-squared =
# Null hypothesis probability of 7.73e-01 with 57 degrees of freedom

Energy  Fluence     90% Error
[keV]   [erg/cm2]   [erg/cm2]
15- 25  1.057e-07   2.309e-08
25- 50  1.121e-07   3.016e-08
50-150  5.154e-08   3.349e-08
15-150  2.694e-07   7.801e-08
Double BB

Spectral model: bbodyrad<1> + bbodyrad<2>
------------------------------------------------------------
Parameters  : value         Lower 90%    Upper 90%
kT1 [keV]   : 5.09482        (-5.14758      1.85843)
R1^2/D10^2  : 0.926221        (-0.895646      -0.895646)
kT2 [keV]   : 13.5503        (-14.1138      -14.1138)
R2^2/D10^2  : 7.80910E-03    (-0.00643241   0.624769)
------------------------------------------------------------
#Fit statistic  : Chi-Squared                   47.78     using 59 bins.
 Reduced chi-squared =
# Null hypothesis probability of 7.44e-01 with 55 degrees of freedom

Energy  Fluence     90% Error
[keV]   [erg/cm2]   [erg/cm2]
15- 25  1.084e-07   6.262e-08
25- 50  1.092e-07   5.887e-08
50-150  5.445e-08   3.327e-08
15-150  2.720e-07   1.464e-07
Peak spectrum fit
Power-law model

Time interval is from   59.440 sec. to   60.440 sec.

Spectral model in power-law:
------------------------------------------------------------
Parameters  : value       lower 90%   higher 90%
Photon index: 2.19005     ( -1.11809   1.77313 )
Norm@50keV  : 1.97185E-03    ( -0.00197067   0.00147387 )
------------------------------------------------------------
#Fit statistic  : Chi-Squared                   56.32     using 59 bins.
 Reduced chi-squared = 0.98807
# Null hypothesis probability of 5.00e-01 with 57 degrees of freedom

Photon flux (15-150 keV)    in 1 sec: 0.324762 ( -0.154211  0.154048 ) ph/cm2/s
Energy fluence (15-150 keV)             : 1.85089e-08 ( -1.13391e-08  1.37783e-08 ) ergs/cm2
Cutoff power-law model

Time interval is from   59.440 sec. to   60.440 sec.
Spectral model in the cutoff power-law:
------------------------------------------------------------
Parameters  : value       lower 90%   higher 90%
Photon index: 1.98699     (     )
Epeak [keV] : 25.9604      (   )
Norm@50keV  : 2.24315E-03    (     )
------------------------------------------------------------
#Fit statistic  : Chi-Squared                   56.42     using 59 bins.
 Reduced chi-squared = 1.0075
# Null hypothesis probability of 4.59e-01 with 56 degrees of freedom

Photon flux (15-150 keV)    in 1 sec: 0.296347 ( -0.296347  0.161191 ) ph/cm2/s
Energy fluence (15-150 keV)             : 1.80443e-08 ( -1.6856e-08  1.09051e-08 ) ergs/cm2
Band function

Time interval is from   59.440 sec. to   60.440 sec.


Spectral model in the Band function:
------------------------------------------------------------
Parameters  : value       lower 90%   higher 90%
alpha       :    (     )
beta        :     (     )
Epeak [keV] :       (   )
Norm@50keV   :     (     )
------------------------------------------------------------

Photon flux (15-150 keV)    in  sec:  (    ) ph/cm2/s
Energy fluence (15-150 keV)             : 0 ( 0  0 ) ergs/cm2
Single BB

Spectral model blackbody:
------------------------------------------------------------
Parameters  : value    Lower 90%  Upper 90%
kT [keV]    : 6.51328  (-3.27602  6.66419)
R^2/D10^2   : 0.779974  (-0.775798   17.3111)
(R is the radius in km and D10 is the distance to the source in units of 10 kpc)
------------------------------------------------------------
#Fit statistic  : Chi-Squared                   57.90     using 59 bins.
 Reduced chi-squared =
# Null hypothesis probability of 4.42e-01 with 57 degrees of freedom

Energy  Fluence     90% Error
[keV]   [erg/cm2]   [erg/cm2]
15- 25  4.902e-09   3.037e-09
25- 50  5.814e-09   3.983e-09
50-150  7.369e-10   7.515e-10
15-150  1.145e-08   7.770e-09
Thermal bremsstrahlung (OTTB)

Spectral model: thermal bremsstrahlung
------------------------------------------------------------
Parameters  : value         Lower 90%    Upper 90%
kT [keV]    : 41.5936       (-41.9919      -41.9919)
Norm        : 1.99408       (-1.27063     7.38263)
------------------------------------------------------------
#Fit statistic  : Chi-Squared                   56.98     using 59 bins.
 Reduced chi-squared =
# Null hypothesis probability of 4.76e-01 with 57 degrees of freedom

Energy  Fluence     90% Error
[keV]   [erg/cm2]   [erg/cm2]
15- 25  4.638e-09   2.989e-09
25- 50  6.204e-09   4.185e-09
50-150  5.006e-09   4.585e-09
15-150  1.585e-08   1.087e-08
Double BB

Spectral model: bbodyrad<1> + bbodyrad<2>
------------------------------------------------------------
Parameters  : value         Lower 90%    Upper 90%
kT1 [keV]   : 5.61945        (-3.25386      4.46504)
R1^2/D10^2  : 1.34610        (-1.37384      91.3637)
kT2 [keV]   : 200.000        (-200      -200)
R2^2/D10^2  : 5.64889E-05    (-2.82457e-05   0.000465737)
------------------------------------------------------------
#Fit statistic  : Chi-Squared                   55.11     using 59 bins.
 Reduced chi-squared =
# Null hypothesis probability of 4.71e-01 with 55 degrees of freedom

Energy  Fluence     90% Error
[keV]   [erg/cm2]   [erg/cm2]
15- 25  5.216e-09   3.288e-09
25- 50  4.929e-09   3.245e-09
50-150  1.542e-08   1.047e-08
15-150  2.556e-08   1.384e-08
Pre-slew spectrum (Pre-slew PHA with pre-slew DRM)
Power-law model
Spectral model in power-law:
------------------------------------------------------------
Parameters  : value       lower 90%   higher 90%
Photon index: 2.54960     ( -0.342528   0.396749 )
Norm@50keV  : 7.63774E-04    ( -0.00022885   0.000233972 )
------------------------------------------------------------
#Fit statistic  : Chi-Squared                   50.77     using 59 bins.
 Reduced chi-squared =
# Null hypothesis probability of 7.06e-01 with 57 degrees of freedom

Photon flux (15-150 keV)    in 39.68 sec: 0.154717 ( -0.0253006  0.0253573 ) ph/cm2/s
Energy fluence (15-150 keV)             : 3.07276e-07 ( -6.57827e-08  7.08236e-08 ) ergs/cm2
Cutoff power-law model
Spectral model in the cutoff power-law:
------------------------------------------------------------
Parameters  : value       lower 90%   higher 90%
Photon index: 0.693945     ( -3.59573   1.54136 )
Epeak [keV] : 21.1732      ( -21.0252 7.71363 )
Norm@50keV  : 1.49716E-02    ( -0.01573   7.1414 )
------------------------------------------------------------
#Fit statistic  : Chi-Squared                   48.56     using 59 bins.
 Reduced chi-squared =
# Null hypothesis probability of 7.49e-01 with 56 degrees of freedom

Photon flux (15-150 keV)    in 39.68 sec: 0.149641 ( -0.024584  0.025073 ) ph/cm2/s
Energy fluence (15-150 keV)             : 2.582e-07 ( -5.60623e-08  8.28844e-08 ) ergs/cm2
Band function
Spectral model in the Band function:
------------------------------------------------------------
Parameters  : value       lower 90%   higher 90%
alpha       :    (     )
beta        :     (     )
Epeak [keV] :       (   )
Norm@50keV   :     (     )
------------------------------------------------------------

Photon flux (15-150 keV)    in  sec:  (    ) ph/cm2/s
Energy fluence (15-150 keV)             : 0 ( 0  0 ) ergs/cm2
S(25-50 keV) vs. S(50-100 keV) plot

S(25-50 keV)  = 1.02e-07
S(50-100 keV) = 6.98e-08
T90 vs. Hardness ratio plot

T90                                   = 36.1959998607635 sec.
Hardness ratio (energy fluence ratio) = 0.684314
Color vs. Color plot

Count Ratio  (25-50 keV) / (15-25 keV) = 0.682981
Count Ratio (50-100 keV) / (15-25 keV) = 0.0953286
Mask shadow pattern

IMX = 2.543736476525352E-01, IMY = 6.713140143594612E-02
TIME vs. PHA plot around the trigger time
TIME vs. DetID plot around the trigger time

100 us light curve (15-350 keV)

Spacecraft aspect plot
Bright source in the pre-burst/pre-slew/post-slew images
Pre-burst image of 15-350 keV band
Time interval of the image:
-143.699400 30.164000

# RAcent  DECcent POSerr Theta    Phi  PeakCts   SNR AngSep     Name
#  [deg]    [deg]    ['] [deg]  [deg]                   [']
 34.3986  50.8998    2.8  39.4   -0.8   1.1911   4.2 ------	UNKNOWN
 30.9102  47.9233    2.5  35.9   -2.8   1.2567   4.5 ------	UNKNOWN
Pre-slew background subtracted image of 15-350 keV band
Time interval of the image:
30.164000 69.840000

# RAcent  DECcent POSerr Theta    Phi  PeakCts   SNR AngSep     Name
#  [deg]    [deg]    ['] [deg]  [deg]                   [']
 21.1331 -40.1339    1.9  53.1  165.8   2.1541   6.0 ------	UNKNOWN
 20.8341  27.7220    1.4  14.7  -14.8   0.6959   8.2 ------	UNKNOWN
Post-slew image of 15-350 keV band
Time interval of the image:
153.500600 864.200600

# RAcent  DECcent POSerr Theta    Phi  PeakCts   SNR AngSep     Name
#  [deg]    [deg]    ['] [deg]  [deg]                   [']
 83.6405  22.0295    1.1  56.6  -10.5  23.4354  10.0    1.0	Crab
326.1782  38.2412    5.8  46.4 -153.4  -2.6695  -2.0    4.8	Cyg X-2
 11.3576  -6.4888    3.4  35.4  105.3   4.0270   3.4 ------	UNKNOWN
 56.3477   4.9141    3.1  40.7   26.3   3.6720   3.8 ------	UNKNOWN
326.2221  18.5741    2.4  50.7 -179.1   7.9622   4.9 ------	UNKNOWN
 36.5873  57.7850    3.1  32.1  -75.4   3.5047   3.7 ------	UNKNOWN
 84.3766  46.7581    3.6  52.5  -40.6   9.3959   3.2 ------	UNKNOWN
319.8768  51.7604    3.2  50.9 -135.4  11.6592   3.6 ------	UNKNOWN
 74.3280  56.0888    2.8  47.2  -53.5  11.4071   4.2 ------	UNKNOWN
Plot creation:
Sat Jul 30 07:31:34 EDT 2022