Estimated redshift from machine learning (Ukwatta et al. 2016) - may take a few minute to calcaulte
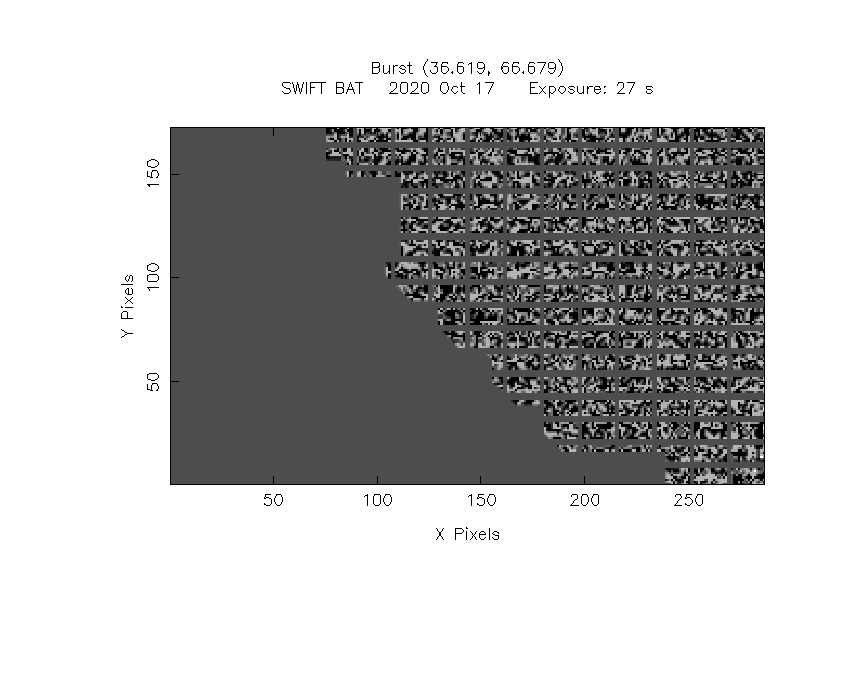
Image
Pre-slew 15.0-350.0 keV image (Event data)
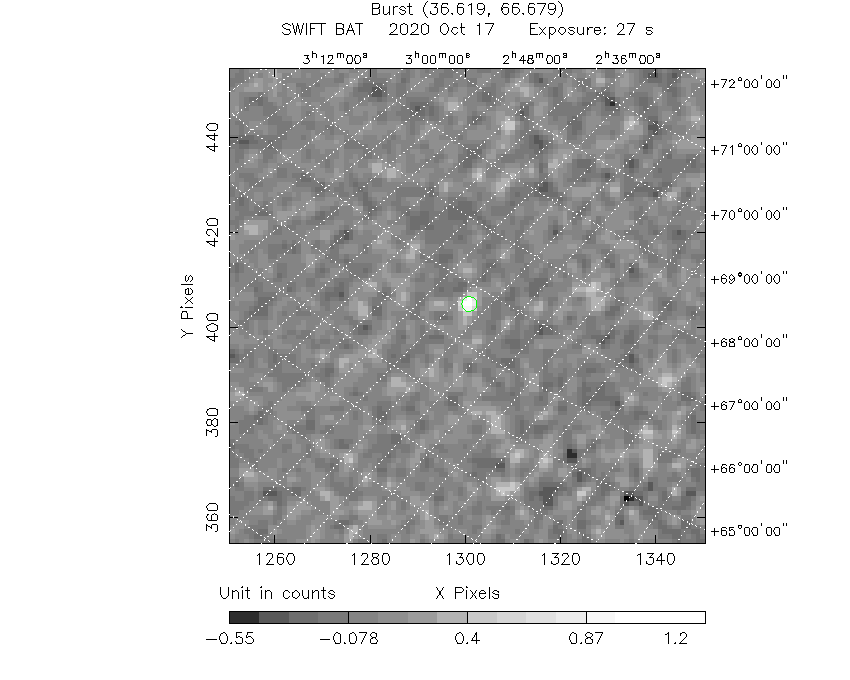
#   RAcent    DECcent   POSerr    Theta     Phi              Peak Cts       SNR   Name
   36.6021    66.6707   0.0203    41.9154   170.3374         1.2993607      9.408 TRIG_01000613

Foreground time interval of the image:
 -2.768  23.872 (delta_t =  26.640 [sec])
Background time interval of the image:
-239.088  -2.768 (delta_t = 236.320 [sec])
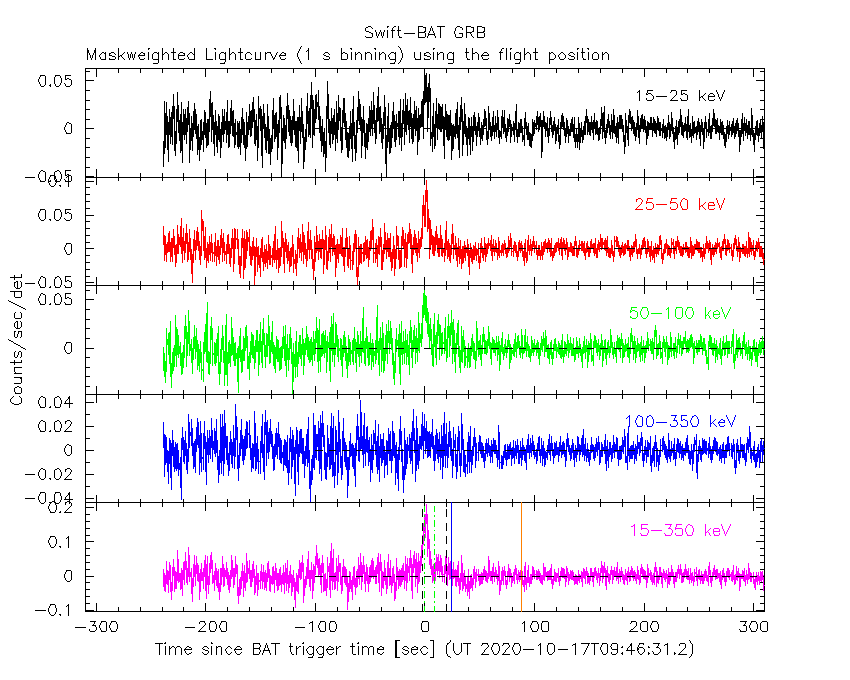
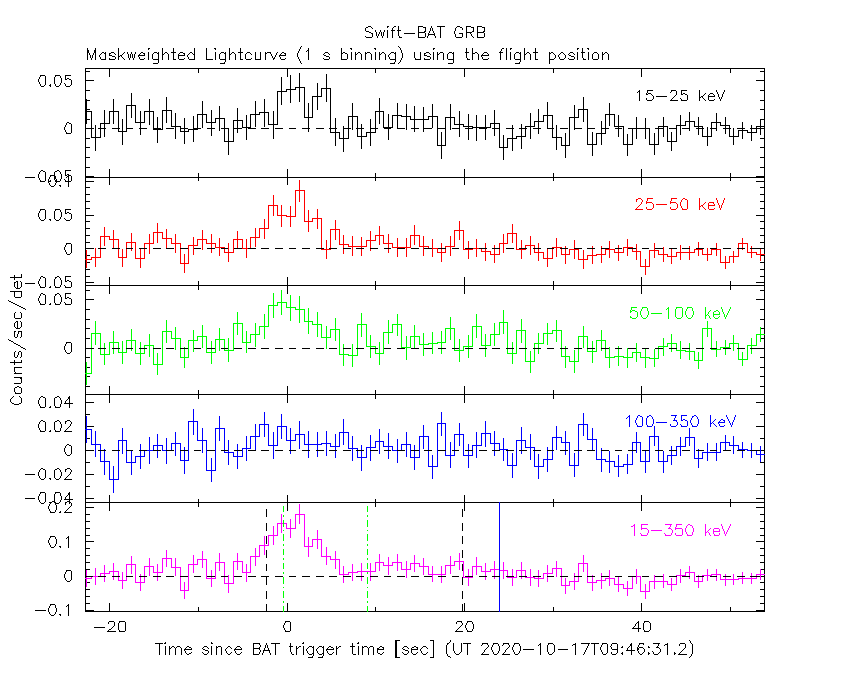
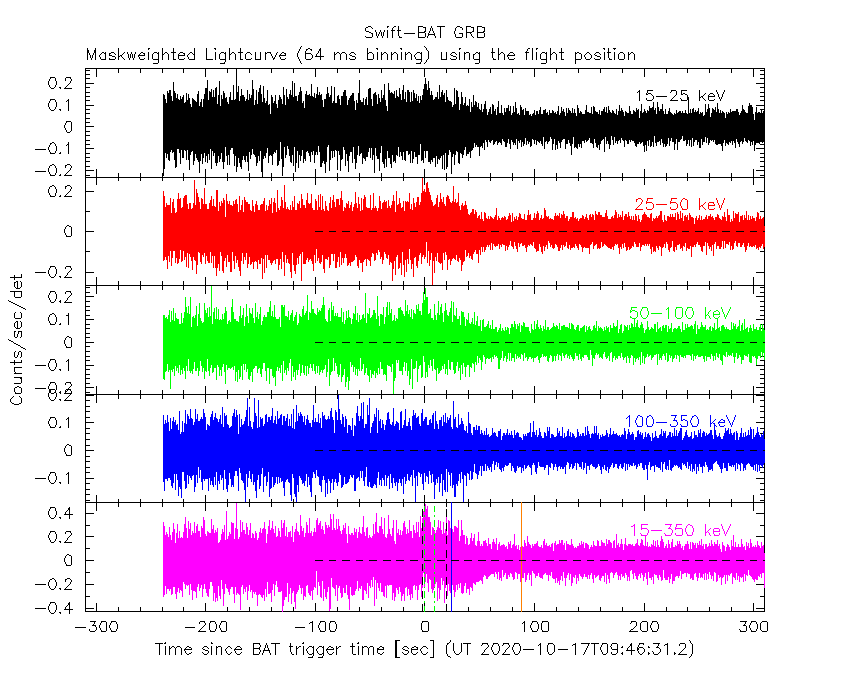
Lightcurves
Notes:
- 1) The mask-weighted light curves are using the flight position.
- 2) Multiple plots of different time binning/intervals are shown to cover all scenarios of short/long GRBs, rate/image triggers, and real/false positives.
- 3) For all the mask-weighted lightcurves, the y-axis units are counts/sec/det where a det is 0.4 x 0.4 = 0.16 sq cm.
- 4) The verticle lines correspond to following: green dotted lines are T50 interval, black dotted lines are T90 interval, blue solid line(s) is a spacecraft slew start time, and orange solid line(s) is a spacecraft slew end time.
- 5) Time of each bin is in the middle of the bin.
1 s binning
From T0-310 s to T0+310 s
From T100_start - 20 s to T100_end + 30 s
Full time interval

64 ms binning
Full time interval
From T100_start to T100_end

From T0-5 sec to T0+5 sec

16 ms binning
From T100_start-5 s to T100_start+5 s

Blue+Cyan dotted lines: Time interval of the scaled map
From 0.000000 to 2.048000
8 ms binning
From T100_start-3 s to T100_start+3 s

Blue+Cyan dotted lines: Time interval of the scaled map
From 0.000000 to 2.048000
2 ms binning
From T100_start-1 s to T100_start+1 s
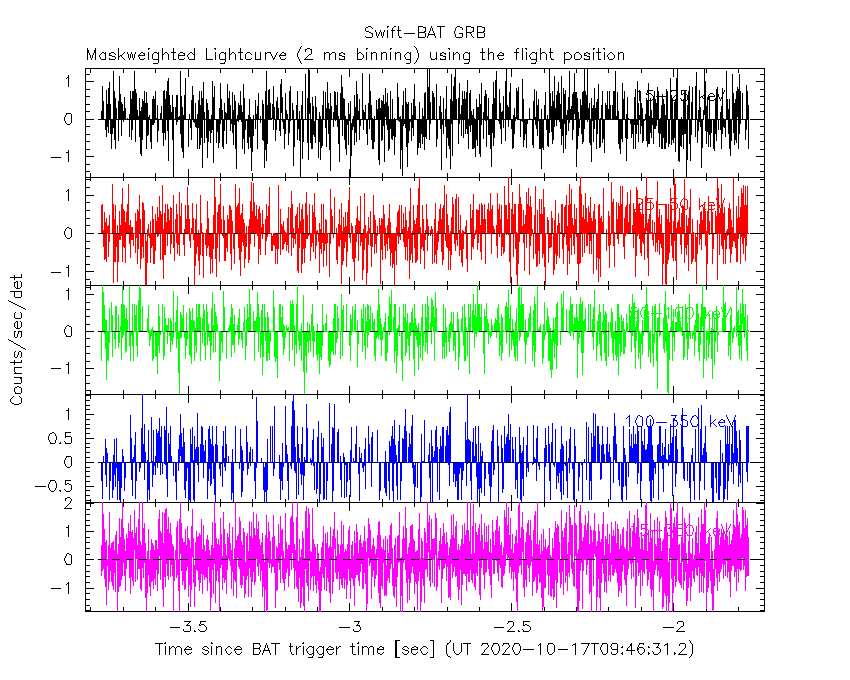
Blue+Cyan dotted lines: Time interval of the scaled map
From 0.000000 to 2.048000
SN=5 or 10 sec. binning (whichever binning is satisfied first)

SN=5 or 10 sec. binning (T < 200 sec)

Quad-rate summed light curves (from T0-300s to T0+1000s)

Spectral Evolution

Spectra
Notes:
- 1) The fitting includes the systematic errors.
- 2) When the burst includes telescope slew time periods, the fitting uses an average response file made from multiple 5-s response files through out the slew time plus single time preiod for the non-slew times, and weighted by the total counts in the corresponding time period using addrmf. An average response file is needed becuase a spectral fit using the pre-slew DRM will introduce some errors in both a spectral shape and a normalization if the PHA file contains a lot of the slew/post-slew time interval.
- 3) For fits to more complicated models (e.g. a power-law over a cutoff power-law), the BAT team has decided to require a chi-square improvement of more than 6 for each extra dof.
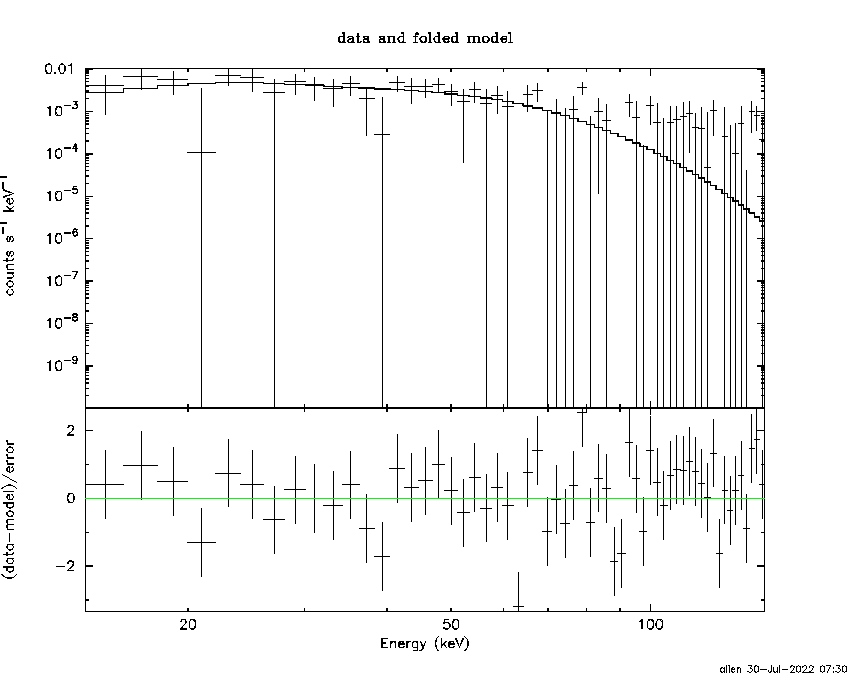
Time averaged spectrum fit using the average DRM
Power-law model
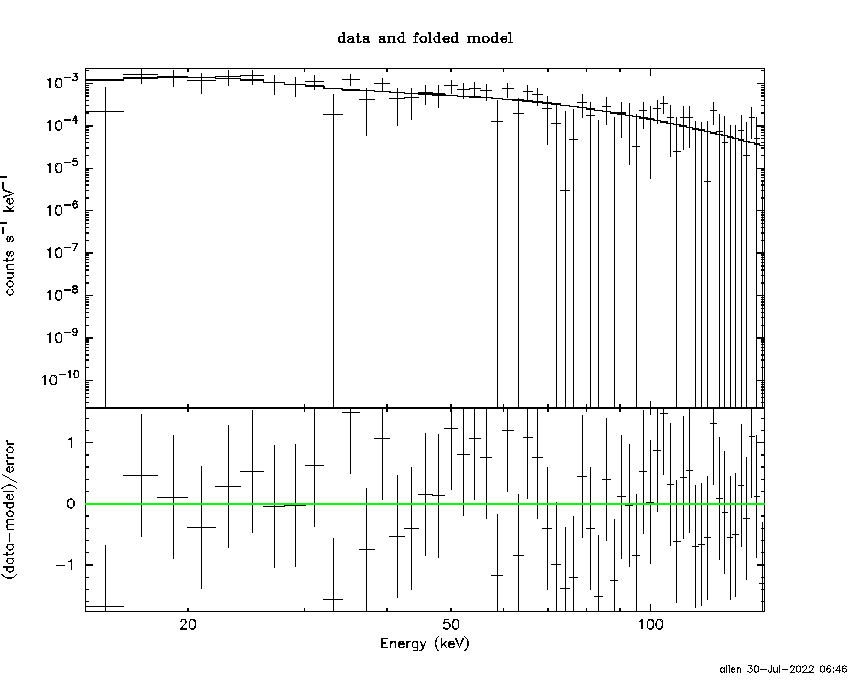
Time interval is from   -2.768 sec. to   23.872 sec.

Spectral model in power-law:
------------------------------------------------------------
Parameters  : value       lower 90%   higher 90%
Photon index: 1.48355     ( -0.246728   0.246246 )
Norm@50keV  : 3.57583E-03    ( -0.000527377   0.000525867 )
------------------------------------------------------------
#Fit statistic  : Chi-Squared                   40.43     using 59 bins.
 Reduced chi-squared = 0.709298
# Null hypothesis probability of 9.53e-01 with 57 degrees of freedom

Photon flux (15-150 keV)    in 26.64 sec: 0.444471 ( -0.06738  0.067621 ) ph/cm2/s
Energy fluence (15-150 keV)             : 9.06285e-07 ( -1.43004e-07  1.44162e-07 ) ergs/cm2
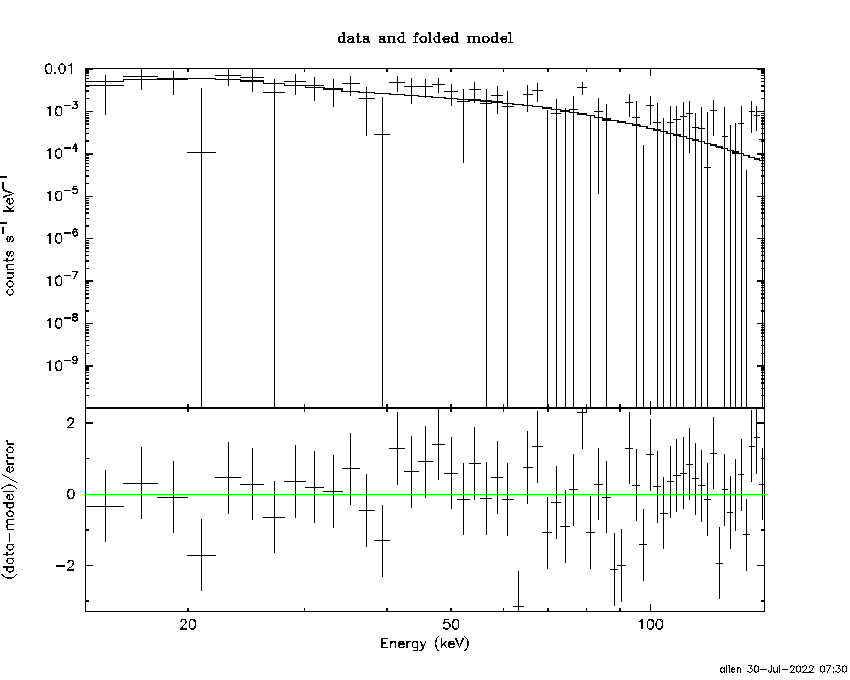
Cutoff power-law model
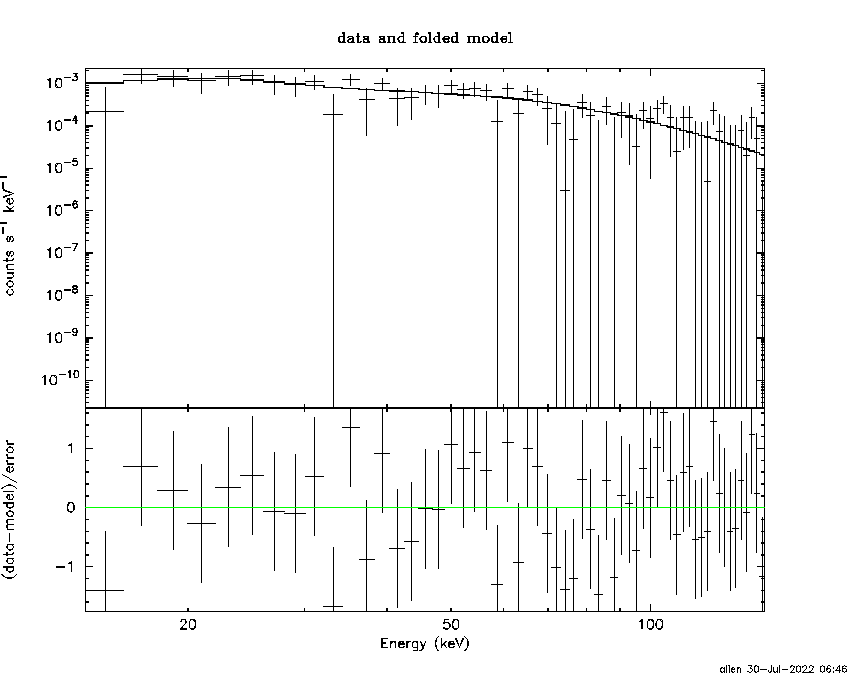
Time interval is from   -2.768 sec. to   23.872 sec.
Spectral model in the cutoff power-law:
------------------------------------------------------------
Parameters  : value       lower 90%   higher 90%
Photon index: 0.920801     ( -1.28655   0.753416 )
Epeak [keV] : 95.8954      ( -38.3595 -95.9249 )
Norm@50keV  : 6.91033E-03    ( -0.00375115   0.0234671 )
------------------------------------------------------------
#Fit statistic  : Chi-Squared                   39.53     using 59 bins.
 Reduced chi-squared = 0.705893
# Null hypothesis probability of 9.53e-01 with 56 degrees of freedom

Photon flux (15-150 keV)    in 26.64 sec: 0.435409 ( -0.069693  0.0696 ) ph/cm2/s
Energy fluence (15-150 keV)             : 8.727e-07 ( -1.58739e-07  1.56629e-07 ) ergs/cm2
Band function

Time interval is from   -2.768 sec. to   23.872 sec.


Spectral model in the Band function:
------------------------------------------------------------
Parameters  : value       lower 90%   higher 90%
alpha       :    (     )
beta        :     (     )
Epeak [keV] :       (   )
Norm@50keV   :     (     )
------------------------------------------------------------

Photon flux (15-150 keV)    in  sec:  (    ) ph/cm2/s
Energy fluence (15-150 keV)             : 0 ( 0  0 ) ergs/cm2
Single BB
Spectral model blackbody:
------------------------------------------------------------
Parameters  : value    Lower 90%  Upper 90%
kT [keV]    : 14.8278  (-2.3501  2.96452)
R^2/D10^2   : 5.37247E-02  (-0.0258355   0.046092)
(R is the radius in km and D10 is the distance to the source in units of 10 kpc)
------------------------------------------------------------
#Fit statistic  : Chi-Squared                   46.85     using 59 bins.
 Reduced chi-squared =
# Null hypothesis probability of 8.29e-01 with 57 degrees of freedom

Energy  Fluence     90% Error
[keV]   [erg/cm2]   [erg/cm2]
15- 25  6.600e-08   1.853e-08
25- 50  2.595e-07   5.816e-08
50-150  3.862e-07   1.118e-07
15-150  7.117e-07   1.487e-07
Thermal bremsstrahlung (OTTB)

Spectral model: thermal bremsstrahlung
------------------------------------------------------------
Parameters  : value         Lower 90%    Upper 90%
kT [keV]    : 199.363       (-85.1912      -199.363)
Norm        : 1.83755       (-0.267287     0.267366)
------------------------------------------------------------
#Fit statistic  : Chi-Squared                   39.94     using 59 bins.
 Reduced chi-squared =
# Null hypothesis probability of 9.58e-01 with 57 degrees of freedom

Energy  Fluence     90% Error
[keV]   [erg/cm2]   [erg/cm2]
15- 25  1.219e-07   6.876e-08
25- 50  2.345e-07   1.310e-07
50-150  5.143e-07   2.836e-07
15-150  8.706e-07   4.823e-07
Double BB

Spectral model: bbodyrad<1> + bbodyrad<2>
------------------------------------------------------------
Parameters  : value         Lower 90%    Upper 90%
kT1 [keV]   : 10.2702        (-5.40698      3.63147)
R1^2/D10^2  : 0.151107        (-0.0890057      0.153961)
kT2 [keV]   : 45.2548        (-42.9893      -47.9576)
R2^2/D10^2  : 8.12317E-04    (-0.000662242   0.0226669)
------------------------------------------------------------
#Fit statistic  : Chi-Squared                   38.90     using 59 bins.
 Reduced chi-squared =
# Null hypothesis probability of 9.51e-01 with 55 degrees of freedom

Energy  Fluence     90% Error
[keV]   [erg/cm2]   [erg/cm2]
15- 25  9.244e-08   5.317e-08
25- 50  2.619e-07   1.485e-07
50-150  5.331e-07   2.764e-07
15-150  8.875e-07   4.254e-07
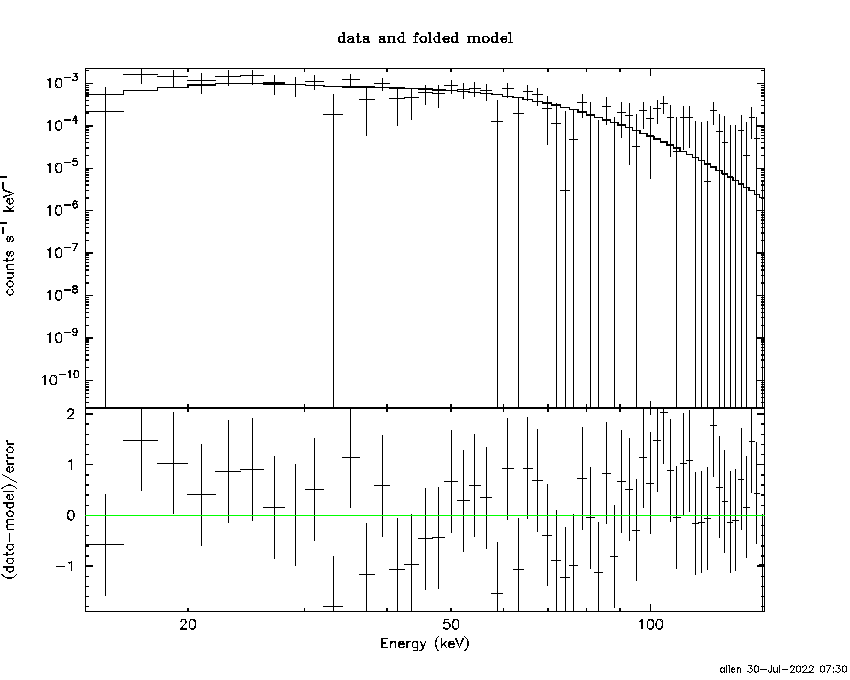
Peak spectrum fit
Power-law model

Time interval is from    0.868 sec. to    1.868 sec.

Spectral model in power-law:
------------------------------------------------------------
Parameters  : value       lower 90%   higher 90%
Photon index: 1.66578     ( -0.342401   0.357869 )
Norm@50keV  : 1.34234E-02    ( -0.00304333   0.0029909 )
------------------------------------------------------------
#Fit statistic  : Chi-Squared                   61.41     using 59 bins.
 Reduced chi-squared = 1.07737
# Null hypothesis probability of 3.21e-01 with 57 degrees of freedom

Photon flux (15-150 keV)    in 1 sec: 1.76207 ( -0.38008  0.38098 ) ph/cm2/s
Energy fluence (15-150 keV)             : 1.24669e-07 ( -2.92093e-08  2.9668e-08 ) ergs/cm2
Cutoff power-law model

Time interval is from    0.868 sec. to    1.868 sec.
Spectral model in the cutoff power-law:
------------------------------------------------------------
Parameters  : value       lower 90%   higher 90%
Photon index: 0.189064     ( -3.2731   1.70598 )
Epeak [keV] : 56.3185      ( -10.9124 -56.0966 )
Norm@50keV  : 8.36988E-02    ( -0.086747   4.73456 )
------------------------------------------------------------
#Fit statistic  : Chi-Squared                   59.55     using 59 bins.
 Reduced chi-squared = 1.06339
# Null hypothesis probability of 3.48e-01 with 56 degrees of freedom

Photon flux (15-150 keV)    in 1 sec: 1.68166 ( -0.40579  0.39888 ) ph/cm2/s
Energy fluence (15-150 keV)             : 8.81008e-08 ( -3.86333e-08  2.33312e-08 ) ergs/cm2
Band function

Time interval is from    0.868 sec. to    1.868 sec.


Spectral model in the Band function:
------------------------------------------------------------
Parameters  : value       lower 90%   higher 90%
alpha       :    (     )
beta        :     (     )
Epeak [keV] :       (   )
Norm@50keV   :     (     )
------------------------------------------------------------

Photon flux (15-150 keV)    in  sec:  (    ) ph/cm2/s
Energy fluence (15-150 keV)             : 0 ( 0  0 ) ergs/cm2
Single BB
Spectral model blackbody:
------------------------------------------------------------
Parameters  : value    Lower 90%  Upper 90%
kT [keV]    : 12.7364  (-2.44918  3.14811)
R^2/D10^2   : 0.370791  (-0.208865   0.439404)
(R is the radius in km and D10 is the distance to the source in units of 10 kpc)
------------------------------------------------------------
#Fit statistic  : Chi-Squared                   60.55     using 59 bins.
 Reduced chi-squared =
# Null hypothesis probability of 3.49e-01 with 57 degrees of freedom

Energy  Fluence     90% Error
[keV]   [erg/cm2]   [erg/cm2]
15- 25  1.276e-08   5.069e-09
25- 50  4.297e-08   1.498e-08
50-150  4.353e-08   2.121e-08
15-150  9.925e-08   3.460e-08
Thermal bremsstrahlung (OTTB)
Spectral model: thermal bremsstrahlung
------------------------------------------------------------
Parameters  : value         Lower 90%    Upper 90%
kT [keV]    : 136.464       (-72.0281      -134.144)
Norm        : 7.41515       (-1.74063     2.48163)
------------------------------------------------------------
#Fit statistic  : Chi-Squared                   60.43     using 59 bins.
 Reduced chi-squared =
# Null hypothesis probability of 3.53e-01 with 57 degrees of freedom

Energy  Fluence     90% Error
[keV]   [erg/cm2]   [erg/cm2]
15- 25  1.918e-08   1.108e-08
25- 50  3.505e-08   1.970e-08
50-150  6.643e-08   4.325e-08
15-150  1.207e-07   7.295e-08
Double BB
Spectral model: bbodyrad<1> + bbodyrad<2>
------------------------------------------------------------
Parameters  : value         Lower 90%    Upper 90%
kT1 [keV]   : 200.000        (-200      -200)
R1^2/D10^2  : 1.10033E-04        (-0.000110036      -0.000110036)
kT2 [keV]   : 11.3176        (-2.05917      3.19046)
R2^2/D10^2  : 0.525266    (-0.309647   0.154931)
------------------------------------------------------------
#Fit statistic  : Chi-Squared                   58.47     using 59 bins.
 Reduced chi-squared =
# Null hypothesis probability of 3.49e-01 with 55 degrees of freedom

Energy  Fluence     90% Error
[keV]   [erg/cm2]   [erg/cm2]
15- 25  1.581e-08   7.820e-09
25- 50  4.029e-08   2.335e-08
50-150  4.694e-08   2.748e-08
15-150  1.030e-07   5.605e-08
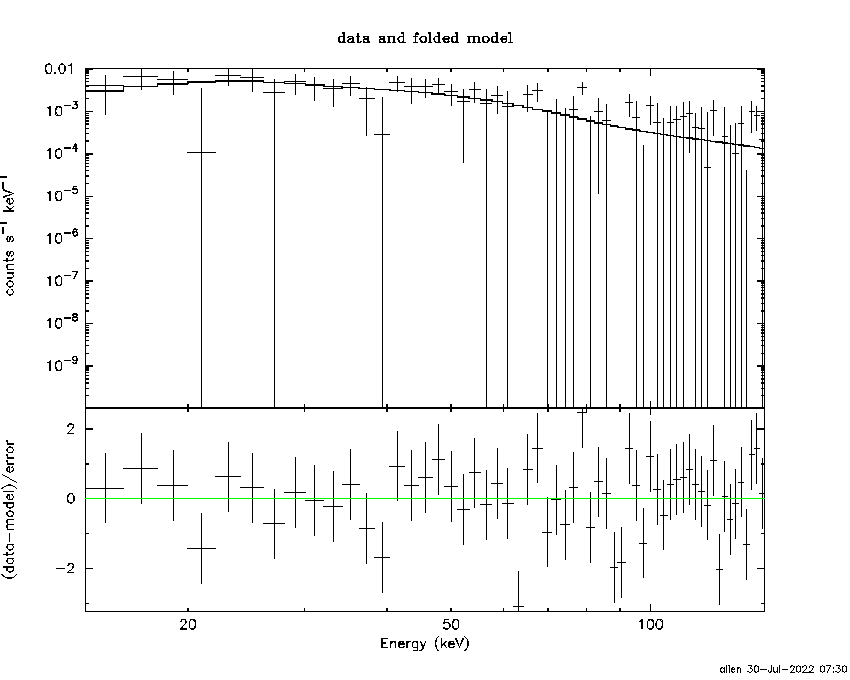
Pre-slew spectrum (Pre-slew PHA with pre-slew DRM)
Power-law model

Spectral model in power-law:
------------------------------------------------------------
Parameters  : value       lower 90%   higher 90%
Photon index: 1.48355     ( -0.246728   0.246246 )
Norm@50keV  : 3.57583E-03    ( -0.000527377   0.000525867 )
------------------------------------------------------------
#Fit statistic  : Chi-Squared                   40.43     using 59 bins.
 Reduced chi-squared =
# Null hypothesis probability of 9.53e-01 with 57 degrees of freedom

Photon flux (15-150 keV)    in 26.64 sec: 0.444460 ( -0.0673749  0.0676175 ) ph/cm2/s
Energy fluence (15-150 keV)             : 9.06165e-07 ( -1.42973e-07  1.44226e-07 ) ergs/cm2
Cutoff power-law model

Spectral model in the cutoff power-law:
------------------------------------------------------------
Parameters  : value       lower 90%   higher 90%
Photon index: 0.921078     ( -1.28661   0.753343 )
Epeak [keV] : 95.9254      ( -38.3604 -95.9263 )
Norm@50keV  : 6.90783E-03    ( -0.00375112   0.0234668 )
------------------------------------------------------------
#Fit statistic  : Chi-Squared                   39.53     using 59 bins.
 Reduced chi-squared =
# Null hypothesis probability of 9.53e-01 with 56 degrees of freedom

Photon flux (15-150 keV)    in 26.64 sec: 0.435361 ( -0.069676  0.069579 ) ph/cm2/s
Energy fluence (15-150 keV)             : 8.73019e-07 ( -1.58766e-07  1.56819e-07 ) ergs/cm2
Band function

Spectral model in the Band function:
------------------------------------------------------------
Parameters  : value       lower 90%   higher 90%
alpha       :    (     )
beta        :     (     )
Epeak [keV] :       (   )
Norm@50keV   :     (     )
------------------------------------------------------------

Photon flux (15-150 keV)    in  sec:  (    ) ph/cm2/s
Energy fluence (15-150 keV)             : 0 ( 0  0 ) ergs/cm2
S(25-50 keV) vs. S(50-100 keV) plot

S(25-50 keV)  = 2.22e-07
S(50-100 keV) = 3.17e-07
T90 vs. Hardness ratio plot
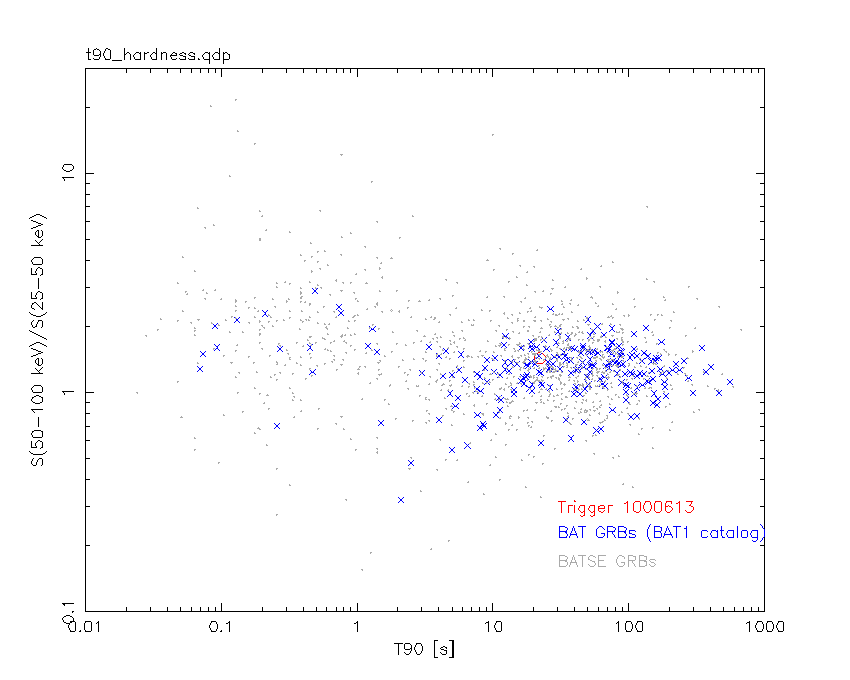
T90                                   = 22.0800000429153 sec.
Hardness ratio (energy fluence ratio) = 1.42793
Color vs. Color plot

Count Ratio  (25-50 keV) / (15-25 keV) = 1.5647
Count Ratio (50-100 keV) / (15-25 keV) = 1.26806
Mask shadow pattern
IMX = -8.849975337905884E-01, IMY = -1.506806050536204E-01
TIME vs. PHA plot around the trigger time

Blue+Cyan dotted lines: Time interval of the scaled map
From 0.000000 to 2.048000
TIME vs. DetID plot around the trigger time

Blue+Cyan dotted lines: Time interval of the scaled map
From 0.000000 to 2.048000
100 us light curve (15-350 keV)

Blue+Cyan dotted lines: Time interval of the scaled map
From 0.000000 to 2.048000
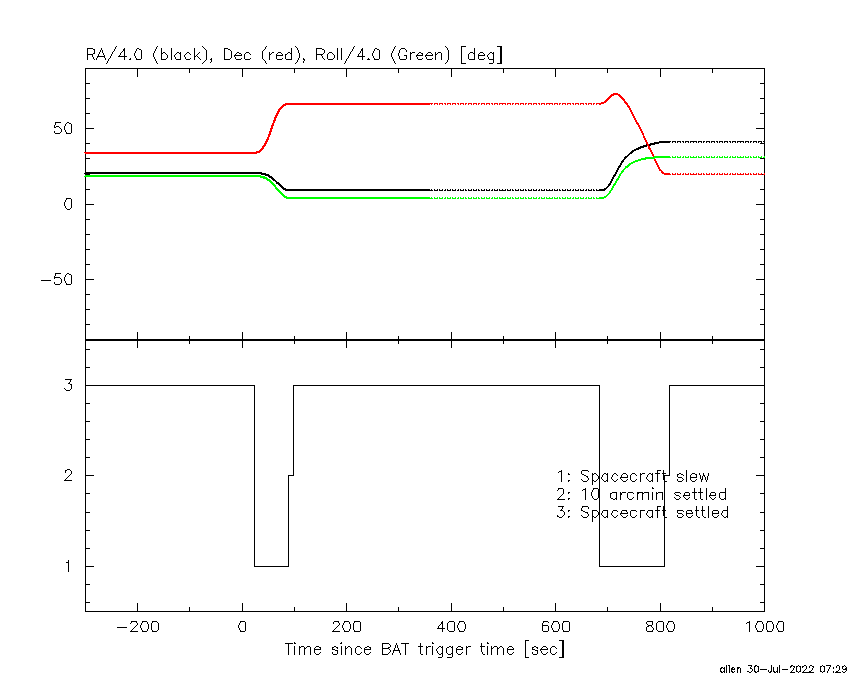
Spacecraft aspect plot
Bright source in the pre-burst/pre-slew/post-slew images
Pre-burst image of 15-350 keV band
Time interval of the image:
-239.088000 -2.768000

# RAcent  DECcent POSerr Theta    Phi  PeakCts   SNR AngSep     Name
#  [deg]    [deg]    ['] [deg]  [deg]                   [']
 83.6425  22.0059    0.4  12.2   10.6   9.0684  28.4    0.7	Crab
 53.0540   3.8135    2.4  40.9   64.1   5.6578   4.8 ------	UNKNOWN
 76.3976  -9.6393    3.3  44.2   24.2   1.9405   3.5 ------	UNKNOWN
 75.3891  11.6581    2.2  23.5   33.3   1.8169   5.3 ------	UNKNOWN
103.0833  -9.6081    2.6  48.0  -12.3   2.6481   4.5 ------	UNKNOWN
132.9999  36.0478    3.0  40.9  -92.0   5.5266   3.9 ------	UNKNOWN
146.2888  61.3334    2.7  48.0 -129.1   5.7371   4.2 ------	UNKNOWN
Pre-slew background subtracted image of 15-350 keV band
Time interval of the image:
-2.768000 23.872000

# RAcent  DECcent POSerr Theta    Phi  PeakCts   SNR AngSep     Name
#  [deg]    [deg]    ['] [deg]  [deg]                   [']
 83.8285  21.9071    0.0  12.4    9.8  -0.1553  -2.1   12.6	Crab
 36.6020  66.6707    1.2  41.9  170.3   1.2996   9.4 ------	UNKNOWN
135.2232  42.7403    2.3  41.5 -102.5   1.4355   5.1 ------	UNKNOWN
Post-slew image of 15-350 keV band
Time interval of the image:
87.812590 683.512610

# RAcent  DECcent POSerr Theta    Phi  PeakCts   SNR AngSep     Name
#  [deg]    [deg]    ['] [deg]  [deg]                   [']
 83.6119  21.9961    1.4  53.5   16.5  20.0587   8.1    1.6	Crab
308.1847  40.9475    6.8  52.4 -178.4  -3.8866  -1.7    3.4	Cyg X-3
325.9663  38.3318   74.7  47.8  164.4  -0.3052  -0.2    9.7	Cyg X-2
160.5749  67.6818    3.3  40.0  -76.8   8.2271   3.5 ------	UNKNOWN
Plot creation:
Sat Jul 30 07:30:29 EDT 2022