Estimated redshift from machine learning (Ukwatta et al. 2016) - may take a few minute to calcaulte
Image
Pre-slew 15.0-350.0 keV image (Event data)
# RAcent DECcent POSerr Theta Phi Peak Cts SNR Name
261.2396 31.4280 0.0076 26.2682 1.4715 1.9500141 25.349 TRIG_01000926
Foreground time interval of the image:
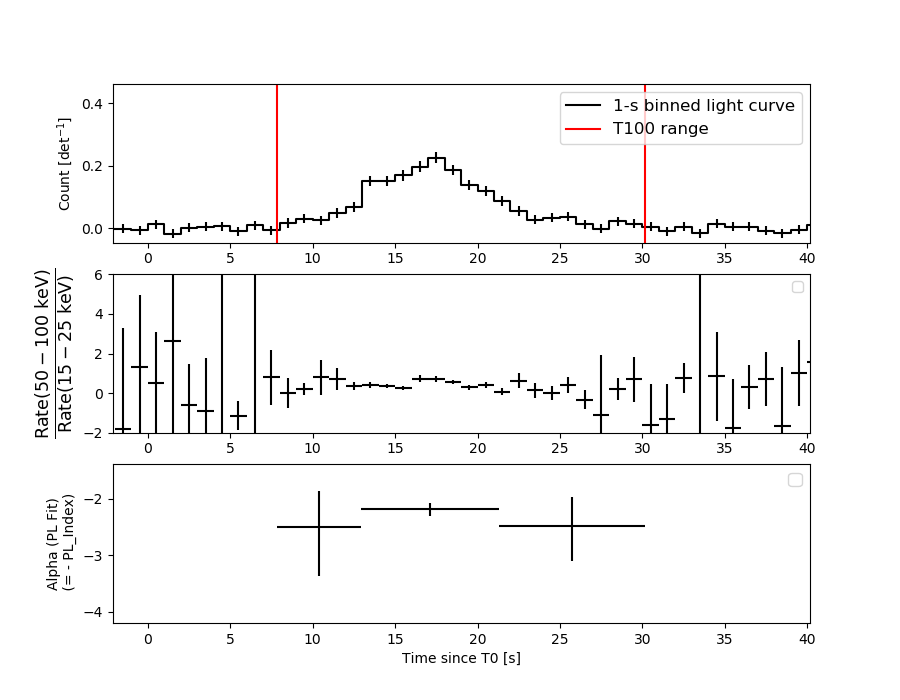
7.856 30.172 (delta_t = 22.316 [sec])
Background time interval of the image:
-239.000 7.856 (delta_t = 246.856 [sec])
Lightcurves
Notes:
- 1) The mask-weighted light curves are using the flight position.
- 2) Multiple plots of different time binning/intervals are shown to cover all scenarios of short/long GRBs, rate/image triggers, and real/false positives.
- 3) For all the mask-weighted lightcurves, the y-axis units are counts/sec/det where a det is 0.4 x 0.4 = 0.16 sq cm.
- 4) The verticle lines correspond to following: green dotted lines are T50 interval, black dotted lines are T90 interval, blue solid line(s) is a spacecraft slew start time, and orange solid line(s) is a spacecraft slew end time.
- 5) Time of each bin is in the middle of the bin.
1 s binning
From T0-310 s to T0+310 s

From T100_start - 20 s to T100_end + 30 s

Full time interval
64 ms binning
Full time interval
From T100_start to T100_end
From T0-5 sec to T0+5 sec
16 ms binning
From T100_start-5 s to T100_start+5 s
8 ms binning
From T100_start-3 s to T100_start+3 s
2 ms binning
From T100_start-1 s to T100_start+1 s
SN=5 or 10 sec. binning (whichever binning is satisfied first)

SN=5 or 10 sec. binning (T < 200 sec)
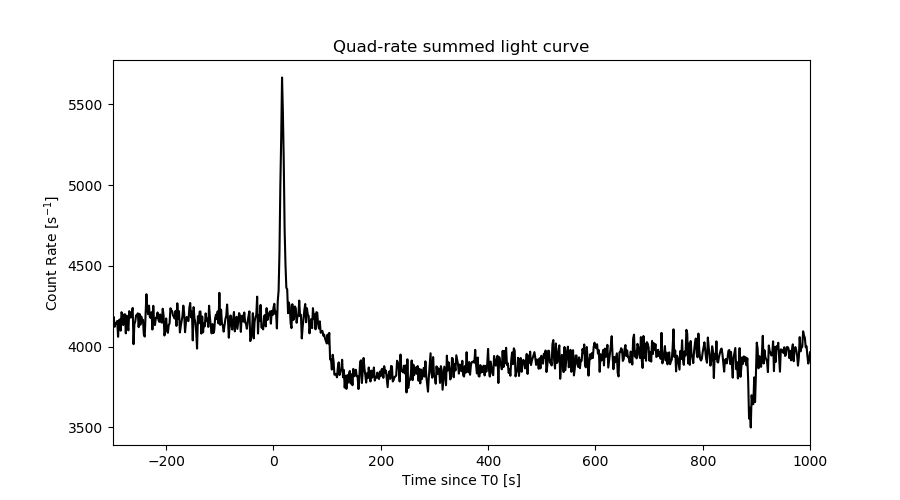
Quad-rate summed light curves (from T0-300s to T0+1000s)
Spectral Evolution
Spectra
Notes:
- 1) The fitting includes the systematic errors.
- 2) When the burst includes telescope slew time periods, the fitting uses an average response file made from multiple 5-s response files through out the slew time plus single time preiod for the non-slew times, and weighted by the total counts in the corresponding time period using addrmf. An average response file is needed becuase a spectral fit using the pre-slew DRM will introduce some errors in both a spectral shape and a normalization if the PHA file contains a lot of the slew/post-slew time interval.
- 3) For fits to more complicated models (e.g. a power-law over a cutoff power-law), the BAT team has decided to require a chi-square improvement of more than 6 for each extra dof.
Time averaged spectrum fit using the average DRM
Power-law model

Time interval is from    7.856 sec. to   30.172 sec.

Spectral model in power-law:
------------------------------------------------------------
Parameters  : value       lower 90%   higher 90%
Photon index: 2.26288     ( -0.137806   0.143187 )
Norm@50keV  : 4.34678E-03    ( -0.000396484   0.000390026 )
------------------------------------------------------------
#Fit statistic  : Chi-Squared                   45.34     using 59 bins.
 Reduced chi-squared = 0.795439
# Null hypothesis probability of 8.67e-01 with 57 degrees of freedom

Photon flux (15-150 keV)    in 22.32 sec: 0.744348 ( -0.051163  0.051245 ) ph/cm2/s
Energy fluence (15-150 keV)             : 9.21285e-07 ( -7.00993e-08  7.0995e-08 ) ergs/cm2
Cutoff power-law model
Time interval is from    7.856 sec. to   30.172 sec.
Spectral model in the cutoff power-law:
------------------------------------------------------------
Parameters  : value       lower 90%   higher 90%
Photon index: 2.25650     ( -0.133409   0.149494 )
Epeak [keV] : 9999.36      (   )
Norm@50keV  : 4.36421E-03    (     )
------------------------------------------------------------
#Fit statistic  : Chi-Squared                   45.35     using 59 bins.
 Reduced chi-squared = 0.809821
# Null hypothesis probability of 8.45e-01 with 56 degrees of freedom

Photon flux (15-150 keV)    in 22.32 sec: 0.743830 ( -0.05078  0.052038 ) ph/cm2/s
Energy fluence (15-150 keV)             : 8.9494e-07 ( -4.0928e-08  7.81298e-08 ) ergs/cm2
Band function

Time interval is from    7.856 sec. to   30.172 sec.


Spectral model in the Band function:
------------------------------------------------------------
Parameters  : value       lower 90%   higher 90%
alpha       :    (     )
beta        :     (     )
Epeak [keV] :       (   )
Norm@50keV   :     (     )
------------------------------------------------------------

Photon flux (15-150 keV)    in  sec:  (    ) ph/cm2/s
Energy fluence (15-150 keV)             : 0 ( 0  0 ) ergs/cm2
Single BB
Spectral model blackbody:
------------------------------------------------------------
Parameters  : value    Lower 90%  Upper 90%
kT [keV]    : 8.44615  (-0.703788  0.779933)
R^2/D10^2   : 0.619196  (-0.187638   0.267579)
(R is the radius in km and D10 is the distance to the source in units of 10 kpc)
------------------------------------------------------------
#Fit statistic  : Chi-Squared                   97.69     using 59 bins.
 Reduced chi-squared =
# Null hypothesis probability of 6.44e-04 with 57 degrees of freedom

Energy  Fluence     90% Error
[keV]   [erg/cm2]   [erg/cm2]
15- 25  1.851e-07   2.101e-08
25- 50  3.551e-07   2.957e-08
50-150  1.111e-07   2.290e-08
15-150  6.513e-07   5.535e-08
Thermal bremsstrahlung (OTTB)
Spectral model: thermal bremsstrahlung
------------------------------------------------------------
Parameters  : value         Lower 90%    Upper 90%
kT [keV]    : 46.3664       (-8.12587      11.0877)
Norm        : 4.28991       (-0.55797     0.68124)
------------------------------------------------------------
#Fit statistic  : Chi-Squared                   49.89     using 59 bins.
 Reduced chi-squared =
# Null hypothesis probability of 7.36e-01 with 57 degrees of freedom

Energy  Fluence     90% Error
[keV]   [erg/cm2]   [erg/cm2]
15- 25  2.298e-07   2.164e-08
25- 50  3.210e-07   2.321e-08
50-150  2.897e-07   5.189e-08
15-150  8.405e-07   6.930e-08
Double BB
Spectral model: bbodyrad<1> + bbodyrad<2>
------------------------------------------------------------
Parameters  : value         Lower 90%    Upper 90%
kT1 [keV]   : 5.57246        (-0.828613      0.865367)
R1^2/D10^2  : 2.70619        (-1.16547      2.46294)
kT2 [keV]   : 20.4567        (-4.46661      7.37164)
R2^2/D10^2  : 1.22143E-02    (-0.0083793   0.0212032)
------------------------------------------------------------
#Fit statistic  : Chi-Squared                   43.43     using 59 bins.
 Reduced chi-squared =
# Null hypothesis probability of 8.70e-01 with 55 degrees of freedom

Energy  Fluence     90% Error
[keV]   [erg/cm2]   [erg/cm2]
15- 25  2.441e-07   5.218e-08
25- 50  2.981e-07   5.767e-08
50-150  3.553e-07   1.820e-07
15-150  8.976e-07   2.515e-07
Peak spectrum fit
Power-law model
Time interval is from   17.172 sec. to   18.172 sec.

Spectral model in power-law:
------------------------------------------------------------
Parameters  : value       lower 90%   higher 90%
Photon index: 1.93738     ( -0.189744   0.199356 )
Norm@50keV  : 1.45147E-02    ( -0.00192357   0.00188545 )
------------------------------------------------------------
#Fit statistic  : Chi-Squared                   47.14     using 59 bins.
 Reduced chi-squared = 0.827018
# Null hypothesis probability of 8.21e-01 with 57 degrees of freedom

Photon flux (15-150 keV)    in 1 sec: 2.11700 ( -0.23739  0.23754 ) ph/cm2/s
Energy fluence (15-150 keV)             : 1.33552e-07 ( -1.70455e-08  1.72718e-08 ) ergs/cm2
Cutoff power-law model

Time interval is from   17.172 sec. to   18.172 sec.
Spectral model in the cutoff power-law:
------------------------------------------------------------
Parameters  : value       lower 90%   higher 90%
Photon index: 1.09870     ( -1.01695   0.827825 )
Epeak [keV] : 46.0839      ( -16.2829 92.8179 )
Norm@50keV  : 4.35937E-02    ( -0.0435942   0.123275 )
------------------------------------------------------------
#Fit statistic  : Chi-Squared                   44.16     using 59 bins.
 Reduced chi-squared = 0.788571
# Null hypothesis probability of 8.74e-01 with 56 degrees of freedom

Photon flux (15-150 keV)    in 1 sec: 2.06561 ( -0.24285  0.24302 ) ph/cm2/s
Energy fluence (15-150 keV)             : 1.24733e-07 ( -1.84142e-08  1.91999e-08 ) ergs/cm2
Band function

Time interval is from   17.172 sec. to   18.172 sec.


Spectral model in the Band function:
------------------------------------------------------------
Parameters  : value       lower 90%   higher 90%
alpha       :    (     )
beta        :     (     )
Epeak [keV] :       (   )
Norm@50keV   :     (     )
------------------------------------------------------------

Photon flux (15-150 keV)    in  sec:  (    ) ph/cm2/s
Energy fluence (15-150 keV)             : 0 ( 0  0 ) ergs/cm2
Single BB
Spectral model blackbody:
------------------------------------------------------------
Parameters  : value    Lower 90%  Upper 90%
kT [keV]    : 10.5378  (-1.31893  1.50917)
R^2/D10^2   : 0.828796  (-0.331941   0.552087)
(R is the radius in km and D10 is the distance to the source in units of 10 kpc)
------------------------------------------------------------
#Fit statistic  : Chi-Squared                   57.69     using 59 bins.
 Reduced chi-squared =
# Null hypothesis probability of 4.50e-01 with 57 degrees of freedom

Energy  Fluence     90% Error
[keV]   [erg/cm2]   [erg/cm2]
15- 25  1.904e-08   3.880e-09
25- 50  5.089e-08   7.610e-09
50-150  3.085e-08   8.740e-09
15-150  1.008e-07   1.466e-08
Thermal bremsstrahlung (OTTB)
Spectral model: thermal bremsstrahlung
------------------------------------------------------------
Parameters  : value         Lower 90%    Upper 90%
kT [keV]    : 73.7068       (-21.0021      35.6002)
Norm        : 10.3138       (-1.67058     2.03307)
------------------------------------------------------------
#Fit statistic  : Chi-Squared                   44.28     using 59 bins.
 Reduced chi-squared =
# Null hypothesis probability of 8.91e-01 with 57 degrees of freedom

Energy  Fluence     90% Error
[keV]   [erg/cm2]   [erg/cm2]
15- 25  2.660e-08   4.085e-09
25- 50  4.289e-08   5.230e-09
50-150  5.721e-08   1.995e-08
15-150  1.267e-07   2.225e-08
Double BB
Spectral model: bbodyrad<1> + bbodyrad<2>
------------------------------------------------------------
Parameters  : value         Lower 90%    Upper 90%
kT1 [keV]   : 5.91849        (-1.76385      2.31319)
R1^2/D10^2  : 4.66493        (-2.99542      12.1658)
kT2 [keV]   : 17.7834        (-4.5492      13.9151)
R2^2/D10^2  : 7.80966E-02    (-0.0707337   0.121052)
------------------------------------------------------------
#Fit statistic  : Chi-Squared                   43.36     using 59 bins.
 Reduced chi-squared =
# Null hypothesis probability of 8.72e-01 with 55 degrees of freedom

Energy  Fluence     90% Error
[keV]   [erg/cm2]   [erg/cm2]
15- 25  2.625e-08   1.417e-08
25- 50  4.335e-08   2.198e-08
50-150  5.384e-08   3.033e-08
15-150  1.234e-07   6.076e-08
Pre-slew spectrum (Pre-slew PHA with pre-slew DRM)
Power-law model

Spectral model in power-law:
------------------------------------------------------------
Parameters  : value       lower 90%   higher 90%
Photon index: 2.26288     ( -0.137806   0.143187 )
Norm@50keV  : 4.34678E-03    ( -0.000396484   0.000390026 )
------------------------------------------------------------
#Fit statistic  : Chi-Squared                   45.34     using 59 bins.
 Reduced chi-squared =
# Null hypothesis probability of 8.67e-01 with 57 degrees of freedom

Photon flux (15-150 keV)    in 22.32 sec: 0.744268 ( -0.0511538  0.0512367 ) ph/cm2/s
Energy fluence (15-150 keV)             : 9.21095e-07 ( -7.01511e-08  7.09796e-08 ) ergs/cm2
Cutoff power-law model
Spectral model in the cutoff power-law:
------------------------------------------------------------
Parameters  : value       lower 90%   higher 90%
Photon index: 1.99541     ( -0.464752   0.0031065 )
Epeak [keV] : 0.713309      ( -0.265826 0.827704 )
Norm@50keV  : 6.18857E-03    ( -0.00303485   0.00091974 )
------------------------------------------------------------
#Fit statistic  : Chi-Squared                   45.20     using 59 bins.
 Reduced chi-squared =
# Null hypothesis probability of 8.49e-01 with 56 degrees of freedom

Photon flux (15-150 keV)    in 22.32 sec: 0.738339 ( -0.054474  0.05439 ) ph/cm2/s
Energy fluence (15-150 keV)             : 9.0623e-07 ( -8.50861e-08  8.24545e-08 ) ergs/cm2
Band function
Spectral model in the Band function:
------------------------------------------------------------
Parameters  : value       lower 90%   higher 90%
alpha       :    (     )
beta        :     (     )
Epeak [keV] :       (   )
Norm@50keV   :     (     )
------------------------------------------------------------

Photon flux (15-150 keV)    in  sec:  (    ) ph/cm2/s
Energy fluence (15-150 keV)             : 0 ( 0  0 ) ergs/cm2
S(25-50 keV) vs. S(50-100 keV) plot

S(25-50 keV)  = 2.95e-07
S(50-100 keV) = 2.46e-07
T90 vs. Hardness ratio plot

T90                                   = 14.3600000143051 sec.
Hardness ratio (energy fluence ratio) = 0.833898
Color vs. Color plot

Count Ratio  (25-50 keV) / (15-25 keV) = 0.88701
Count Ratio (50-100 keV) / (15-25 keV) = 0.413367
Mask shadow pattern
IMX = 4.933771844710977E-01, IMY = -1.267426044624128E-02
TIME vs. PHA plot around the trigger time
TIME vs. DetID plot around the trigger time

100 us light curve (15-350 keV)

Spacecraft aspect plot
Bright source in the pre-burst/pre-slew/post-slew images
Pre-burst image of 15-350 keV band
Time interval of the image:
-239.000000 7.856000

# RAcent  DECcent POSerr Theta    Phi  PeakCts   SNR AngSep     Name
#  [deg]    [deg]    ['] [deg]  [deg]                   [']
244.9888 -15.6477    0.4  29.1 -127.4  11.6295  29.0    0.7	Sco X-1
254.4901  35.4052    2.6  31.6   -7.7   1.6802   4.5    4.1	Her X-1
255.9339 -37.9878    4.9  44.3 -160.2   1.4817   2.4    9.0	4U 1700-377
256.4909 -36.5678   17.1  42.8 -160.3   0.3819   0.7    9.1	GX 349+2
263.0174 -24.6947    3.3  30.2 -166.7   1.2651   3.5    3.1	GX 1+4
264.7412 -44.3006   13.2  49.7 -170.2  -0.7150  -0.9    9.0	4U 1735-44
268.4916  -1.4160    4.5   7.6  164.0  -0.7631  -2.6    7.7	SW J1753.5-0127
270.3096 -25.0775    5.9  30.9 -179.6   0.8350   2.0    1.4	GX 5-1
270.4125 -25.5729    0.0  31.4 -179.6   1.1199   2.6   11.8	GRS 1758-258
274.1126 -14.0573    3.4  21.4  165.1   1.0871   3.4    6.3	GX 17+2
275.9368 -30.3573   42.3  37.2  174.0   0.1446   0.3    0.8	H1820-303
284.9727 -24.7849    6.6  35.8  157.7   0.9792   1.8    8.8	HT1900.1-2455
288.6534  10.9266    6.9  23.8   84.4  -0.8552  -1.7    8.6	GRS 1915+105
299.7536  35.2307    9.3  43.5   51.4   1.6473   1.2    8.2	Cyg X-1
263.0128 -33.8544   18.6  39.3 -167.8   0.2863   0.6    1.7	GX 354-0
300.3235   1.0746    4.7  35.3  105.1   1.7781   2.5 ------	UNKNOWN
271.9198 -38.7183    2.9  44.6 -178.1   2.5330   4.0 ------	UNKNOWN
227.8449  -5.1900    3.1  38.9  -96.0   4.1027   3.7 ------	UNKNOWN
Pre-slew background subtracted image of 15-350 keV band
Time interval of the image:
7.856000 30.172000

# RAcent  DECcent POSerr Theta    Phi  PeakCts   SNR AngSep     Name
#  [deg]    [deg]    ['] [deg]  [deg]                   [']
244.9897 -15.7783    6.5  29.2 -127.6  -0.1671  -1.8    8.3	Sco X-1
254.5892  35.4556    5.5  31.6   -7.5   0.1812   2.1    9.4	Her X-1
256.0427 -37.6974    7.9  44.0 -160.2  -0.1860  -1.5    9.2	4U 1700-377
256.5206 -36.2747    4.1  42.5 -160.3  -0.3480  -2.8    9.8	GX 349+2
262.8781 -24.8199    5.1  30.3 -166.4   0.1880   2.3    8.4	GX 1+4
264.7871 -44.4567   15.8  49.9 -170.3   0.1394   0.7    1.9	4U 1735-44
268.4225  -1.5583    4.8   7.7  165.0   0.1602   2.4    7.1	SW J1753.5-0127
270.3430 -25.1421    3.4  31.0 -179.7   0.2917   3.4    4.9	GX 5-1
270.1783 -25.7737    7.6  31.6 -179.2  -0.1288  -1.5    7.0	GRS 1758-258
274.0288 -13.9612   16.9  21.3  165.2  -0.0508  -0.7    4.7	GX 17+2
275.7587 -30.2461    0.0  37.1  174.2   0.2213   2.2   11.3	H1820-303
285.1655 -24.9592    9.5  36.0  157.6   0.1375   1.2    7.4	HT1900.1-2455
288.8258  10.9035   64.6  23.9   84.6  -0.0179  -0.2    3.0	GRS 1915+105
299.6854  35.1572   13.0  43.4   51.5   0.2531   0.9    5.4	Cyg X-1
262.9238 -33.8410  740.4  39.3 -167.7  -0.0015  -0.0    3.3	GX 354-0
261.2396  31.4280    0.5  26.3    1.5   1.9499  25.3 ------	UNKNOWN
257.2076 -22.7391    2.1  29.3 -155.4   0.4328   5.5 ------	UNKNOWN
Post-slew image of 15-350 keV band
Time interval of the image:
125.500590 881.600600

# RAcent  DECcent POSerr Theta    Phi  PeakCts   SNR AngSep     Name
#  [deg]    [deg]    ['] [deg]  [deg]                   [']
254.4219  35.3029    2.1   6.9  -25.1   3.9434   5.5    2.9	Her X-1
263.0022 -24.6015   59.6  56.1 -153.2  -0.7078  -0.2    8.7	GX 1+4
268.4309  -1.4231    6.1  33.6 -164.4  -1.7149  -1.9    4.2	SW J1753.5-0127
270.4114 -25.0722    6.1  57.2 -161.2   6.9401   1.9    6.9	GX 5-1
274.1278 -14.1475   13.4  47.2 -168.5   1.4255   0.9    9.7	GX 17+2
288.9601  10.8542    0.0  32.9  151.3  -3.5188  -3.0   11.0	GRS 1915+105
299.6341  35.0777    5.6  32.1  101.6   2.5032   2.0    7.7	Cyg X-1
308.0183  40.8350   15.1  38.5   91.1   1.9690   0.8    8.2	Cyg X-3
302.6673  54.0923    3.2  37.1   68.7   5.7130   3.6 ------	UNKNOWN
264.8293  61.7577    4.2  30.4   32.1   2.7594   2.7 ------	UNKNOWN
252.5935  62.4135    3.5  31.5   21.1   3.0525   3.3 ------	UNKNOWN
197.3492  64.9079    3.6  50.8   -0.7   4.8729   3.2 ------	UNKNOWN
205.9114  27.3078    4.0  47.9  -51.4   9.8155   2.9 ------	UNKNOWN
Plot creation:
Sat Jul 30 07:29:52 EDT 2022