Special notes of this burst
Image
Pre-slew 15.0-350.0 keV image (Event data)
# RAcent DECcent POSerr Theta Phi Peak Cts SNR Name
155.9621 -5.5065 0.0137 31.2872 -78.5515 0.9828992 14.114 TRIG_01002158
Foreground time interval of the image:
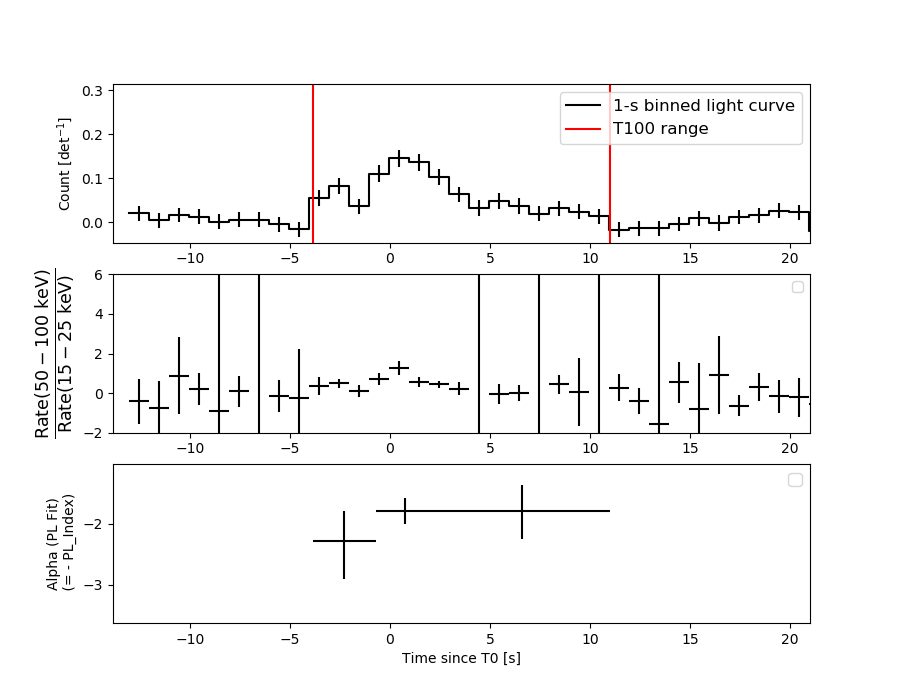
-3.868 10.992 (delta_t = 14.860 [sec])
Background time interval of the image:
-239.048 -3.868 (delta_t = 235.180 [sec])
Lightcurves
Notes:
- 1) The mask-weighted light curves are using the flight position.
- 2) Multiple plots of different time binning/intervals are shown to cover all scenarios of short/long GRBs, rate/image triggers, and real/false positives.
- 3) For all the mask-weighted lightcurves, the y-axis units are counts/sec/det where a det is 0.4 x 0.4 = 0.16 sq cm.
- 4) The verticle lines correspond to following: green dotted lines are T50 interval, black dotted lines are T90 interval, blue solid line(s) is a spacecraft slew start time, and orange solid line(s) is a spacecraft slew end time.
- 5) Time of each bin is in the middle of the bin.
1 s binning
From T0-310 s to T0+310 s
From T100_start - 20 s to T100_end + 30 s
Full time interval
64 ms binning
Full time interval

From T100_start to T100_end
From T0-5 sec to T0+5 sec

16 ms binning
From T100_start-5 s to T100_start+5 s

Blue+Cyan dotted lines: Time interval of the scaled map
From 0.000000 to 1.024000
8 ms binning
From T100_start-3 s to T100_start+3 s

Blue+Cyan dotted lines: Time interval of the scaled map
From 0.000000 to 1.024000
2 ms binning
From T100_start-1 s to T100_start+1 s
Blue+Cyan dotted lines: Time interval of the scaled map
From 0.000000 to 1.024000
SN=5 or 10 sec. binning (whichever binning is satisfied first)
SN=5 or 10 sec. binning (T < 200 sec)

Quad-rate summed light curves (from T0-300s to T0+1000s)

Spectral Evolution
Spectra
Notes:
- 1) The fitting includes the systematic errors.
- 2) When the burst includes telescope slew time periods, the fitting uses an average response file made from multiple 5-s response files through out the slew time plus single time preiod for the non-slew times, and weighted by the total counts in the corresponding time period using addrmf. An average response file is needed becuase a spectral fit using the pre-slew DRM will introduce some errors in both a spectral shape and a normalization if the PHA file contains a lot of the slew/post-slew time interval.
- 3) For fits to more complicated models (e.g. a power-law over a cutoff power-law), the BAT team has decided to require a chi-square improvement of more than 6 for each extra dof.
Time averaged spectrum fit using the average DRM
Power-law model

Time interval is from   -3.868 sec. to   10.992 sec.

Spectral model in power-law:
------------------------------------------------------------
Parameters  : value       lower 90%   higher 90%
Photon index: 1.88060     ( -0.201474   0.212196 )
Norm@50keV  : 3.76237E-03    ( -0.000538809   0.000527974 )
------------------------------------------------------------
#Fit statistic  : Chi-Squared                   52.27     using 59 bins.
 Reduced chi-squared = 0.917018
# Null hypothesis probability of 6.53e-01 with 57 degrees of freedom

Photon flux (15-150 keV)    in 14.86 sec: 0.535578 ( -0.063327  0.063341 ) ph/cm2/s
Energy fluence (15-150 keV)             : 5.14053e-07 ( -7.20163e-08  7.34748e-08 ) ergs/cm2
Cutoff power-law model

Time interval is from   -3.868 sec. to   10.992 sec.
Spectral model in the cutoff power-law:
------------------------------------------------------------
Parameters  : value       lower 90%   higher 90%
Photon index: 0.875125     ( -1.09706   0.879934 )
Epeak [keV] : 46.6420      ( -10.9493 40.2193 )
Norm@50keV  : 1.44019E-02    ( -0.0144015   0.048909 )
------------------------------------------------------------
#Fit statistic  : Chi-Squared                   48.38     using 59 bins.
 Reduced chi-squared = 0.863929
# Null hypothesis probability of 7.56e-01 with 56 degrees of freedom

Photon flux (15-150 keV)    in 14.86 sec: 0.520307 ( -0.064386  0.064556 ) ph/cm2/s
Energy fluence (15-150 keV)             : 4.68207e-07 ( -7.59521e-08  8.18003e-08 ) ergs/cm2
Band function

Time interval is from   -3.868 sec. to   10.992 sec.


Spectral model in the Band function:
------------------------------------------------------------
Parameters  : value       lower 90%   higher 90%
alpha       :    (     )
beta        :     (     )
Epeak [keV] :       (   )
Norm@50keV   :     (     )
------------------------------------------------------------

Photon flux (15-150 keV)    in  sec:  (    ) ph/cm2/s
Energy fluence (15-150 keV)             : 0 ( 0  0 ) ergs/cm2
Single BB

Spectral model blackbody:
------------------------------------------------------------
Parameters  : value    Lower 90%  Upper 90%
kT [keV]    : 10.4783  (-1.41151  1.62878)
R^2/D10^2   : 0.216863  (-0.0910626   0.157003)
(R is the radius in km and D10 is the distance to the source in units of 10 kpc)
------------------------------------------------------------
#Fit statistic  : Chi-Squared                   58.78     using 59 bins.
 Reduced chi-squared =
# Null hypothesis probability of 4.10e-01 with 57 degrees of freedom

Energy  Fluence     90% Error
[keV]   [erg/cm2]   [erg/cm2]
15- 25  7.309e-08   1.557e-08
25- 50  1.939e-07   2.757e-08
50-150  1.157e-07   3.348e-08
15-150  3.826e-07   6.174e-08
Thermal bremsstrahlung (OTTB)
Spectral model: thermal bremsstrahlung
------------------------------------------------------------
Parameters  : value         Lower 90%    Upper 90%
kT [keV]    : 77.7175       (-24.1785      44.3971)
Norm        : 2.56981       (-0.41759     0.520944)
------------------------------------------------------------
#Fit statistic  : Chi-Squared                   48.92     using 59 bins.
 Reduced chi-squared =
# Null hypothesis probability of 7.68e-01 with 57 degrees of freedom

Energy  Fluence     90% Error
[keV]   [erg/cm2]   [erg/cm2]
15- 25  9.889e-08   1.637e-08
25- 50  1.616e-07   2.020e-08
50-150  2.237e-07   1.124e-07
15-150  4.843e-07   1.055e-07
Double BB

Spectral model: bbodyrad<1> + bbodyrad<2>
------------------------------------------------------------
Parameters  : value         Lower 90%    Upper 90%
kT1 [keV]   : 6.02353        (-1.80461      2.27144)
R1^2/D10^2  : 1.08890        (-0.70305      2.77801)
kT2 [keV]   : 17.8836        (-4.81884      12.8337)
R2^2/D10^2  : 1.96179E-02    (-0.0177571   0.0576607)
------------------------------------------------------------
#Fit statistic  : Chi-Squared                   46.86     using 59 bins.
 Reduced chi-squared =
# Null hypothesis probability of 7.75e-01 with 55 degrees of freedom

Energy  Fluence     90% Error
[keV]   [erg/cm2]   [erg/cm2]
15- 25  9.715e-08   5.399e-08
25- 50  1.650e-07   8.611e-08
50-150  2.069e-07   1.233e-07
15-150  4.690e-07   2.431e-07
Peak spectrum fit
Power-law model

Time interval is from   -0.288 sec. to    0.712 sec.

Spectral model in power-law:
------------------------------------------------------------
Parameters  : value       lower 90%   higher 90%
Photon index: 1.48055     ( -0.294523   0.303568 )
Norm@50keV  : 1.15405E-02    ( -0.00210845   0.00208531 )
------------------------------------------------------------
#Fit statistic  : Chi-Squared                   59.81     using 59 bins.
 Reduced chi-squared = 1.0493
# Null hypothesis probability of 3.74e-01 with 57 degrees of freedom

Photon flux (15-150 keV)    in 1 sec: 1.43334 ( -0.25591  0.25621 ) ph/cm2/s
Energy fluence (15-150 keV)             : 1.09853e-07 ( -2.1811e-08  2.20547e-08 ) ergs/cm2
Cutoff power-law model

Time interval is from   -0.288 sec. to    0.712 sec.
Spectral model in the cutoff power-law:
------------------------------------------------------------
Parameters  : value       lower 90%   higher 90%
Photon index: 0.952932     ( -1.51932   0.794484 )
Epeak [keV] : 104.352      ( -45.7668 -104.348 )
Norm@50keV  : 2.09376E-02    ( -0.0112409   0.0836721 )
------------------------------------------------------------
#Fit statistic  : Chi-Squared                   59.23     using 59 bins.
 Reduced chi-squared = 1.05768
# Null hypothesis probability of 3.58e-01 with 56 degrees of freedom

Photon flux (15-150 keV)    in 1 sec: 1.40893 ( -0.26533  0.26268 ) ph/cm2/s
Energy fluence (15-150 keV)             : 1.07387e-07 ( -2.25471e-08  2.27887e-08 ) ergs/cm2
Band function

Time interval is from   -0.288 sec. to    0.712 sec.


Spectral model in the Band function:
------------------------------------------------------------
Parameters  : value       lower 90%   higher 90%
alpha       :    (     )
beta        :     (     )
Epeak [keV] :       (   )
Norm@50keV   :     (     )
------------------------------------------------------------

Photon flux (15-150 keV)    in  sec:  (    ) ph/cm2/s
Energy fluence (15-150 keV)             : 0 ( 0  0 ) ergs/cm2
Single BB

Spectral model blackbody:
------------------------------------------------------------
Parameters  : value    Lower 90%  Upper 90%
kT [keV]    : 16.7322  (-3.0857  3.86051)
R^2/D10^2   : 0.116261  (-0.0599143   0.118311)
(R is the radius in km and D10 is the distance to the source in units of 10 kpc)
------------------------------------------------------------
#Fit statistic  : Chi-Squared                   64.43     using 59 bins.
 Reduced chi-squared =
# Null hypothesis probability of 2.33e-01 with 57 degrees of freedom

Energy  Fluence     90% Error
[keV]   [erg/cm2]   [erg/cm2]
15- 25  6.657e-09   2.599e-09
25- 50  2.908e-08   8.230e-09
50-150  5.783e-08   2.230e-08
15-150  9.357e-08   2.768e-08
Thermal bremsstrahlung (OTTB)
Spectral model: thermal bremsstrahlung
------------------------------------------------------------
Parameters  : value         Lower 90%    Upper 90%
kT [keV]    : 199.362       (-94.3843      -199.363)
Norm        : 5.90550       (-1.03651     1.03778)
------------------------------------------------------------
#Fit statistic  : Chi-Squared                   59.62     using 59 bins.
 Reduced chi-squared =
# Null hypothesis probability of 3.81e-01 with 57 degrees of freedom

Energy  Fluence     90% Error
[keV]   [erg/cm2]   [erg/cm2]
15- 25  1.470e-08   8.535e-09
25- 50  2.829e-08   1.640e-08
50-150  6.204e-08   3.602e-08
15-150  1.050e-07   5.965e-08
Double BB
Spectral model: bbodyrad<1> + bbodyrad<2>
------------------------------------------------------------
Parameters  : value         Lower 90%    Upper 90%
kT1 [keV]   : 3.55810        (-1.41364      2.45587)
R1^2/D10^2  : 20.5837        (-19.1953      423.445)
kT2 [keV]   : 19.9539        (-4.06556      6.08935)
R2^2/D10^2  : 5.77907E-02    (-0.0353901   0.0635581)
------------------------------------------------------------
#Fit statistic  : Chi-Squared                   55.87     using 59 bins.
 Reduced chi-squared =
# Null hypothesis probability of 4.42e-01 with 55 degrees of freedom

Energy  Fluence     90% Error
[keV]   [erg/cm2]   [erg/cm2]
15- 25  1.475e-08   7.904e-09
25- 50  2.471e-08   1.180e-08
50-150  6.517e-08   3.763e-08
15-150  1.046e-07   5.205e-08
Pre-slew spectrum (Pre-slew PHA with pre-slew DRM)
Power-law model

Spectral model in power-law:
------------------------------------------------------------
Parameters  : value       lower 90%   higher 90%
Photon index: 1.88060     ( -0.201474   0.212196 )
Norm@50keV  : 3.76237E-03    ( -0.000538809   0.000527974 )
------------------------------------------------------------
#Fit statistic  : Chi-Squared                   52.27     using 59 bins.
 Reduced chi-squared =
# Null hypothesis probability of 6.53e-01 with 57 degrees of freedom

Photon flux (15-150 keV)    in 14.86 sec: 0.535545 ( -0.0633225  0.0633366 ) ph/cm2/s
Energy fluence (15-150 keV)             : 5.13972e-07 ( -7.19841e-08  7.3495e-08 ) ergs/cm2
Cutoff power-law model

Spectral model in the cutoff power-law:
------------------------------------------------------------
Parameters  : value       lower 90%   higher 90%
Photon index: 0.875146     ( -1.09707   0.879927 )
Epeak [keV] : 46.6422      ( -10.9492 40.2186 )
Norm@50keV  : 1.44014E-02    ( -0.0144014   0.0489091 )
------------------------------------------------------------
#Fit statistic  : Chi-Squared                   48.38     using 59 bins.
 Reduced chi-squared =
# Null hypothesis probability of 7.56e-01 with 56 degrees of freedom

Photon flux (15-150 keV)    in 14.86 sec: 0.520220 ( -0.064367  0.064535 ) ph/cm2/s
Energy fluence (15-150 keV)             : 4.683e-07 ( -7.60371e-08  8.18429e-08 ) ergs/cm2
Band function

Spectral model in the Band function:
------------------------------------------------------------
Parameters  : value       lower 90%   higher 90%
alpha       :    (     )
beta        :     (     )
Epeak [keV] :       (   )
Norm@50keV   :     (     )
------------------------------------------------------------

Photon flux (15-150 keV)    in  sec:  (    ) ph/cm2/s
Energy fluence (15-150 keV)             : 0 ( 0  0 ) ergs/cm2
S(25-50 keV) vs. S(50-100 keV) plot
S(25-50 keV)  = 1.49e-07
S(50-100 keV) = 1.62e-07
T90 vs. Hardness ratio plot

T90                                   = 11.7360000610352 sec.
Hardness ratio (energy fluence ratio) = 1.08725
Color vs. Color plot

Count Ratio  (25-50 keV) / (15-25 keV) = 0.948848
Count Ratio (50-100 keV) / (15-25 keV) = 0.606112
Mask shadow pattern

IMX = 1.206214079209319E-01, IMY = 5.956128925511488E-01
TIME vs. PHA plot around the trigger time
Blue+Cyan dotted lines: Time interval of the scaled map
From 0.000000 to 1.024000
TIME vs. DetID plot around the trigger time
Blue+Cyan dotted lines: Time interval of the scaled map
From 0.000000 to 1.024000
100 us light curve (15-350 keV)
Blue+Cyan dotted lines: Time interval of the scaled map
From 0.000000 to 1.024000
Spacecraft aspect plot

Bright source in the pre-burst/pre-slew/post-slew images
Pre-burst image of 15-350 keV band
Time interval of the image:
-239.048000 -3.868000

# RAcent  DECcent POSerr Theta    Phi  PeakCts   SNR AngSep     Name
#  [deg]    [deg]    ['] [deg]  [deg]                   [']
135.5223 -40.5302    1.9  44.7  -15.3   2.5525   6.3    1.5	Vela X-1
102.5523  -4.8577    3.0  24.7   65.9   1.2455   3.9 ------	UNKNOWN
Pre-slew background subtracted image of 15-350 keV band
Time interval of the image:
-3.868000 10.992000

# RAcent  DECcent POSerr Theta    Phi  PeakCts   SNR AngSep     Name
#  [deg]    [deg]    ['] [deg]  [deg]                   [']
135.4384 -40.7055    4.8  44.9  -15.1   0.1949   2.4    9.9	Vela X-1
155.9621  -5.5065    0.8  31.3  -78.6   0.9830  14.1 ------	UNKNOWN
Post-slew image of 15-350 keV band
Time interval of the image:
67.652590 963.102200

# RAcent  DECcent POSerr Theta    Phi  PeakCts   SNR AngSep     Name
#  [deg]    [deg]    ['] [deg]  [deg]                   [']
135.5255 -40.5760    2.4  39.5   12.9   4.2714   4.8    1.3	Vela X-1
170.5855 -60.5015   11.3  56.1  -20.3  -1.9397  -1.0   10.8	Cen X-3
132.9024 -26.3646    2.2  30.3   32.4   4.3082   5.3 ------	UNKNOWN
142.5132 -19.5923    3.1  19.2   30.0   1.9739   3.7 ------	UNKNOWN
168.9153 -43.6658    2.8  39.8  -26.4   3.1545   4.1 ------	UNKNOWN
196.5978 -12.9627    3.3  40.8  -88.2  10.7412   3.5 ------	UNKNOWN
199.2663  15.9631    3.2  48.0 -129.0   8.6133   3.6 ------	UNKNOWN
197.3998  -6.2002    3.9  41.2  -98.6   6.8873   3.0 ------	UNKNOWN
197.4680  -6.6439    4.6  41.3  -97.9   6.1965   2.7 ------	UNKNOWN
Plot creation:
Sun Nov 13 12:56:24 EST 2022