Estimated redshift from machine learning (Ukwatta et al. 2016) - may take a few minute to calcaulte
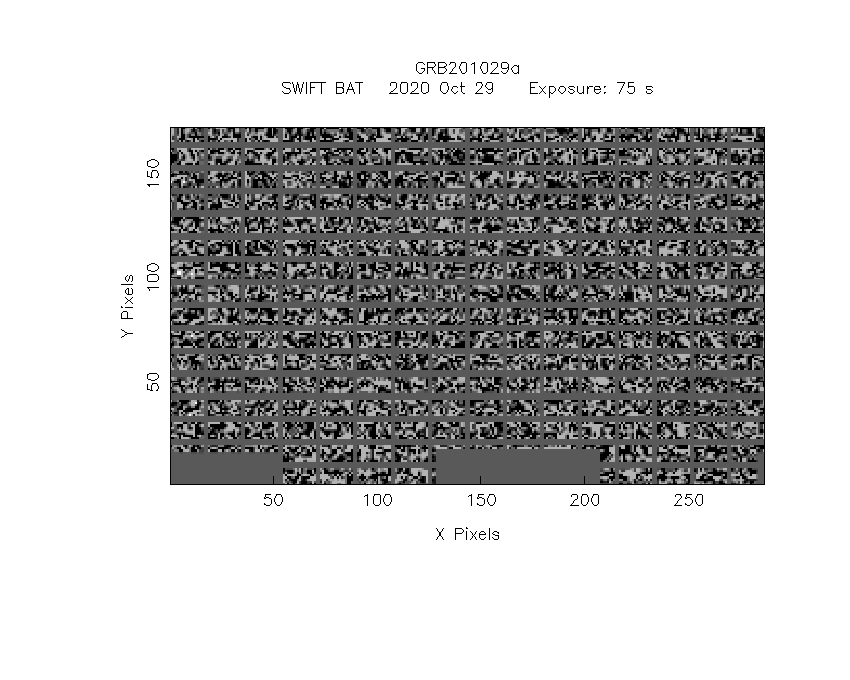
Image
Pre-slew 15.0-350.0 keV image (Event data)

#   RAcent    DECcent   POSerr    Theta     Phi              Peak Cts       SNR   Name
  229.6052    44.4687   0.0162    10.3325   124.7488         2.5193623     11.834 TRIG_01003002

Foreground time interval of the image:
 -2.192  73.101 (delta_t =  75.293 [sec])
Background time interval of the image:
-18.099  -2.192 (delta_t =  15.907 [sec])
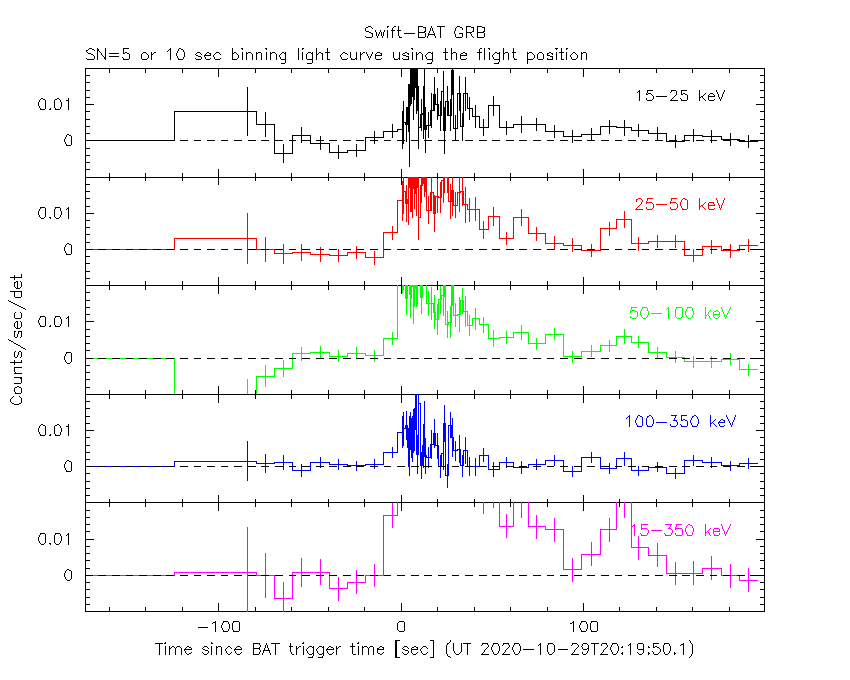
Lightcurves
Notes:
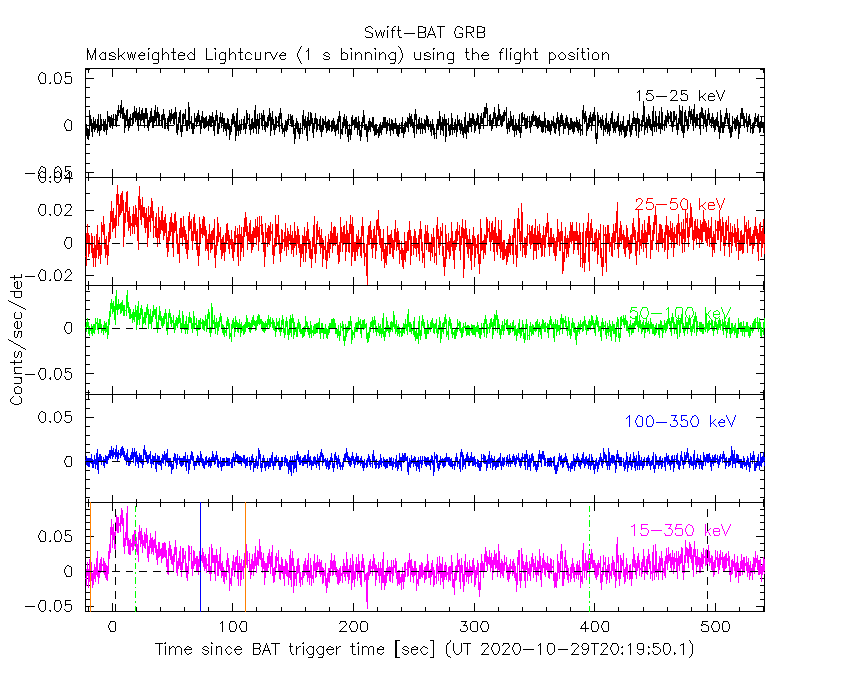
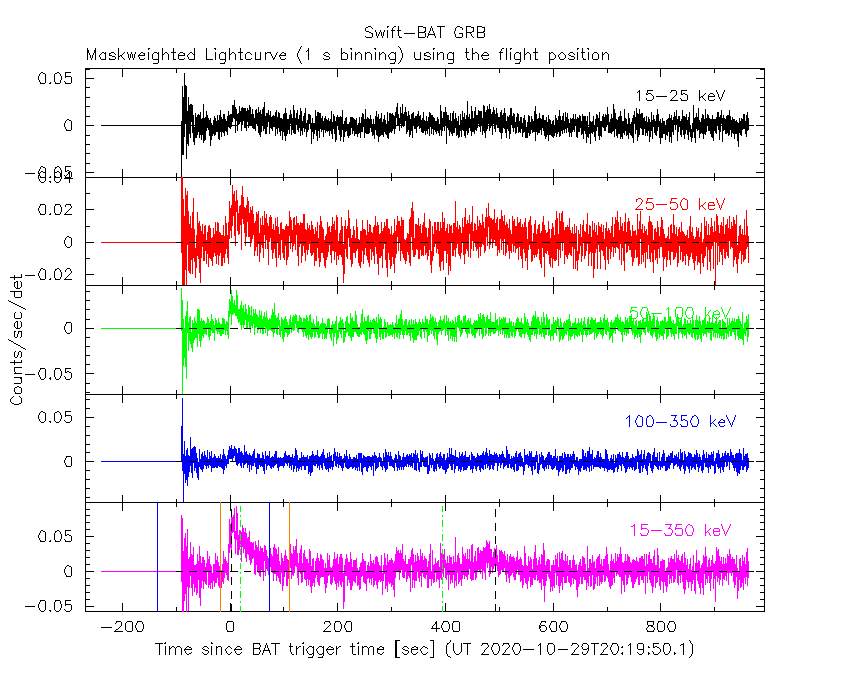
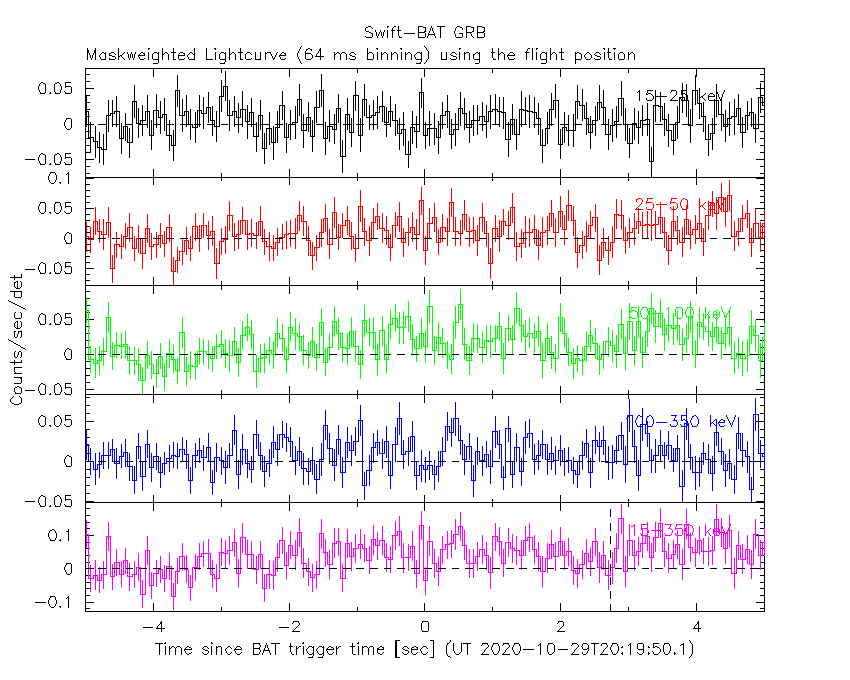
- 1) The mask-weighted light curves are using the flight position.
- 2) Multiple plots of different time binning/intervals are shown to cover all scenarios of short/long GRBs, rate/image triggers, and real/false positives.
- 3) For all the mask-weighted lightcurves, the y-axis units are counts/sec/det where a det is 0.4 x 0.4 = 0.16 sq cm.
- 4) The verticle lines correspond to following: green dotted lines are T50 interval, black dotted lines are T90 interval, blue solid line(s) is a spacecraft slew start time, and orange solid line(s) is a spacecraft slew end time.
- 5) Time of each bin is in the middle of the bin.
1 s binning
From T0-310 s to T0+310 s

From T100_start - 20 s to T100_end + 30 s
Full time interval
64 ms binning
Full time interval

From T100_start to T100_end

From T0-5 sec to T0+5 sec
16 ms binning
From T100_start-5 s to T100_start+5 s

Blue+Cyan dotted lines: Time interval of the scaled map
From 0.000000 to 64.000000
8 ms binning
From T100_start-3 s to T100_start+3 s

Blue+Cyan dotted lines: Time interval of the scaled map
From 0.000000 to 64.000000
2 ms binning
From T100_start-1 s to T100_start+1 s

Blue+Cyan dotted lines: Time interval of the scaled map
From 0.000000 to 64.000000
SN=5 or 10 sec. binning (whichever binning is satisfied first)
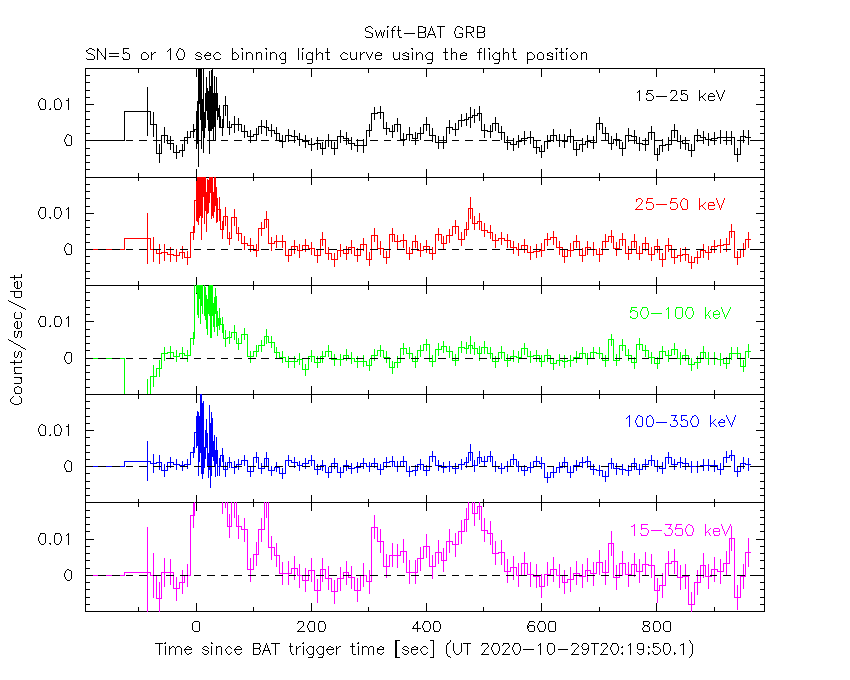
SN=5 or 10 sec. binning (T < 200 sec)
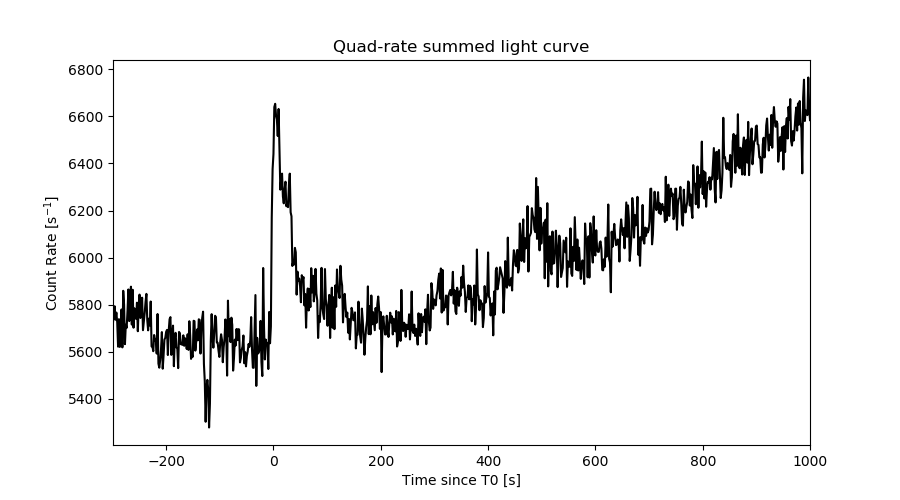
Quad-rate summed light curves (from T0-300s to T0+1000s)
Spectral Evolution
Spectra
Notes:
- 1) The fitting includes the systematic errors.
- 2) When the burst includes telescope slew time periods, the fitting uses an average response file made from multiple 5-s response files through out the slew time plus single time preiod for the non-slew times, and weighted by the total counts in the corresponding time period using addrmf. An average response file is needed becuase a spectral fit using the pre-slew DRM will introduce some errors in both a spectral shape and a normalization if the PHA file contains a lot of the slew/post-slew time interval.
- 3) For fits to more complicated models (e.g. a power-law over a cutoff power-law), the BAT team has decided to require a chi-square improvement of more than 6 for each extra dof.
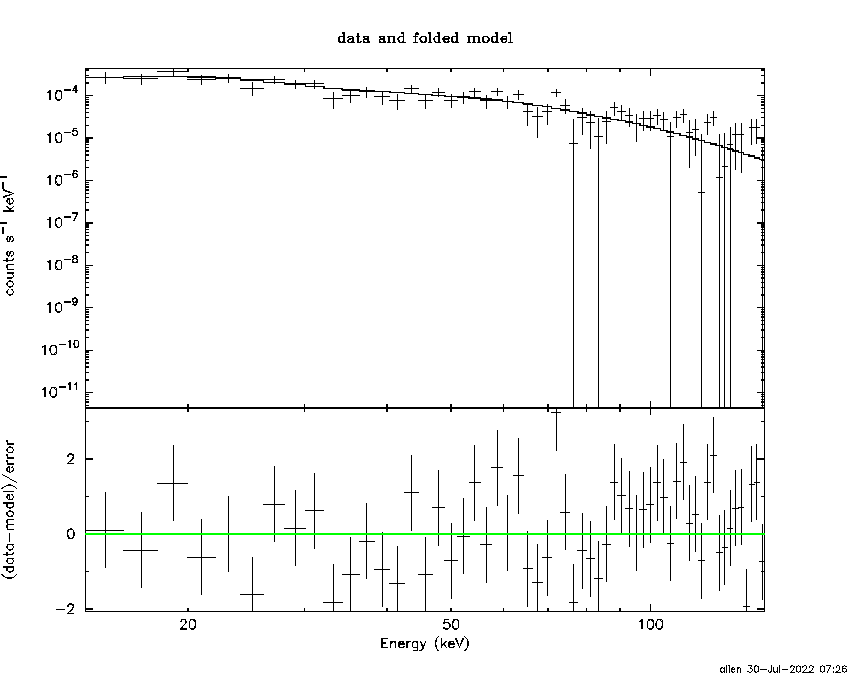
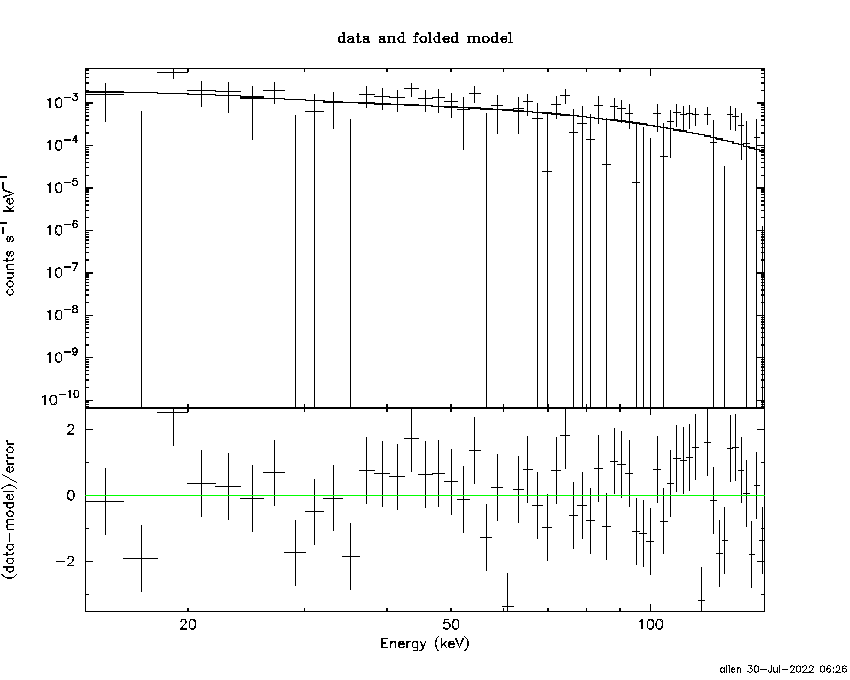
Time averaged spectrum fit using the average DRM
Power-law model

Time interval is from   -2.192 sec. to  510.784 sec.

Spectral model in power-law:
------------------------------------------------------------
Parameters  : value       lower 90%   higher 90%
Photon index: 1.39682     ( -0.14616   0.146333 )
Norm@50keV  : 5.91902E-04    ( -4.65111e-05   4.63494e-05 )
------------------------------------------------------------
#Fit statistic  : Chi-Squared                   66.75     using 59 bins.
 Reduced chi-squared = 1.17105
# Null hypothesis probability of 1.77e-01 with 57 degrees of freedom

Photon flux (15-150 keV)    in 513 sec: 7.20321E-02 ( -0.0056816  0.0056956 ) ph/cm2/s
Energy fluence (15-150 keV)             : 2.93628e-06 ( -2.60271e-07  2.62965e-07 ) ergs/cm2
Cutoff power-law model

Time interval is from   -2.192 sec. to  510.784 sec.
Spectral model in the cutoff power-law:
------------------------------------------------------------
Parameters  : value       lower 90%   higher 90%
Photon index: 1.39852     ( -0.177415   0.142965 )
Epeak [keV] : 9999.29      ( -9999.35 -9999.35 )
Norm@50keV  : 5.93646E-04    ( -0.000593716   0.000215289 )
------------------------------------------------------------
#Fit statistic  : Chi-Squared                   66.77     using 59 bins.
 Reduced chi-squared = 1.19232
# Null hypothesis probability of 1.54e-01 with 56 degrees of freedom

Photon flux (15-150 keV)    in 513 sec: 7.25812E-02 ( -0.0062463  0.0051319 ) ph/cm2/s
Energy fluence (15-150 keV)             : 2.93526e-06 ( -2.60918e-07  2.62803e-07 ) ergs/cm2
Band function

Time interval is from   -2.192 sec. to  510.784 sec.


Spectral model in the Band function:
------------------------------------------------------------
Parameters  : value       lower 90%   higher 90%
alpha       :    (     )
beta        :     (     )
Epeak [keV] :       (   )
Norm@50keV   :     (     )
------------------------------------------------------------

Photon flux (15-150 keV)    in  sec:  (    ) ph/cm2/s
Energy fluence (15-150 keV)             : 0 ( 0  0 ) ergs/cm2
Single BB

Spectral model blackbody:
------------------------------------------------------------
Parameters  : value    Lower 90%  Upper 90%
kT [keV]    : 16.5545  (  )
R^2/D10^2   : 5.70342E-03  (   )
(R is the radius in km and D10 is the distance to the source in units of 10 kpc)
------------------------------------------------------------
#Fit statistic  : Chi-Squared                  121.93     using 59 bins.
 Reduced chi-squared =
# Null hypothesis probability of 1.27e-06 with 57 degrees of freedom

Energy  Fluence     90% Error
[keV]   [erg/cm2]   [erg/cm2]
15- 25  1.645e-07   2.811e-08
25- 50  7.121e-07   8.413e-08
50-150  1.381e-06   2.083e-07
15-150  2.258e-06   2.252e-07
Thermal bremsstrahlung (OTTB)
Spectral model: thermal bremsstrahlung
------------------------------------------------------------
Parameters  : value         Lower 90%    Upper 90%
kT [keV]    : 200.000       (-31.6131      -200)
Norm        : 0.295306       (-0.0228805     0.0228805)
------------------------------------------------------------
#Fit statistic  : Chi-Squared                   72.86     using 59 bins.
 Reduced chi-squared =
# Null hypothesis probability of 7.67e-02 with 57 degrees of freedom

Energy  Fluence     90% Error
[keV]   [erg/cm2]   [erg/cm2]
15- 25  3.772e-07   3.678e-08
25- 50  7.256e-07   2.865e-07
50-150  1.591e-06   6.561e-07
15-150  2.694e-06   7.764e-07
Double BB

Spectral model: bbodyrad<1> + bbodyrad<2>
------------------------------------------------------------
Parameters  : value         Lower 90%    Upper 90%
kT1 [keV]   : 5.95760        (-1.46158      2.05766)
R1^2/D10^2  : 0.135208        (-0.0869215      0.279005)
kT2 [keV]   : 29.0388        (-6.13104      13.2262)
R2^2/D10^2  : 7.64239E-04    (-0.000519166   0.000918533)
------------------------------------------------------------
#Fit statistic  : Chi-Squared                   68.88     using 59 bins.
 Reduced chi-squared =
# Null hypothesis probability of 9.88e-02 with 55 degrees of freedom

Energy  Fluence     90% Error
[keV]   [erg/cm2]   [erg/cm2]
15- 25  3.765e-07   1.454e-07
25- 50  6.389e-07   1.486e-07
50-150  1.964e-06   6.761e-07
15-150  2.979e-06   7.800e-07
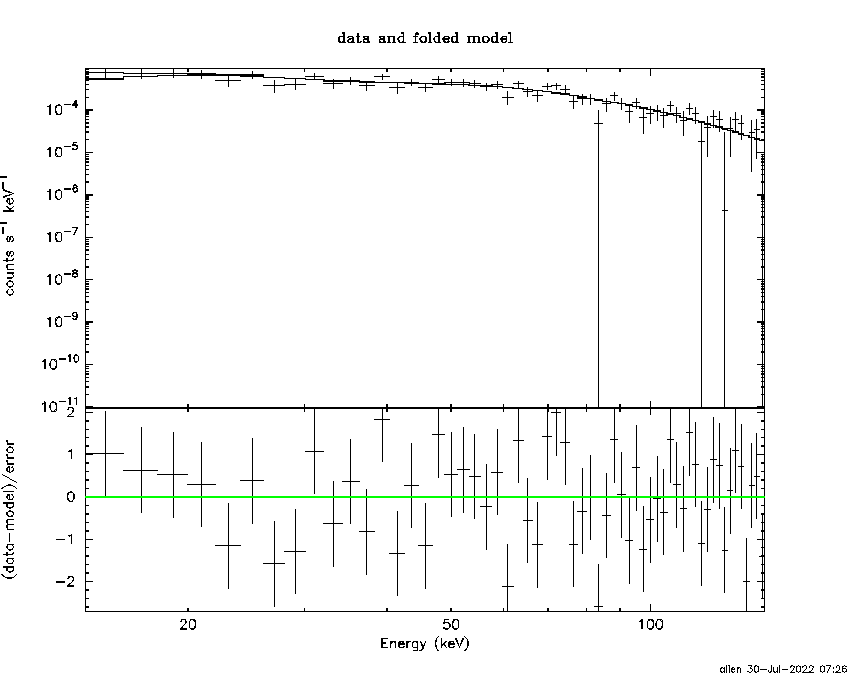
Peak spectrum fit
Power-law model

Time interval is from    7.060 sec. to    8.060 sec.

Spectral model in power-law:
------------------------------------------------------------
Parameters  : value       lower 90%   higher 90%
Photon index: 1.00927     ( -0.405116   0.380391 )
Norm@50keV  : 5.17039E-03    ( -0.00109769   0.00109191 )
------------------------------------------------------------
#Fit statistic  : Chi-Squared                   87.96     using 59 bins.
 Reduced chi-squared = 1.54316
# Null hypothesis probability of 5.29e-03 with 57 degrees of freedom

Photon flux (15-150 keV)    in 1 sec: 0.595563 ( -0.128224  0.128716 ) ph/cm2/s
Energy fluence (15-150 keV)             : 5.57327e-08 ( -1.29577e-08  1.31135e-08 ) ergs/cm2
Cutoff power-law model
Time interval is from    7.060 sec. to    8.060 sec.
Spectral model in the cutoff power-law:
------------------------------------------------------------
Parameters  : value       lower 90%   higher 90%
Photon index: 2.34499     ( -2.66824   6.16859 )
Epeak [keV] : 112.363      (   )
Norm@50keV  : 7.24235E-04    (     )
------------------------------------------------------------
#Fit statistic  : Chi-Squared                   87.82     using 59 bins.
 Reduced chi-squared = 1.56821
# Null hypothesis probability of 4.22e-03 with 56 degrees of freedom

Photon flux (15-150 keV)    in 1 sec: 0.599405 (    ) ph/cm2/s
Energy fluence (15-150 keV)             : 5.58882e-08 ( -1.35824e-08  1.06728e-08 ) ergs/cm2
Band function

Time interval is from    7.060 sec. to    8.060 sec.


Spectral model in the Band function:
------------------------------------------------------------
Parameters  : value       lower 90%   higher 90%
alpha       :    (     )
beta        :     (     )
Epeak [keV] :       (   )
Norm@50keV   :     (     )
------------------------------------------------------------

Photon flux (15-150 keV)    in  sec:  (    ) ph/cm2/s
Energy fluence (15-150 keV)             : 0 ( 0  0 ) ergs/cm2
Single BB

Spectral model blackbody:
------------------------------------------------------------
Parameters  : value    Lower 90%  Upper 90%
kT [keV]    : 22.5964  (-6.50014  10.6291)
R^2/D10^2   : 1.91810E-02  (-0.0130782   0.0366744)
(R is the radius in km and D10 is the distance to the source in units of 10 kpc)
------------------------------------------------------------
#Fit statistic  : Chi-Squared                   93.74     using 59 bins.
 Reduced chi-squared =
# Null hypothesis probability of 1.56e-03 with 57 degrees of freedom

Energy  Fluence     90% Error
[keV]   [erg/cm2]   [erg/cm2]
15- 25  1.790e-09   7.662e-10
25- 50  9.614e-09   4.573e-09
50-150  3.668e-08   1.662e-08
15-150  4.809e-08   1.975e-08
Thermal bremsstrahlung (OTTB)

Spectral model: thermal bremsstrahlung
------------------------------------------------------------
Parameters  : value         Lower 90%    Upper 90%
kT [keV]    : 200.000       (-67.6985      -200)
Norm        : 2.40302       (-0.528183     0.528183)
------------------------------------------------------------
#Fit statistic  : Chi-Squared                   93.57     using 59 bins.
 Reduced chi-squared =
# Null hypothesis probability of 1.62e-03 with 57 degrees of freedom

Energy  Fluence     90% Error
[keV]   [erg/cm2]   [erg/cm2]
15- 25  5.983e-09   3.555e-09
25- 50  1.151e-08   6.930e-09
50-150  2.524e-08   1.520e-08
15-150  4.274e-08   2.511e-08
Double BB

Spectral model: bbodyrad<1> + bbodyrad<2>
------------------------------------------------------------
Parameters  : value         Lower 90%    Upper 90%
kT1 [keV]   : 9.24310        (-6.46311      8.10795)
R1^2/D10^2  : 0.204716        (-0.159951      16.1498)
kT2 [keV]   : 47.6206        (-46.7399      -49.6903)
R2^2/D10^2  : 1.82651E-03    (-0.00157226   0.0174229)
------------------------------------------------------------
#Fit statistic  : Chi-Squared                   87.94     using 59 bins.
 Reduced chi-squared =
# Null hypothesis probability of 3.16e-03 with 55 degrees of freedom

Energy  Fluence     90% Error
[keV]   [erg/cm2]   [erg/cm2]
15- 25  3.920e-09   2.311e-09
25- 50  1.100e-08   6.180e-09
50-150  4.220e-08   2.293e-08
15-150  5.712e-08   2.927e-08
Pre-slew spectrum (Pre-slew PHA with pre-slew DRM)
Power-law model

Spectral model in power-law:
------------------------------------------------------------
Parameters  : value       lower 90%   higher 90%
Photon index: 1.06216     ( -0.101028   0.0997358 )
Norm@50keV  : 2.22942E-03    ( -0.000125982   0.000125818 )
------------------------------------------------------------
#Fit statistic  : Chi-Squared                   72.07     using 59 bins.
 Reduced chi-squared =
# Null hypothesis probability of 8.63e-02 with 57 degrees of freedom

Photon flux (15-150 keV)    in 75.29 sec: 0.257734 ( -0.014993  0.0150207 ) ph/cm2/s
Energy fluence (15-150 keV)             : 1.7767e-06 ( -1.08223e-07  1.08701e-07 ) ergs/cm2
Cutoff power-law model
Spectral model in the cutoff power-law:
------------------------------------------------------------
Parameters  : value       lower 90%   higher 90%
Photon index: 0.446996     ( -0.488991   0.436076 )
Epeak [keV] : 144.885      ( -39.8705 195.804 )
Norm@50keV  : 4.16069E-03    ( -0.0014575   0.00253501 )
------------------------------------------------------------
#Fit statistic  : Chi-Squared                   66.05     using 59 bins.
 Reduced chi-squared =
# Null hypothesis probability of 1.68e-01 with 56 degrees of freedom

Photon flux (15-150 keV)    in 75.29 sec: 0.249714 ( -0.016045  0.016013 ) ph/cm2/s
Energy fluence (15-150 keV)             : 1.71823e-06 ( -1.18499e-07  1.17784e-07 ) ergs/cm2
Band function

Spectral model in the Band function:
------------------------------------------------------------
Parameters  : value       lower 90%   higher 90%
alpha       :    (     )
beta        :     (     )
Epeak [keV] :       (   )
Norm@50keV   :     (     )
------------------------------------------------------------

Photon flux (15-150 keV)    in  sec:  (    ) ph/cm2/s
Energy fluence (15-150 keV)             : 0 ( 0  0 ) ergs/cm2
S(25-50 keV) vs. S(50-100 keV) plot
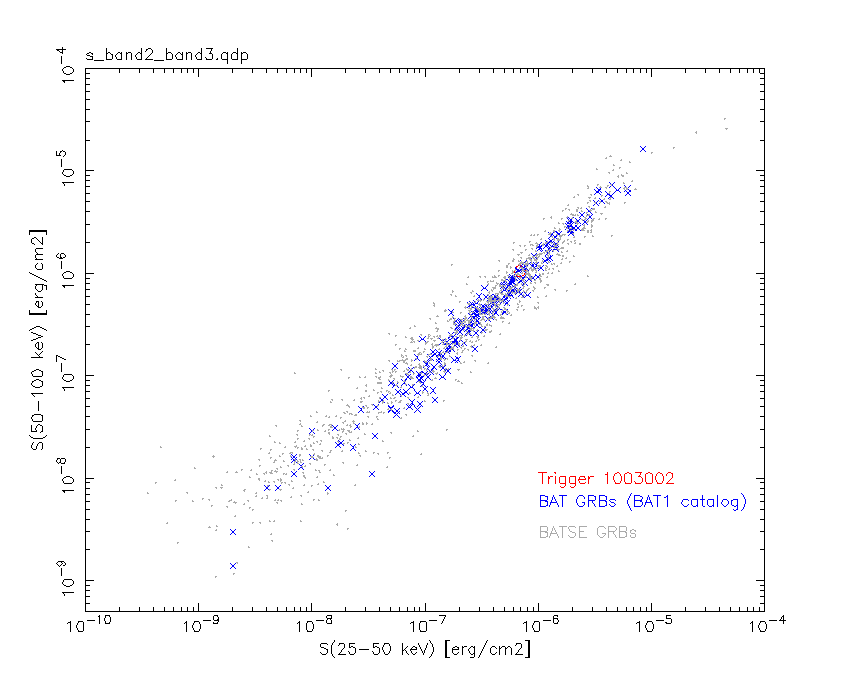
S(25-50 keV)  = 6.87e-07
S(50-100 keV) = 1.05e-06
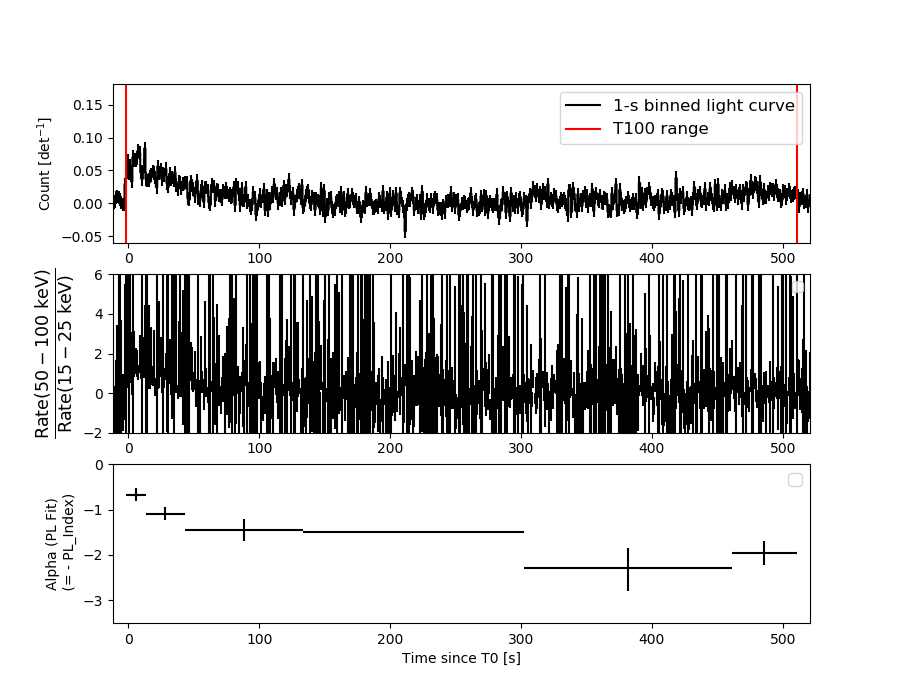
T90 vs. Hardness ratio plot

T90                                   = 491.023999929428 sec.
Hardness ratio (energy fluence ratio) = 1.52838
Color vs. Color plot
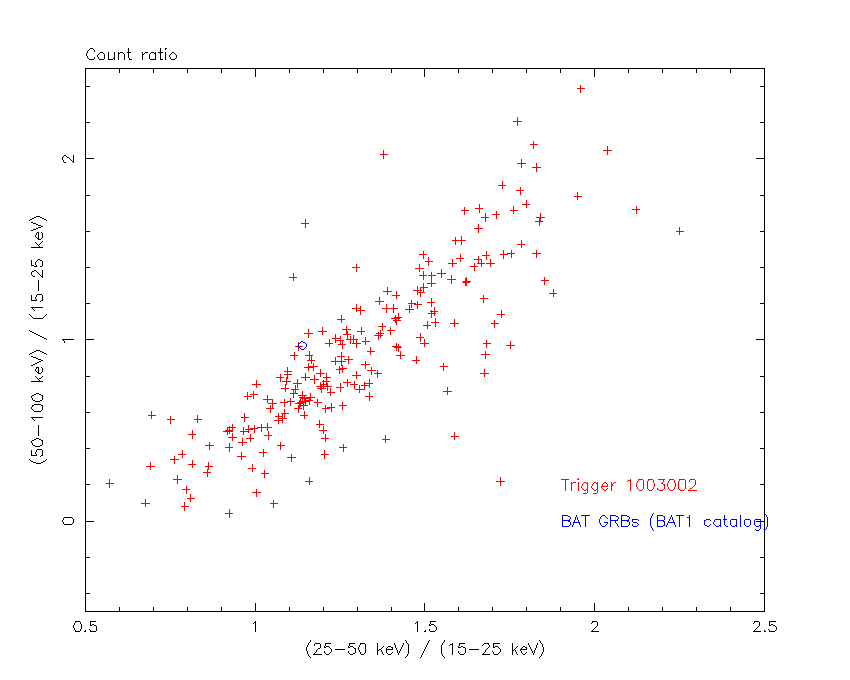
Count Ratio  (25-50 keV) / (15-25 keV) = 1.1389
Count Ratio (50-100 keV) / (15-25 keV) = 0.969635
Mask shadow pattern
IMX = -1.039163475633133E-01, IMY = -1.498015237863478E-01
TIME vs. PHA plot around the trigger time

Blue+Cyan dotted lines: Time interval of the scaled map
From 0.000000 to 64.000000
TIME vs. DetID plot around the trigger time

Blue+Cyan dotted lines: Time interval of the scaled map
From 0.000000 to 64.000000
100 us light curve (15-350 keV)
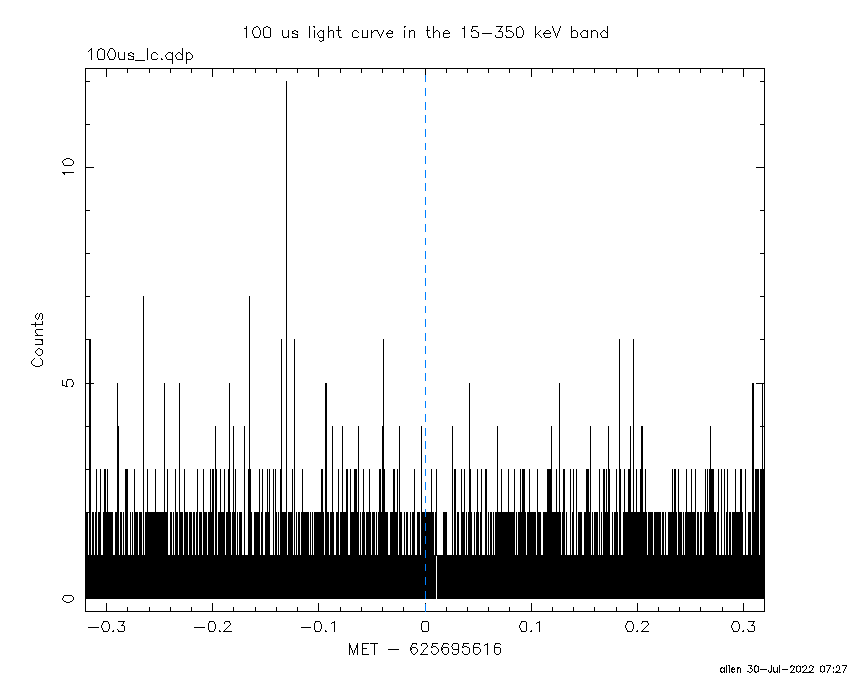
Blue+Cyan dotted lines: Time interval of the scaled map
From 0.000000 to 64.000000
Spacecraft aspect plot

Bright source in the pre-burst/pre-slew/post-slew images
Pre-burst image of 15-350 keV band
Time interval of the image:
-18.099400 -2.192000

# RAcent  DECcent POSerr Theta    Phi  PeakCts   SNR AngSep     Name
#  [deg]    [deg]    ['] [deg]  [deg]                   [']
254.4299  35.4838    4.4  26.3  173.5  -0.1193  -2.6    8.6	Her X-1
270.6549  61.8681    2.2  39.7  125.9   0.5664   5.2 ------	UNKNOWN
283.9282  38.2153    2.1  48.6  159.9   0.6578   5.4 ------	UNKNOWN
272.1114   2.7338    2.1  57.0 -154.1   1.3691   5.4 ------	UNKNOWN
Pre-slew background subtracted image of 15-350 keV band
Time interval of the image:
-2.192000 73.100590

# RAcent  DECcent POSerr Theta    Phi  PeakCts   SNR AngSep     Name
#  [deg]    [deg]    ['] [deg]  [deg]                   [']
254.3849  35.5030   11.3  26.3  173.6   0.2331   1.0   10.3	Her X-1
229.6052  44.4687    1.0  10.3  124.7   2.5185  11.8 ------	UNKNOWN
Post-slew image of 15-350 keV band
Time interval of the image:
110.700600 963.060800

# RAcent  DECcent POSerr Theta    Phi  PeakCts   SNR AngSep     Name
#  [deg]    [deg]    ['] [deg]  [deg]                   [']
254.3886  35.2122    5.3  21.1 -179.3  -1.4241  -2.2    8.5	Her X-1
246.3351  83.8401    3.1  39.7   76.0   9.1562   3.7 ------	UNKNOWN
289.8134  53.4219    3.6  39.3  128.0   5.5007   3.2 ------	UNKNOWN
199.3092  43.7165    3.1  21.6   -8.0   2.4005   3.8 ------	UNKNOWN
154.7637  31.4526    2.6  58.3   -2.1  15.5176   4.5 ------	UNKNOWN
245.9913  -1.2657    2.7  48.0 -129.1  12.2213   4.4 ------	UNKNOWN
Plot creation:
Sat Jul 30 07:27:10 EDT 2022