Special notes of this burst
Image
Pre-slew 15.0-350.0 keV image (Event data)
#   RAcent    DECcent   POSerr    Theta     Phi              Peak Cts       SNR   Name
  291.3007    60.5963   0.0060    15.5920  -110.0462         0.8054657     31.946 TRIG_00100433

Foreground time interval of the image:
 -0.208   6.812 (delta_t =   7.020 [sec])
Background time interval of the image:
-299.920  -0.208 (delta_t = 299.712 [sec])
Lightcurves
Notes:
- 1) The mask-weighted light curves are using the flight position.
- 2) Multiple plots of different time binning/intervals are shown to cover all scenarios of short/long GRBs, rate/image triggers, and real/false positives.
- 3) For all the mask-weighted lightcurves, the y-axis units are counts/sec/det where a det is 0.4 x 0.4 = 0.16 sq cm.
- 4) The verticle lines correspond to following: green dotted lines are T50 interval, black dotted lines are T90 interval, blue solid line(s) is a spacecraft slew start time, and orange solid line(s) is a spacecraft slew end time.
- 5) Time of each bin is in the middle of the bin.
1 s binning
From T0-310 s to T0+310 s
From T100_start - 20 s to T100_end + 30 s
Full time interval
64 ms binning
Full time interval
From T100_start to T100_end
From T0-5 sec to T0+5 sec
16 ms binning
From T100_start-5 s to T100_start+5 s
8 ms binning
From T100_start-3 s to T100_start+3 s
2 ms binning
From T100_start-1 s to T100_start+1 s
SN=5 or 10 sec. binning (whichever binning is satisfied first)
SN=5 or 10 sec. binning (T < 200 sec)
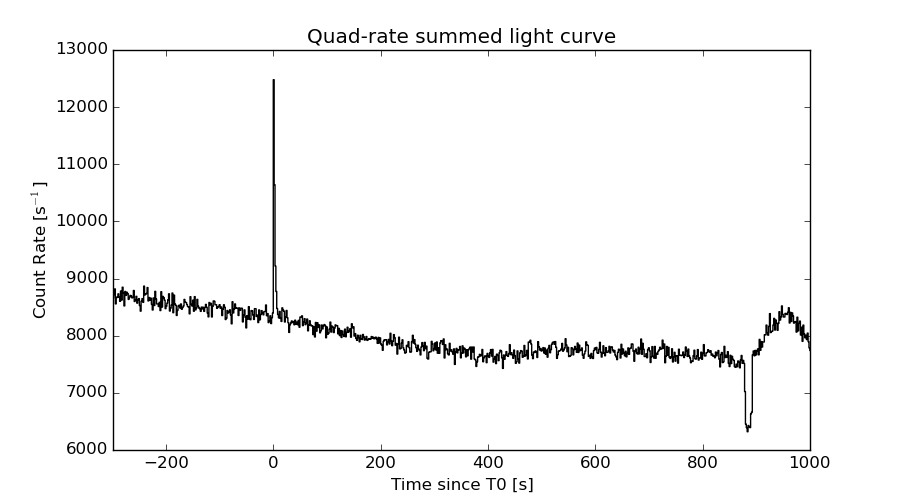
Quad-rate summed light curves (from T0-300s to T0+1000s)
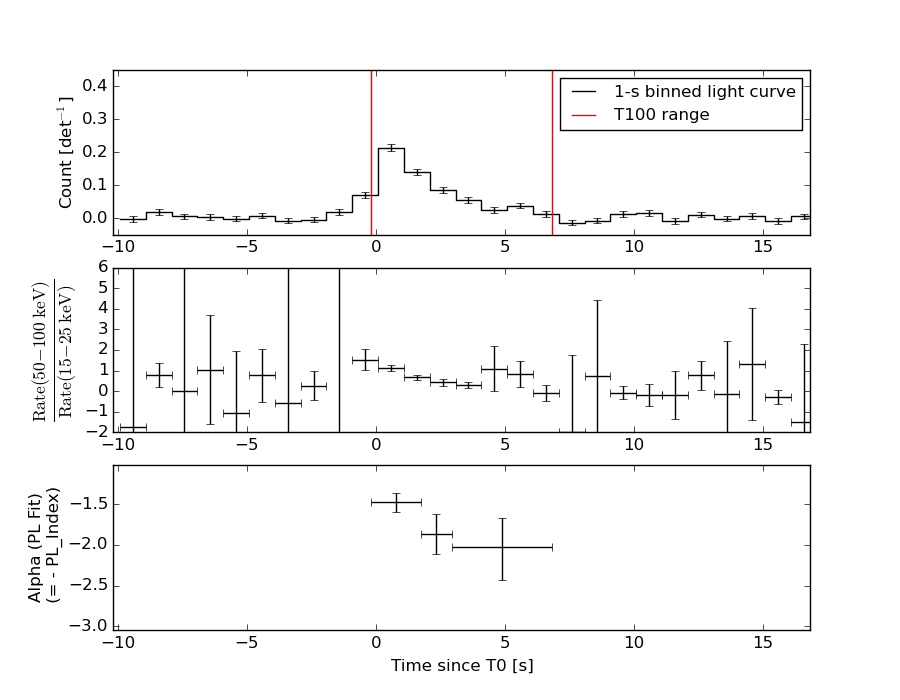
Spectral Evolution
Spectra
Notes:
- 1) The fitting includes the systematic errors.
- 2) When the burst includes telescope slew time periods, the fitting uses an average response file made from multiple 5-s response files through out the slew time plus single time preiod for the non-slew times, and weighted by the total counts in the corresponding time period using addrmf. An average response file is needed becuase a spectral fit using the pre-slew DRM will introduce some errors in both a spectral shape and a normalization if the PHA file contains a lot of the slew/post-slew time interval.
- 3) For fits to more complicated models (e.g. a power-law over a cutoff power-law), the BAT team has decided to require a chi-square improvement of more than 6 for each extra dof.
Time averaged spectrum fit using the average DRM
Power-law model

Time interval is from   -0.208 sec. to    6.812 sec.

Spectral model in power-law:
------------------------------------------------------------
Parameters  : value       lower 90%   higher 90%
Photon index: 1.67176     ( -0.120246   0.122322 )
Norm@50keV  : 5.62057E-03    ( -0.000396291   0.00039264 )
------------------------------------------------------------
#Fit statistic : Chi-Squared =          30.46 using 59 PHA bins.
# Reduced chi-squared =         0.5344 for     57 degrees of freedom
# Null hypothesis probability =   9.984831e-01

Photon flux (15-150 keV)    in 7.02 sec: 0.739262 ( -0.0486816  0.0487563 ) ph/cm2/s
Energy fluence (15-150 keV)             : 3.66197e-07 ( -2.73906e-08  2.76455e-08 ) ergs/cm2
Cutoff power-law model

Time interval is from   -0.208 sec. to    6.812 sec.
Spectral model in the cutoff power-law:
------------------------------------------------------------
Parameters  : value       lower 90%   higher 90%
Photon index: 1.52502     ( -0.503809   0.255147 )
Epeak [keV] : 153.960      (   )
Norm@50keV  : 6.71072E-03    (     )
------------------------------------------------------------
#Fit statistic : Chi-Squared =          30.18 using 59 PHA bins.
# Reduced chi-squared =         0.5388 for     56 degrees of freedom
# Null hypothesis probability =   9.981395e-01

Photon flux (15-150 keV)    in 7.02 sec: 0.733548 ( -0.051876  0.051577 ) ph/cm2/s
Energy fluence (15-150 keV)             : 3.61368e-07 ( -3.1755e-08  3.10635e-08 ) ergs/cm2
Band function

Time interval is from   -0.208 sec. to    6.812 sec.

Spectral model in the Band function:
------------------------------------------------------------
Parameters  : value       lower 90%   higher 90%
alpha       : -1.32092   ( 1.33217   1.33217 )
beta        : -1.79805    ( 1.79561   0.353678 )
Epeak [keV] : 80.3995      ( -84.425 -84.425 )
Norm@50keV   : 8.87087E-03    ( -0.00318259   0 )
------------------------------------------------------------
#Fit statistic : Chi-Squared =          29.94 using 59 PHA bins.
# Reduced chi-squared =         0.5444 for     55 degrees of freedom
# Null hypothesis probability =   9.976678e-01

Photon flux (15-150 keV)    in 7.02 sec:  (    ) ph/cm2/s
Energy fluence (15-150 keV)             : 0 ( 0  0 ) ergs/cm2
Single BB
Spectral model blackbody:
------------------------------------------------------------
Parameters  : value    Lower 90%  Upper 90%
kT [keV]    : 12.9369  (-1.06174  1.1729)
R^2/D10^2   : 0.134365  (-0.036209   0.0490234)
(R is the radius in km and D10 is the distance to the source in units of 10 kpc)
------------------------------------------------------------
#Fit statistic : Chi-Squared =          84.18 using 59 PHA bins.
# Reduced chi-squared =          1.477 for     57 degrees of freedom
# Null hypothesis probability =   1.111174e-02

Energy  Fluence     90% Error
[keV]   [erg/cm2]   [erg/cm2]
15- 25  3.348e-08   3.928e-09
25- 50  1.147e-07   8.705e-09
50-150  1.210e-07   1.836e-08
15-150  2.692e-07   2.211e-08
Thermal bremsstrahlung (OTTB)
Spectral model: thermal bremsstrahlung
------------------------------------------------------------
Parameters  : value         Lower 90%    Upper 90%
kT [keV]    : 146.652       (-40.9496      -145.91)
Norm        : 3.03938       (-0.226837     0.277532)
------------------------------------------------------------
#Fit statistic : Chi-Squared =          30.89 using 59 PHA bins.
# Reduced chi-squared =         0.5419 for     57 degrees of freedom
# Null hypothesis probability =   9.981521e-01

Energy  Fluence     90% Error
[keV]   [erg/cm2]   [erg/cm2]
15- 25  5.490e-08   5.012e-09
25- 50  1.014e-07   1.274e-08
50-150  1.983e-07   7.855e-08
15-150  3.547e-07   9.130e-08
Double BB

Spectral model: bbodyrad<1> + bbodyrad<2>
------------------------------------------------------------
Parameters  : value         Lower 90%    Upper 90%
kT1 [keV]   : 6.65151        (-1.92632      2.08072)
R1^2/D10^2  : 0.987251        (-0.561242      2.38465)
kT2 [keV]   : 24.2504        (-6.02869      14.9562)
R2^2/D10^2  : 1.06687E-02    (-0.00846814   0.0215568)
------------------------------------------------------------
#Fit statistic : Chi-Squared =          35.60 using 59 PHA bins.
# Reduced chi-squared =         0.6473 for     55 degrees of freedom
# Null hypothesis probability =   9.803580e-01

Energy  Fluence     90% Error
[keV]   [erg/cm2]   [erg/cm2]
15- 25  5.434e-08   1.477e-08
25- 50  1.011e-07   2.599e-08
50-150  1.979e-07   9.609e-08
15-150  3.533e-07   9.530e-08
Peak spectrum fit
Power-law model
Time interval is from   -0.024 sec. to    0.976 sec.

Spectral model in power-law:
------------------------------------------------------------
Parameters  : value       lower 90%   higher 90%
Photon index: 1.31802     ( -0.139444   0.14013 )
Norm@50keV  : 1.46446E-02    ( -0.00116931   0.00116578 )
------------------------------------------------------------
#Fit statistic : Chi-Squared =          56.74 using 59 PHA bins.
# Reduced chi-squared =         0.9954 for     57 degrees of freedom
# Null hypothesis probability =   4.848490e-01

Photon flux (15-150 keV)    in 1 sec: 1.75307 ( -0.140959  0.141143 ) ph/cm2/s
Energy fluence (15-150 keV)             : 1.4409e-07 ( -1.29706e-08  1.30598e-08 ) ergs/cm2
Cutoff power-law model
Time interval is from   -0.024 sec. to    0.976 sec.
Spectral model in the cutoff power-law:
------------------------------------------------------------
Parameters  : value       lower 90%   higher 90%
Photon index: 1.10697     ( -0.578656   0.283417 )
Epeak [keV] : 227.189      ( -227.096 -227.096 )
Norm@50keV  : 1.84764E-02    ( -0.00483383   0.0156774 )
------------------------------------------------------------
#Fit statistic : Chi-Squared =          56.27 using 59 PHA bins.
# Reduced chi-squared =          1.005 for     56 degrees of freedom
# Null hypothesis probability =   4.646704e-01

Photon flux (15-150 keV)    in 1 sec: 1.73718 ( -0.14662  0.14616 ) ph/cm2/s
Energy fluence (15-150 keV)             : 1.42421e-07 ( -1.3813e-08  1.3717e-08 ) ergs/cm2
Band function

Time interval is from   -0.024 sec. to    0.976 sec.

Spectral model in the Band function:
------------------------------------------------------------
Parameters  : value       lower 90%   higher 90%
alpha       : -1.10886   ( 1.07806   1.07806 )
beta        : -10.0000    ( 10   3.55271e-14 )
Epeak [keV] : 227.884      ( -94.8322 -228.016 )
Norm@50keV   : 1.84520E-02    ( -0.00480811   0.0157062 )
------------------------------------------------------------
#Fit statistic : Chi-Squared =          56.27 using 59 PHA bins.
# Reduced chi-squared =          1.023 for     55 degrees of freedom
# Null hypothesis probability =   4.270607e-01

Photon flux (15-150 keV)    in 1 sec:  (    ) ph/cm2/s
Energy fluence (15-150 keV)             : 0 ( 0  0 ) ergs/cm2
Single BB
Spectral model blackbody:
------------------------------------------------------------
Parameters  : value    Lower 90%  Upper 90%
kT [keV]    : 17.9461  (-1.80403  2.03578)
R^2/D10^2   : 0.112755  (-0.03391   0.047843)
(R is the radius in km and D10 is the distance to the source in units of 10 kpc)
------------------------------------------------------------
#Fit statistic : Chi-Squared =          89.11 using 59 PHA bins.
# Reduced chi-squared =          1.563 for     57 degrees of freedom
# Null hypothesis probability =   4.184915e-03

Energy  Fluence     90% Error
[keV]   [erg/cm2]   [erg/cm2]
15- 25  7.278e-09   1.140e-09
25- 50  3.358e-08   3.625e-09
50-150  7.845e-08   1.272e-08
15-150  1.193e-07   1.175e-08
Thermal bremsstrahlung (OTTB)
Spectral model: thermal bremsstrahlung
------------------------------------------------------------
Parameters  : value         Lower 90%    Upper 90%
kT [keV]    : 200.000       (      )
Norm        : 7.21362       (-0.574389     0.57436)
------------------------------------------------------------
#Fit statistic : Chi-Squared =          64.53 using 59 PHA bins.
# Reduced chi-squared =          1.132 for     57 degrees of freedom
# Null hypothesis probability =   2.301752e-01

Energy  Fluence     90% Error
[keV]   [erg/cm2]   [erg/cm2]
15- 25  1.796e-08   1.815e-09
25- 50  3.455e-08   1.116e-08
50-150  7.578e-08   3.101e-08
15-150  1.283e-07   3.693e-08
Double BB
Spectral model: bbodyrad<1> + bbodyrad<2>
------------------------------------------------------------
Parameters  : value         Lower 90%    Upper 90%
kT1 [keV]   : 5.16166        (-1.59646      2.25333)
R1^2/D10^2  : 4.42801        (-3.248      11.4848)
kT2 [keV]   : 24.0140        (-3.62184      5.9589)
R2^2/D10^2  : 3.80111E-02    (-0.0206423   0.0295636)
------------------------------------------------------------
#Fit statistic : Chi-Squared =          55.61 using 59 PHA bins.
# Reduced chi-squared =          1.011 for     55 degrees of freedom
# Null hypothesis probability =   4.514913e-01

Energy  Fluence     90% Error
[keV]   [erg/cm2]   [erg/cm2]
15- 25  1.610e-08   7.029e-09
25- 50  3.022e-08   8.195e-09
50-150  9.321e-08   2.521e-08
15-150  1.395e-07   2.821e-08
Pre-slew spectrum (Pre-slew PHA with pre-slew DRM)
Power-law model
Spectral model in power-law:
------------------------------------------------------------
Parameters  : value       lower 90%   higher 90%
Photon index: 1.67176     ( -0.120246   0.122322 )
Norm@50keV  : 5.62057E-03    ( -0.000396291   0.00039264 )
------------------------------------------------------------
#Fit statistic : Chi-Squared =          30.46 using 59 PHA bins.
# Reduced chi-squared =         0.5344 for     57 degrees of freedom
# Null hypothesis probability =   9.984831e-01

Photon flux (15-150 keV)    in 7.02 sec: 0.739262 ( -0.0486816  0.0487563 ) ph/cm2/s
Energy fluence (15-150 keV)             : 3.66197e-07 ( -2.73906e-08  2.76455e-08 ) ergs/cm2
Cutoff power-law model
Spectral model in the cutoff power-law:
------------------------------------------------------------
Parameters  : value       lower 90%   higher 90%
Photon index: 1.52502     ( -0.503809   0.255147 )
Epeak [keV] : 153.960      (   )
Norm@50keV  : 6.71072E-03    (     )
------------------------------------------------------------
#Fit statistic : Chi-Squared =          30.18 using 59 PHA bins.
# Reduced chi-squared =         0.5388 for     56 degrees of freedom
# Null hypothesis probability =   9.981395e-01

Photon flux (15-150 keV)    in 7.02 sec: 0.733548 ( -0.051876  0.051577 ) ph/cm2/s
Energy fluence (15-150 keV)             : 3.61368e-07 ( -3.1755e-08  3.10635e-08 ) ergs/cm2
Band function

Spectral model in the Band function:
------------------------------------------------------------
Parameters  : value       lower 90%   higher 90%
alpha       : -1.32092   ( 1.33217   1.33217 )
beta        : -1.79805    ( 1.79561   0.353678 )
Epeak [keV] : 80.3995      ( -84.425 -84.425 )
Norm@50keV   : 8.87087E-03    ( -0.00318259   0 )
------------------------------------------------------------
#Fit statistic : Chi-Squared =          29.94 using 59 PHA bins.
# Reduced chi-squared =         0.5444 for     55 degrees of freedom
# Null hypothesis probability =   9.976678e-01

Photon flux (15-150 keV)    in 7.02 sec:  (    ) ph/cm2/s
Energy fluence (15-150 keV)             : 0 ( 0  0 ) ergs/cm2
S(25-50 keV) vs. S(50-100 keV) plot
S(25-50 keV)  = 9.80e-08
S(50-100 keV) = 1.23e-07
T90 vs. Hardness ratio plot
T90                                   = 5.58400000631809 sec.
Hardness ratio (energy fluence ratio) = 1.2551
Color vs. Color plot
Count Ratio  (25-50 keV) / (15-25 keV) = 1.19274
Count Ratio (50-100 keV) / (15-25 keV) = 0.74028
Mask shadow pattern
IMX = -9.565389256969814E-02, IMY = 2.621486663322457E-01
TIME vs. PHA plot around the trigger time
TIME vs. DetID plot around the trigger time
100 us light curve (15-350 keV)
Spacecraft aspect plot
Bright source in the pre-burst/pre-slew/post-slew images
Pre-burst image of 15-350 keV band
Time interval of the image:
-299.920000 -0.208000

# RAcent  DECcent POSerr Theta    Phi  PeakCts   SNR AngSep     Name
#  [deg]    [deg]    ['] [deg]  [deg]                   [']
299.5966  35.1949    0.6  40.7 -125.5   7.8960  20.9    0.5	Cyg X-1
308.1084  40.9828    1.5  35.1 -136.7   1.8272   7.7    1.8	Cyg X-3
326.1683  38.3036    3.1  39.4 -159.1   0.9156   3.8    1.1	Cyg X-2
 43.1289  60.1889    1.9  35.5  110.5   2.5311   5.9 ------	UNKNOWN
136.8521  59.0478    2.9  44.6   41.8   2.3156   3.9 ------	UNKNOWN
 34.5483  59.0934    2.3  34.7  118.1   1.7640   5.0 ------	UNKNOWN
  1.7046  60.2963    2.8  25.9  146.1   0.8877   4.1 ------	UNKNOWN
338.9740  36.9304    2.5  42.8 -173.8   1.1582   4.6 ------	UNKNOWN
308.0768  37.6362    1.6  38.4 -136.3   2.2318   7.1 ------	UNKNOWN
Pre-slew background subtracted image of 15-350 keV band
Time interval of the image:
-0.208000 6.812000

# RAcent  DECcent POSerr Theta    Phi  PeakCts   SNR AngSep     Name
#  [deg]    [deg]    ['] [deg]  [deg]                   [']
299.5170  35.2155    8.5  40.7 -125.4  -0.0731  -1.4    3.7	Cyg X-1
307.9610  41.0058   71.2  35.1 -136.5   0.0056   0.2    7.5	Cyg X-3
326.0692  38.4450    5.3  39.3 -159.0   0.0752   2.2    8.8	Cyg X-2
158.4267  63.5514    2.0  38.4   27.6   0.2533   5.9 ------	UNKNOWN
291.3007  60.5963    0.4  15.6 -110.0   0.8055  31.9 ------	UNKNOWN
Post-slew image of 15-350 keV band
Time interval of the image:
-299.920000 302.116000

# RAcent  DECcent POSerr Theta    Phi  PeakCts   SNR AngSep     Name
#  [deg]    [deg]    ['] [deg]  [deg]                   [']
299.5956  35.1957    0.5  40.7 -125.5  14.5632  23.7    0.4	Cyg X-1
308.0937  40.9819    1.3  35.1 -136.7   3.4780   8.9    1.9	Cyg X-3
326.2165  38.2946    2.8  39.4 -159.1   1.7665   4.2    2.7	Cyg X-2
 43.2038  60.1886    2.4  35.5  110.4   3.2489   4.7 ------	UNKNOWN
347.7842  36.5721    3.9  44.8  176.5   1.5732   2.9 ------	UNKNOWN
308.0774  37.6437    1.6  38.4 -136.3   3.8598   7.3 ------	UNKNOWN
Plot creation:
Sun May 31 17:53:16 EDT 2015