Special notes of this burst
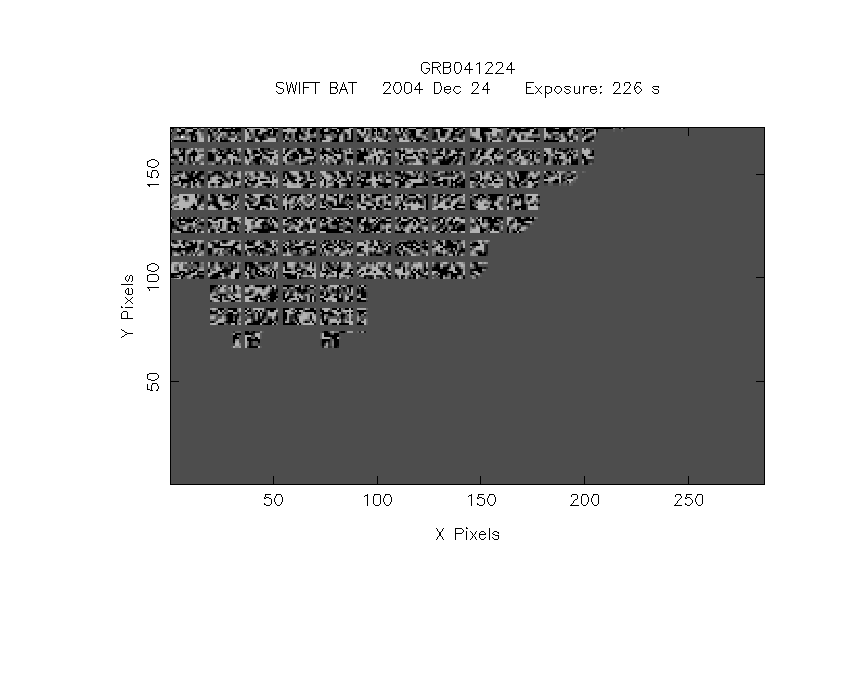
Image
Pre-slew 15.0-350.0 keV image (Event data)
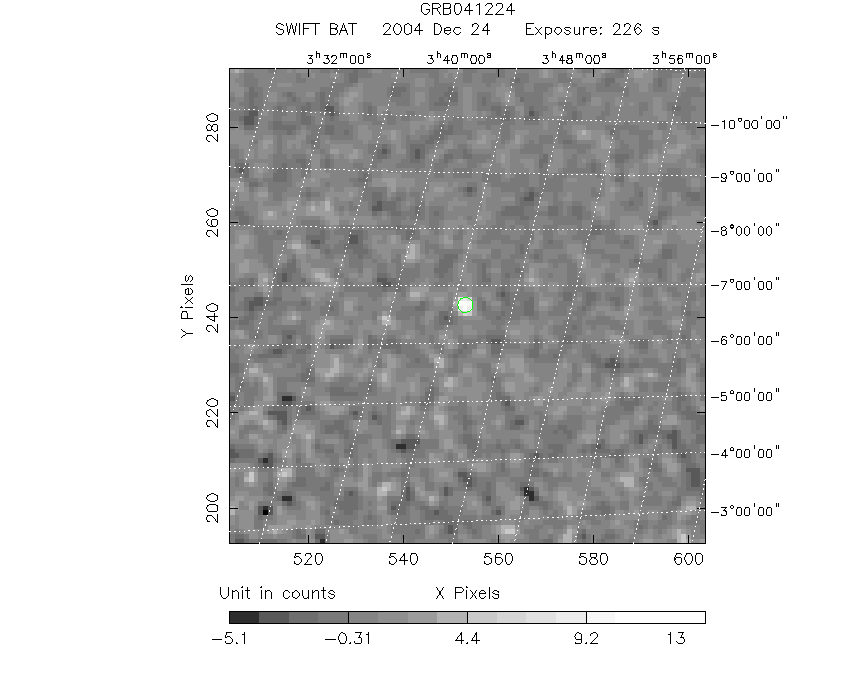
#   RAcent    DECcent   POSerr    Theta     Phi              Peak Cts       SNR   Name
   56.1934    -6.6623   0.0169    40.1667    35.6071        14.1896232     11.419 TRIG_00100703

Foreground time interval of the image:
-110.652  80.622 (delta_t = 191.274 [sec])
 81.976 116.272 (delta_t =  34.296 [sec])
Background time interval of the image:
-119.523 -110.652 (delta_t =   8.871 [sec])
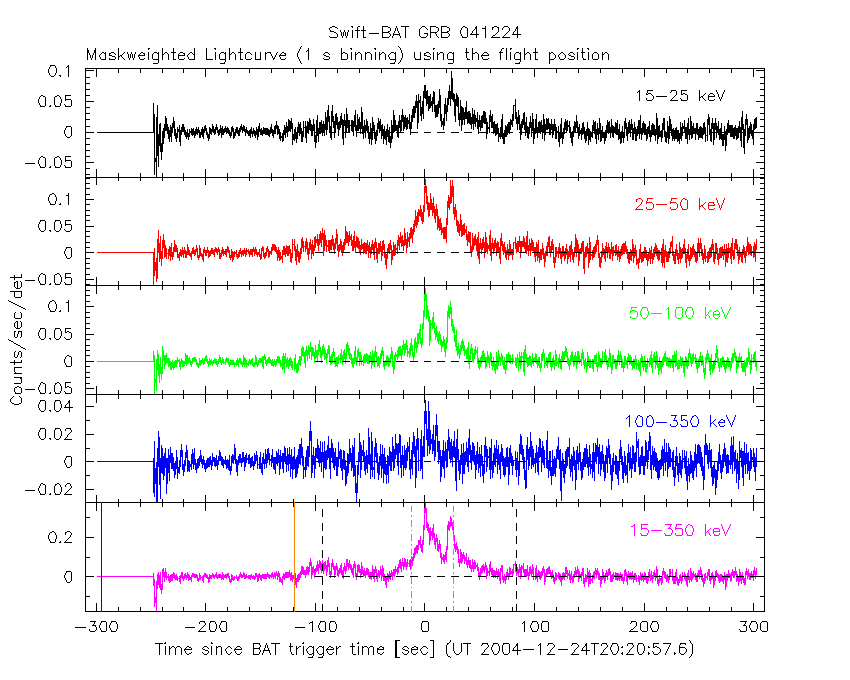
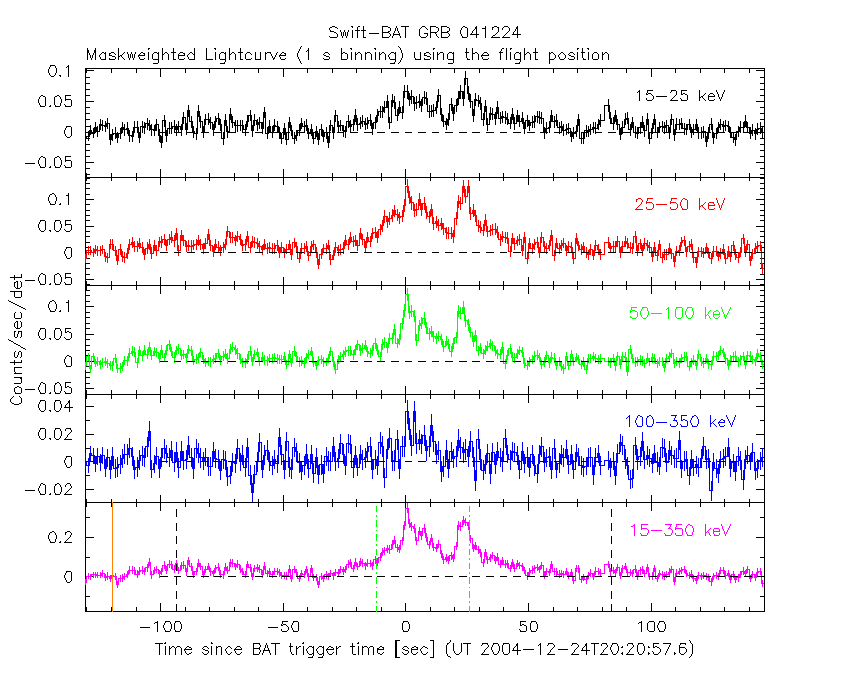
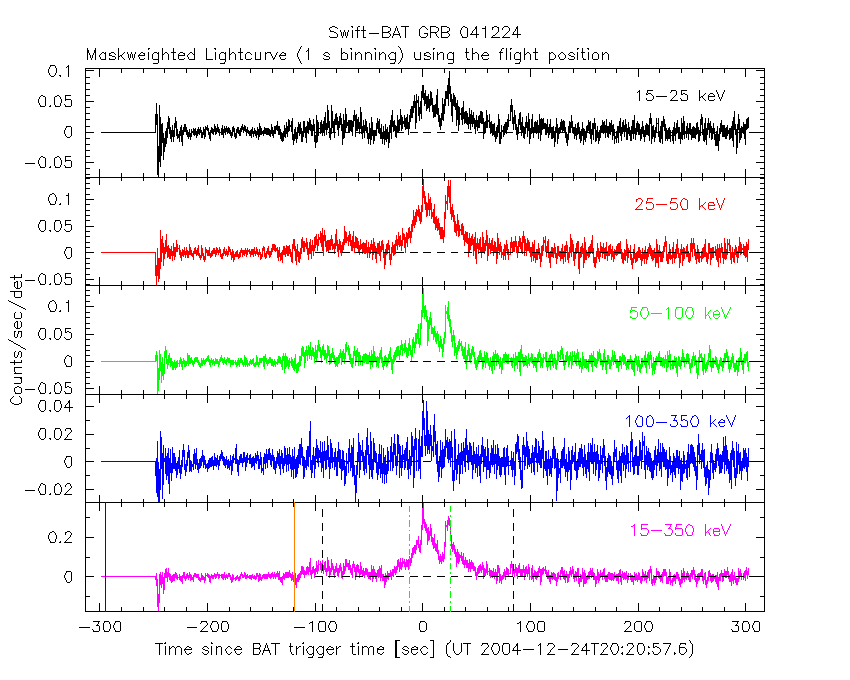
Lightcurves
Notes:
- 1) The mask-weighted light curves are using the flight position.
- 2) Multiple plots of different time binning/intervals are shown to cover all scenarios of short/long GRBs, rate/image triggers, and real/false positives.
- 3) For all the mask-weighted lightcurves, the y-axis units are counts/sec/det where a det is 0.4 x 0.4 = 0.16 sq cm.
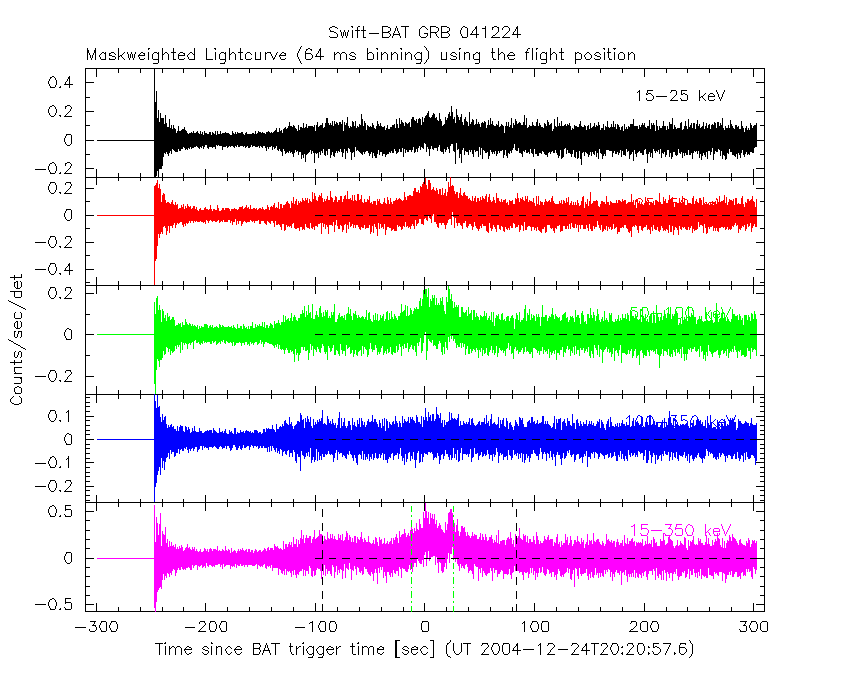
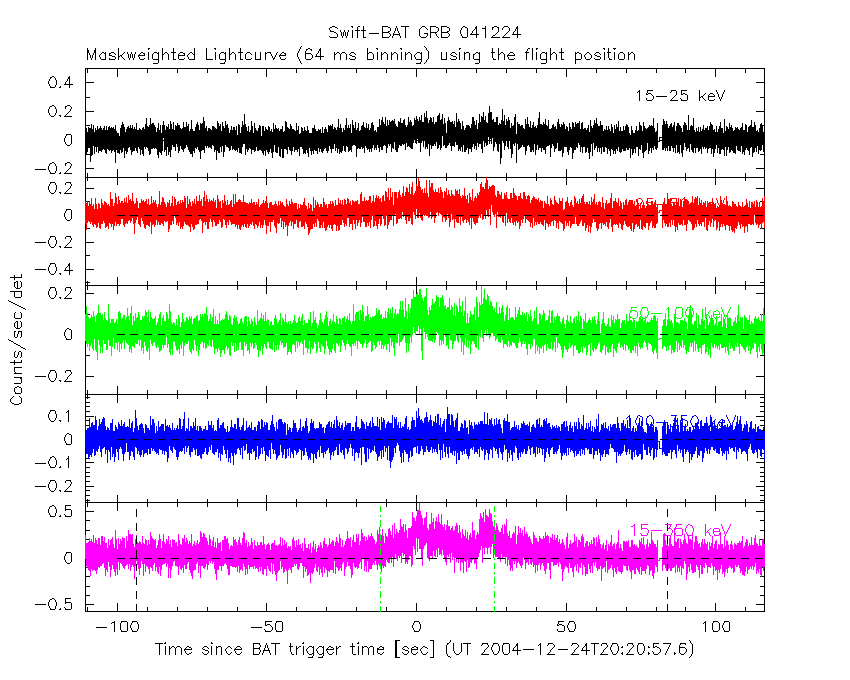
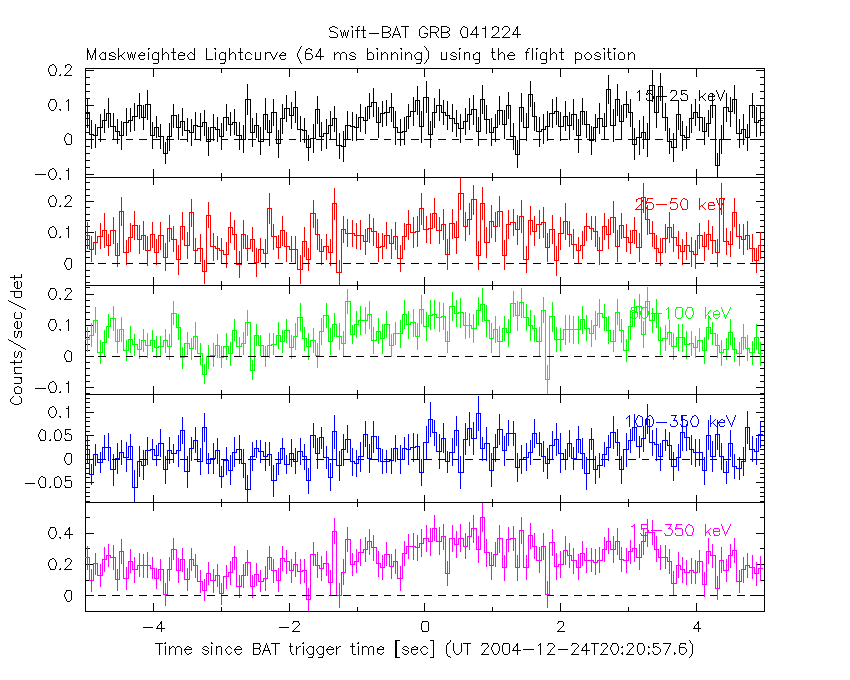
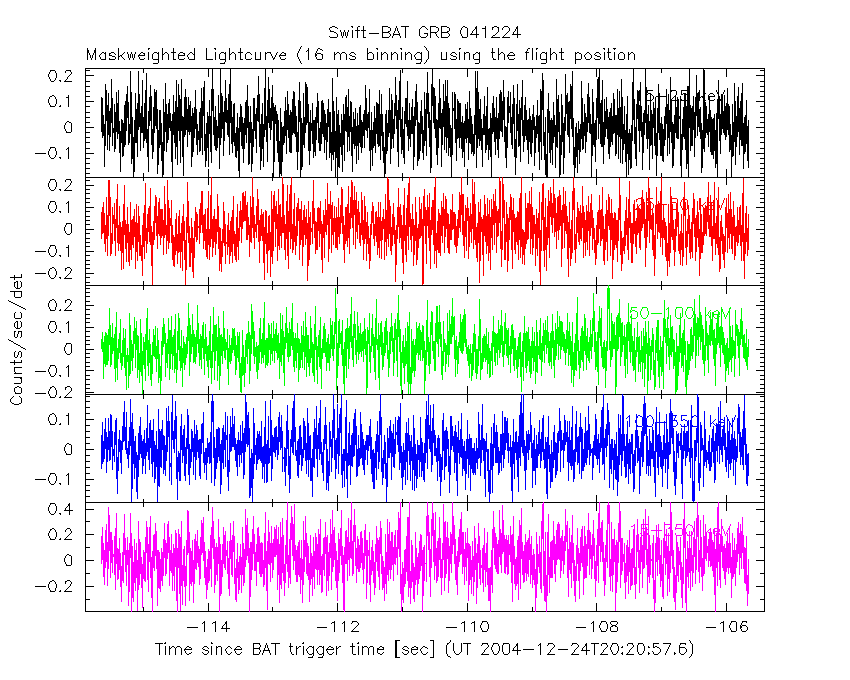
- 4) The verticle lines correspond to following: green dotted lines are T50 interval, black dotted lines are T90 interval, blue solid line(s) is a spacecraft slew start time, and orange solid line(s) is a spacecraft slew end time.
- 5) Time of each bin is in the middle of the bin.
1 s binning
From T0-310 s to T0+310 s
From T100_start - 20 s to T100_end + 30 s
Full time interval
64 ms binning
Full time interval
From T100_start to T100_end
From T0-5 sec to T0+5 sec
16 ms binning
From T100_start-5 s to T100_start+5 s
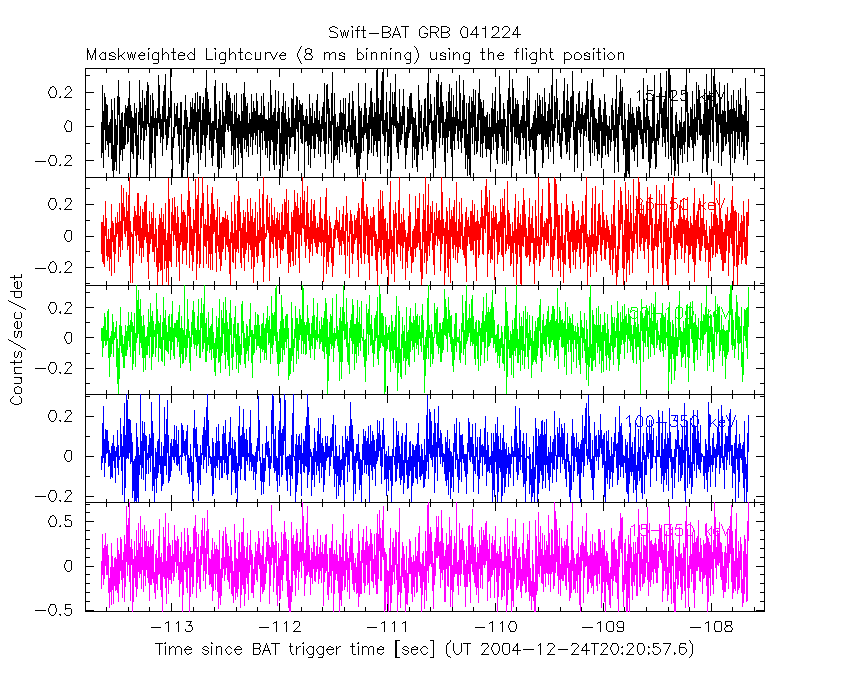
8 ms binning
From T100_start-3 s to T100_start+3 s
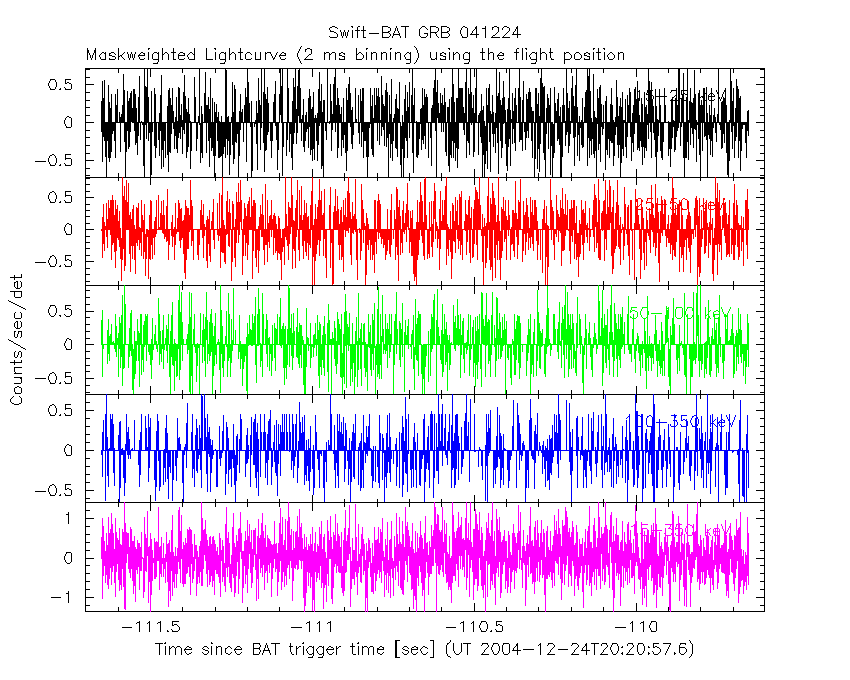
2 ms binning
From T100_start-1 s to T100_start+1 s
SN=5 or 10 sec. binning (whichever binning is satisfied first)
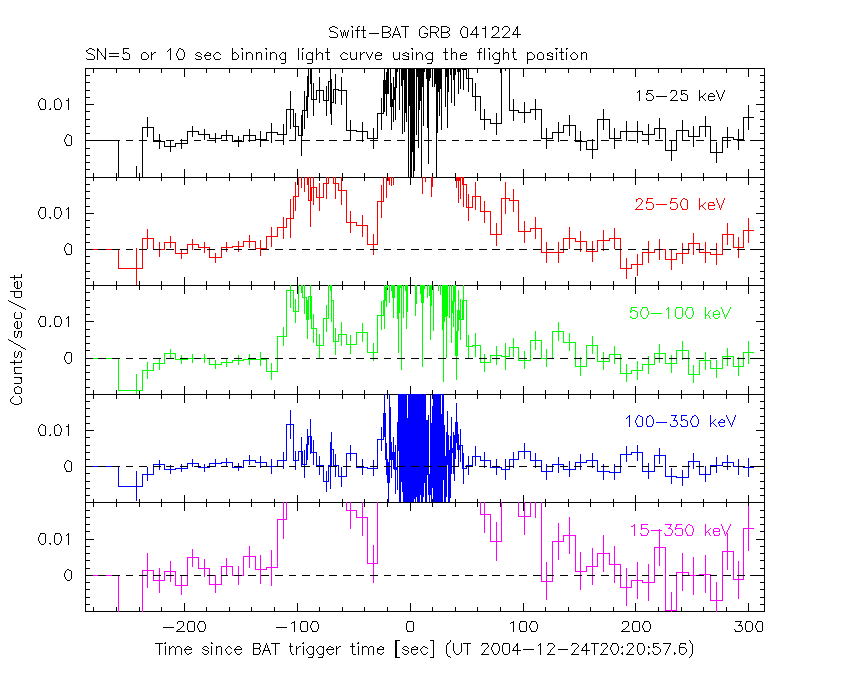
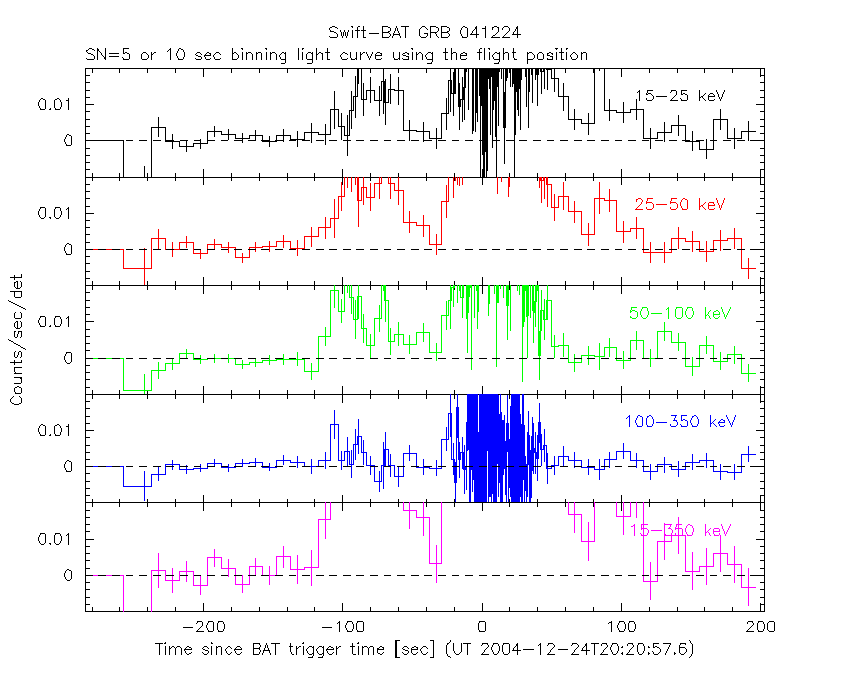
SN=5 or 10 sec. binning (T < 200 sec)
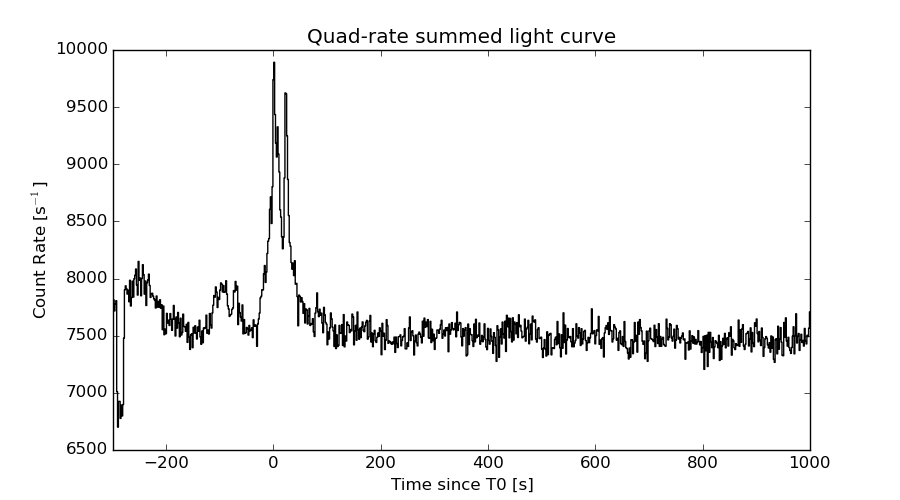
Quad-rate summed light curves (from T0-300s to T0+1000s)
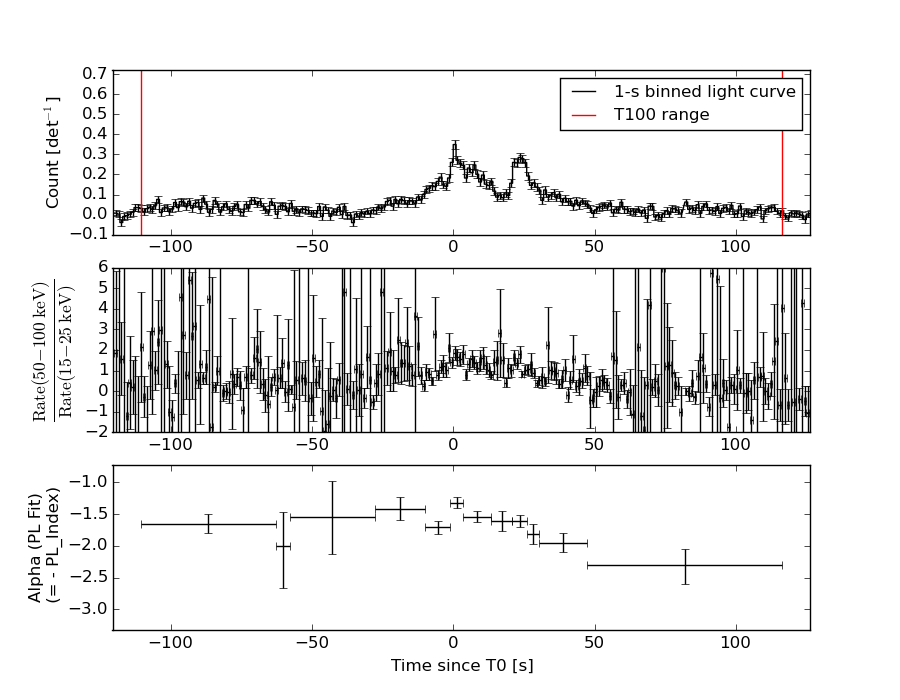
Spectral Evolution
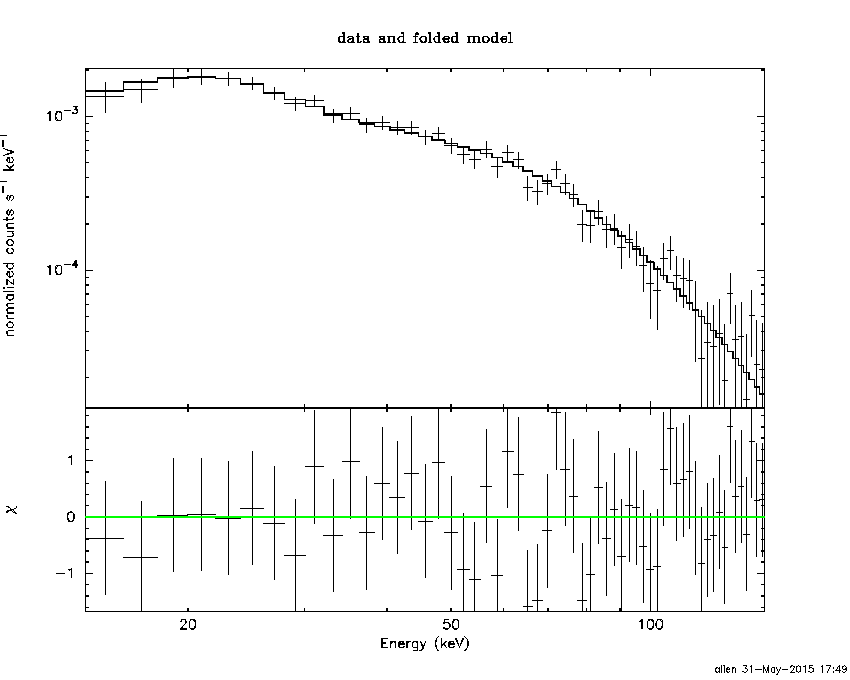
Spectra
Notes:
- 1) The fitting includes the systematic errors.
- 2) When the burst includes telescope slew time periods, the fitting uses an average response file made from multiple 5-s response files through out the slew time plus single time preiod for the non-slew times, and weighted by the total counts in the corresponding time period using addrmf. An average response file is needed becuase a spectral fit using the pre-slew DRM will introduce some errors in both a spectral shape and a normalization if the PHA file contains a lot of the slew/post-slew time interval.
- 3) For fits to more complicated models (e.g. a power-law over a cutoff power-law), the BAT team has decided to require a chi-square improvement of more than 6 for each extra dof.
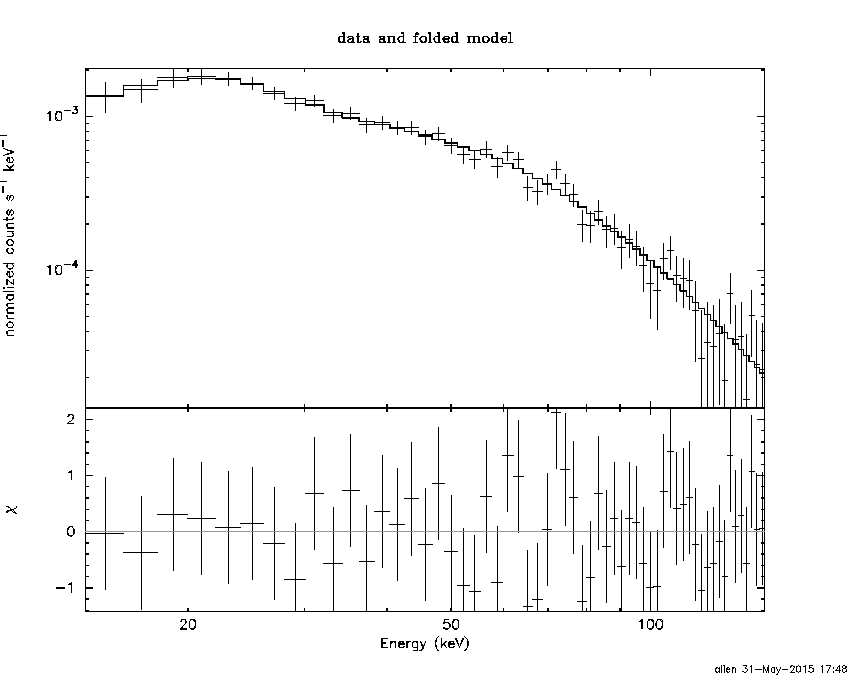
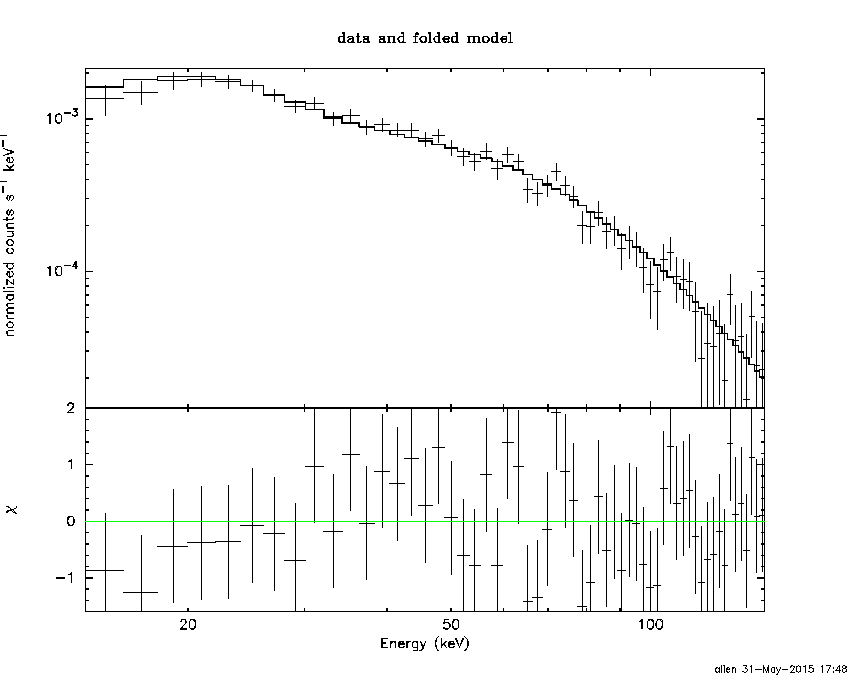
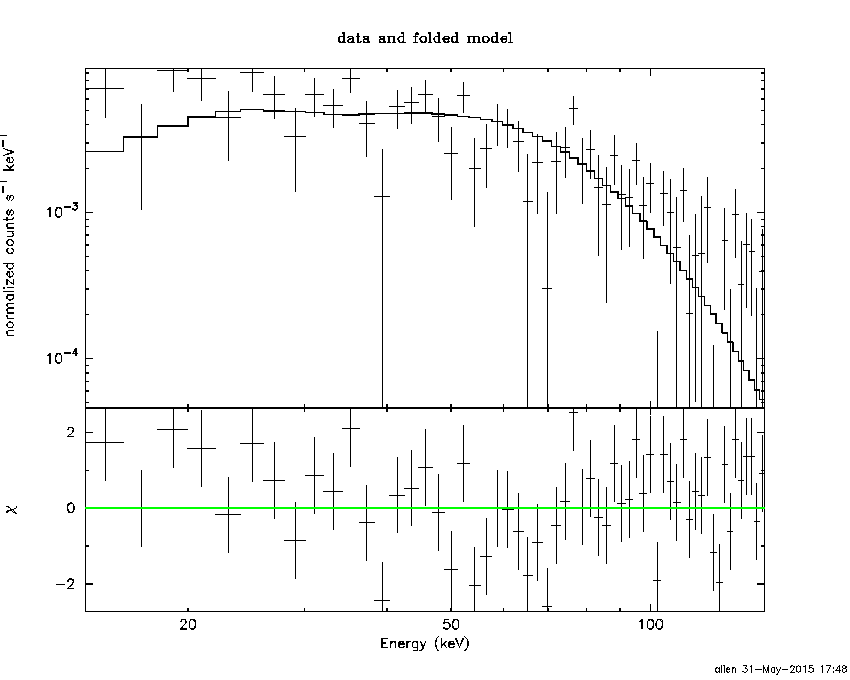
Time averaged spectrum fit using the average DRM
Power-law model

Multiple GTIs in the spectrum
tstart tstop
-110.652000 80.622000
81.976000 116.272000

Spectral model in power-law:
------------------------------------------------------------
Parameters  : value       lower 90%   higher 90%
Photon index: 1.73010     ( -0.0577769   0.0580438 )
Norm@50keV  : 4.31580E-03    ( -0.000143515   0.000143351 )
------------------------------------------------------------
#Fit statistic : Chi-Squared =          62.97 using 59 PHA bins.
# Reduced chi-squared =          1.105 for     57 degrees of freedom
# Null hypothesis probability =   2.733442e-01

Photon flux (15-150 keV)    in 225.6 sec: 0.579348 ( -0.0205704  0.0206258 ) ph/cm2/s
Energy fluence (15-150 keV)             : 8.99519e-06 ( -3.07362e-07  3.07831e-07 ) ergs/cm2
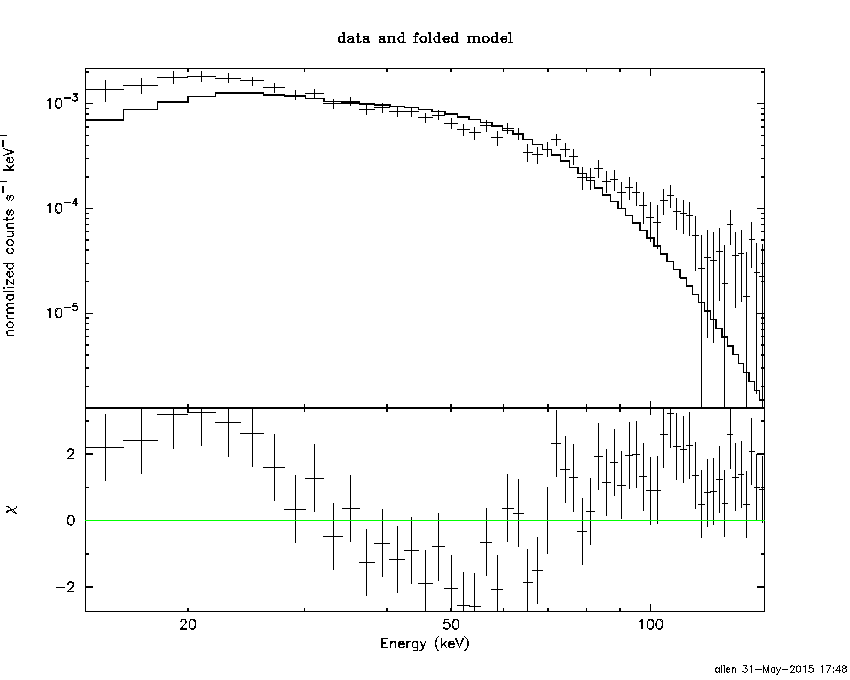
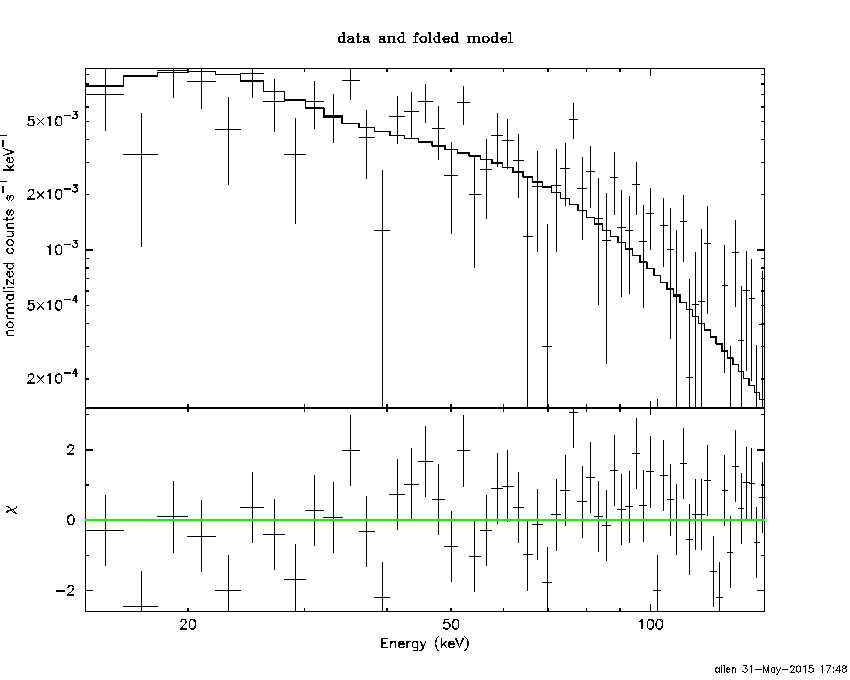
Cutoff power-law model

Multiple GTIs in the spectrum
tstart tstop
-110.652000 80.622000
81.976000 116.272000
Spectral model in the cutoff power-law:
------------------------------------------------------------
Parameters  : value       lower 90%   higher 90%
Photon index: 0.977793     ( -0.281084   0.264232 )
Epeak [keV] : 68.8656      ( -6.89312 11.5944 )
Norm@50keV  : 1.01352E-02    ( -0.00257379   0.00372493 )
------------------------------------------------------------
#Fit statistic : Chi-Squared =          36.77 using 59 PHA bins.
# Reduced chi-squared =         0.6567 for     56 degrees of freedom
# Null hypothesis probability =   9.780264e-01

Photon flux (15-150 keV)    in 225.6 sec: 0.553036 ( -0.022156  0.022237 ) ph/cm2/s
Energy fluence (15-150 keV)             : 8.5534e-06 ( -3.43792e-07  3.43634e-07 ) ergs/cm2
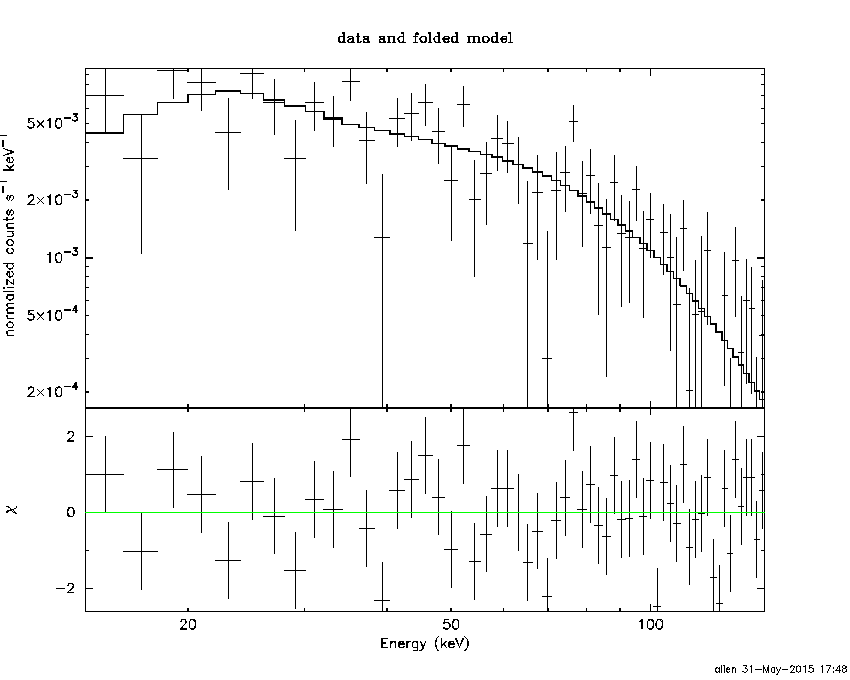
Band function
Multiple GTIs in the spectrum
tstart tstop
-110.652000 80.622000
81.976000 116.272000

Spectral model in the Band function:
------------------------------------------------------------
Parameters  : value       lower 90%   higher 90%
alpha       : -0.616902   ( -0.500667   1.00127 )
beta        : -2.15296    ( 2.15134   0.220373 )
Epeak [keV] : 56.6649      ( -13.9841 16.4016 )
Norm@50keV   : 1.65465E-02    ( -0.00796994   0.0558529 )
------------------------------------------------------------
#Fit statistic : Chi-Squared =          34.32 using 59 PHA bins.
# Reduced chi-squared =         0.6239 for     55 degrees of freedom
# Null hypothesis probability =   9.870460e-01

Photon flux (15-150 keV)    in 225.6 sec:  (    ) ph/cm2/s
Energy fluence (15-150 keV)             : 8.57952e-06 ( -8.57794e-06  -3.36979e-07 ) ergs/cm2
Single BB
Spectral model blackbody:
------------------------------------------------------------
Parameters  : value    Lower 90%  Upper 90%
kT [keV]    : 13.9311  (  )
R^2/D10^2   : 8.06975E-02  (   )
(R is the radius in km and D10 is the distance to the source in units of 10 kpc)
------------------------------------------------------------
#Fit statistic : Chi-Squared =         171.78 using 59 PHA bins.
# Reduced chi-squared =         3.0136 for     57 degrees of freedom
# Null hypothesis probability =   1.941280e-13

Energy  Fluence     90% Error
[keV]   [erg/cm2]   [erg/cm2]
15- 25  7.467e-07   4.568e-08
25- 50  2.763e-06   1.128e-07
50-150  3.523e-06   2.290e-07
15-150  7.033e-06   2.662e-07
Thermal bremsstrahlung (OTTB)
Spectral model: thermal bremsstrahlung
------------------------------------------------------------
Parameters  : value         Lower 90%    Upper 90%
kT [keV]    : 129.696       (-18.2368      18.603)
Norm        : 2.40707       (-0.101558     0.127128)
------------------------------------------------------------
#Fit statistic : Chi-Squared =          40.44 using 59 PHA bins.
# Reduced chi-squared =         0.7094 for     57 degrees of freedom
# Null hypothesis probability =   9.525028e-01

Energy  Fluence     90% Error
[keV]   [erg/cm2]   [erg/cm2]
15- 25  1.409e-06   9.103e-08
25- 50  2.554e-06   1.331e-07
50-150  4.730e-06   1.118e-06
15-150  8.694e-06   1.190e-06
Double BB
Spectral model: bbodyrad<1> + bbodyrad<2>
------------------------------------------------------------
Parameters  : value         Lower 90%    Upper 90%
kT1 [keV]   : 7.92903        (-1.09528      1.125)
R1^2/D10^2  : 0.398903        (-0.128003      0.2323)
kT2 [keV]   : 23.9829        (-3.30654      5.2025)
R2^2/D10^2  : 7.54115E-03    (-0.00409326   0.00656928)
------------------------------------------------------------
#Fit statistic : Chi-Squared =          39.86 using 59 PHA bins.
# Reduced chi-squared =         0.7247 for     55 degrees of freedom
# Null hypothesis probability =   9.379220e-01

Energy  Fluence     90% Error
[keV]   [erg/cm2]   [erg/cm2]
15- 25  1.190e-06   1.251e-07
25- 50  2.716e-06   2.256e-07
50-150  4.579e-06   8.246e-07
15-150  8.484e-06   1.085e-06
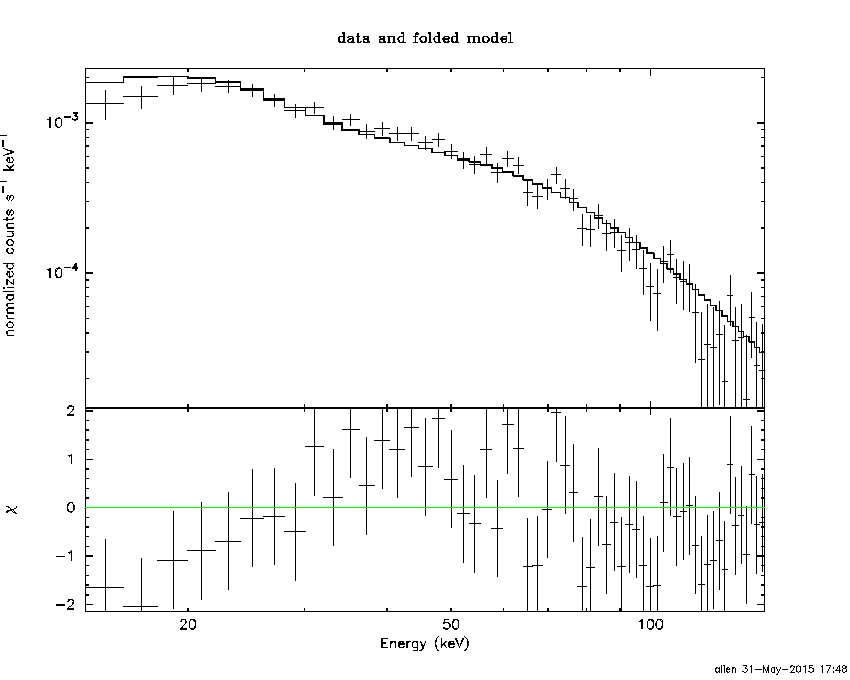
Peak spectrum fit
Power-law model
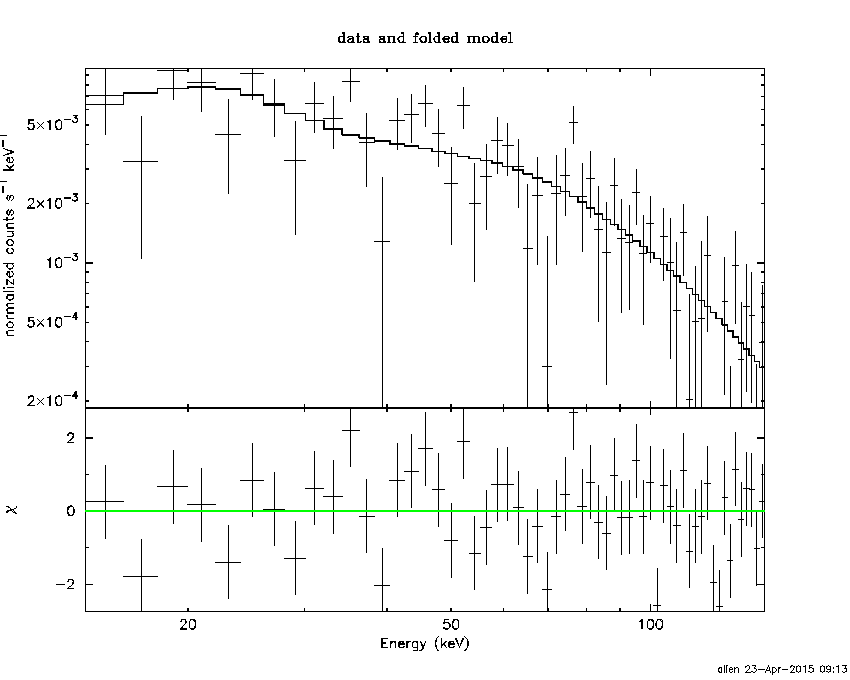
Time interval is from   -0.060 sec. to    0.940 sec.

Spectral model in power-law:
------------------------------------------------------------
Parameters  : value       lower 90%   higher 90%
Photon index: 1.25991     ( -0.15849   0.157358 )
Norm@50keV  : 2.47986E-02    ( -0.0024352   0.002435 )
------------------------------------------------------------
#Fit statistic : Chi-Squared =          74.40 using 59 PHA bins.
# Reduced chi-squared =          1.305 for     57 degrees of freedom
# Null hypothesis probability =   6.067524e-02

Photon flux (15-150 keV)    in 1 sec: 2.93778 ( -0.299857  0.300394 ) ph/cm2/s
Energy fluence (15-150 keV)             : 2.47542e-07 ( -2.60772e-08  2.61492e-08 ) ergs/cm2
Cutoff power-law model

Time interval is from   -0.060 sec. to    0.940 sec.
Spectral model in the cutoff power-law:
------------------------------------------------------------
Parameters  : value       lower 90%   higher 90%
Photon index: 0.698351     ( -0.725181   0.613336 )
Epeak [keV] : 129.138      ( -44.4477 -129.138 )
Norm@50keV  : 4.53865E-02    ( -0.0213979   0.0504944 )
------------------------------------------------------------
#Fit statistic : Chi-Squared =          72.08 using 59 PHA bins.
# Reduced chi-squared =          1.287 for     56 degrees of freedom
# Null hypothesis probability =   7.271384e-02

Photon flux (15-150 keV)    in 1 sec: 2.89669 ( -0.30388  0.30414 ) ph/cm2/s
Energy fluence (15-150 keV)             : 2.43879e-07 ( -2.7057e-08  2.6896e-08 ) ergs/cm2
Band function
Time interval is from   -0.060 sec. to    0.940 sec.

Spectral model in the Band function:
------------------------------------------------------------
Parameters  : value       lower 90%   higher 90%
alpha       : -0.719789   ( -0.292279   0.493967 )
beta        : -9.37108    ( 9.37165   19.3717 )
Epeak [keV] : 132.168      ( -34.0767 256.088 )
Norm@50keV   : 4.43389E-02    ( -0.0138926   0.0149596 )
------------------------------------------------------------
#Fit statistic : Chi-Squared =          72.08 using 59 PHA bins.
# Reduced chi-squared =          1.311 for     55 degrees of freedom
# Null hypothesis probability =   6.088887e-02

Photon flux (15-150 keV)    in 1 sec:  (    ) ph/cm2/s
Energy fluence (15-150 keV)             : 0 ( 0  0 ) ergs/cm2
Single BB
Spectral model blackbody:
------------------------------------------------------------
Parameters  : value    Lower 90%  Upper 90%
kT [keV]    : 18.8133  (-2.19757  2.53815)
R^2/D10^2   : 0.169579  (-0.0591629   0.0883242)
(R is the radius in km and D10 is the distance to the source in units of 10 kpc)
------------------------------------------------------------
#Fit statistic : Chi-Squared =          89.33 using 59 PHA bins.
# Reduced chi-squared =          1.567 for     57 degrees of freedom
# Null hypothesis probability =   3.997706e-03

Energy  Fluence     90% Error
[keV]   [erg/cm2]   [erg/cm2]
15- 25  1.184e-08   2.373e-09
25- 50  5.655e-08   8.745e-09
50-150  1.468e-07   2.645e-08
15-150  2.152e-07   2.820e-08
Thermal bremsstrahlung (OTTB)
Spectral model: thermal bremsstrahlung
------------------------------------------------------------
Parameters  : value         Lower 90%    Upper 90%
kT [keV]    : 200.000       (      )
Norm        : 12.3105       (-1.22742     1.22732)
------------------------------------------------------------
#Fit statistic : Chi-Squared =          82.82 using 59 PHA bins.
# Reduced chi-squared =          1.453 for     57 degrees of freedom
# Null hypothesis probability =   1.436028e-02

Energy  Fluence     90% Error
[keV]   [erg/cm2]   [erg/cm2]
15- 25  3.065e-08   6.370e-09
25- 50  5.896e-08   1.542e-08
50-150  1.293e-07   6.682e-08
15-150  2.189e-07   1.007e-07
Double BB
Spectral model: bbodyrad<1> + bbodyrad<2>
------------------------------------------------------------
Parameters  : value         Lower 90%    Upper 90%
kT1 [keV]   : 8.70339        (-3.16562      3.91231)
R1^2/D10^2  : 1.19558        (-0.75209      3.73304)
kT2 [keV]   : 30.0488        (-7.57534      27.992)
R2^2/D10^2  : 2.75824E-02    (-0.0242446   0.0364327)
------------------------------------------------------------
#Fit statistic : Chi-Squared =          71.92 using 59 PHA bins.
# Reduced chi-squared =          1.308 for     55 degrees of freedom
# Null hypothesis probability =   6.241165e-02

Energy  Fluence     90% Error
[keV]   [erg/cm2]   [erg/cm2]
15- 25  2.120e-08   1.160e-08
25- 50  5.892e-08   3.084e-08
50-150  1.651e-07   8.936e-08
15-150  2.453e-07   1.120e-07
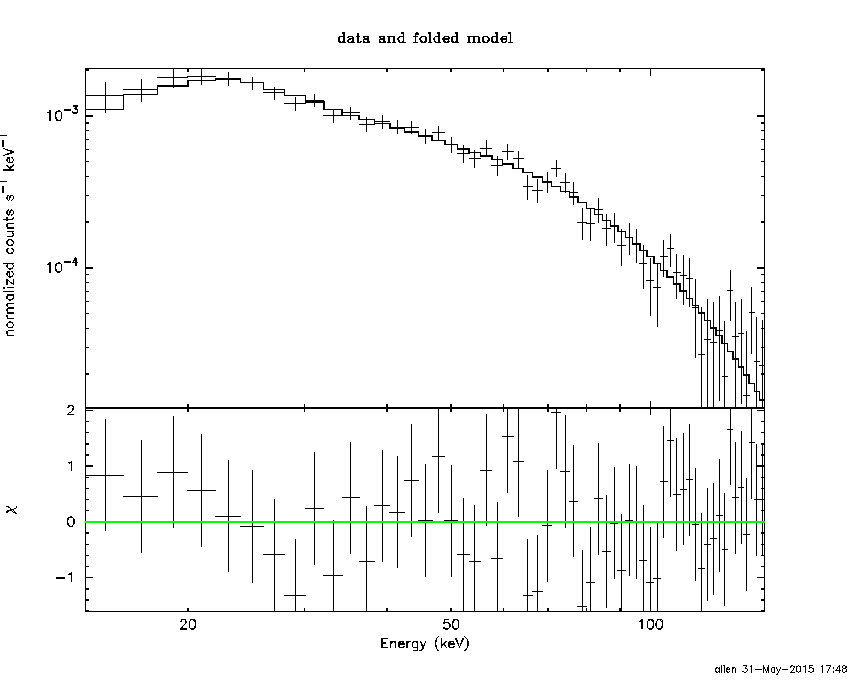
Pre-slew spectrum (Pre-slew PHA with pre-slew DRM)
Power-law model
Spectral model in power-law:
------------------------------------------------------------
Parameters  : value       lower 90%   higher 90%
Photon index: 1.73010     ( -0.0577769   0.0580438 )
Norm@50keV  : 4.31580E-03    ( -0.000143515   0.000143351 )
------------------------------------------------------------
#Fit statistic : Chi-Squared =          62.97 using 59 PHA bins.
# Reduced chi-squared =          1.105 for     57 degrees of freedom
# Null hypothesis probability =   2.733442e-01

Photon flux (15-150 keV)    in 225.6 sec: 0.579348 ( -0.0205704  0.0206258 ) ph/cm2/s
Energy fluence (15-150 keV)             : 8.99519e-06 ( -3.07362e-07  3.07831e-07 ) ergs/cm2
Cutoff power-law model
Spectral model in the cutoff power-law:
------------------------------------------------------------
Parameters  : value       lower 90%   higher 90%
Photon index: 0.977793     ( -0.281084   0.264232 )
Epeak [keV] : 68.8656      ( -6.89312 11.5944 )
Norm@50keV  : 1.01352E-02    ( -0.00257379   0.00372493 )
------------------------------------------------------------
#Fit statistic : Chi-Squared =          36.77 using 59 PHA bins.
# Reduced chi-squared =         0.6567 for     56 degrees of freedom
# Null hypothesis probability =   9.780264e-01

Photon flux (15-150 keV)    in 225.6 sec: 0.553036 ( -0.022156  0.022237 ) ph/cm2/s
Energy fluence (15-150 keV)             : 8.5534e-06 ( -3.43792e-07  3.43634e-07 ) ergs/cm2
Band function

Spectral model in the Band function:
------------------------------------------------------------
Parameters  : value       lower 90%   higher 90%
alpha       : -0.616902   ( -0.500667   1.00127 )
beta        : -2.15296    ( 2.15134   0.220373 )
Epeak [keV] : 56.6649      ( -13.9841 16.4016 )
Norm@50keV   : 1.65465E-02    ( -0.00796994   0.0558529 )
------------------------------------------------------------
#Fit statistic : Chi-Squared =          34.32 using 59 PHA bins.
# Reduced chi-squared =         0.6239 for     55 degrees of freedom
# Null hypothesis probability =   9.870460e-01

Photon flux (15-150 keV)    in 225.6 sec:  (    ) ph/cm2/s
Energy fluence (15-150 keV)             : 8.57952e-06 ( -8.57794e-06  -3.36979e-07 ) ergs/cm2
S(25-50 keV) vs. S(50-100 keV) plot
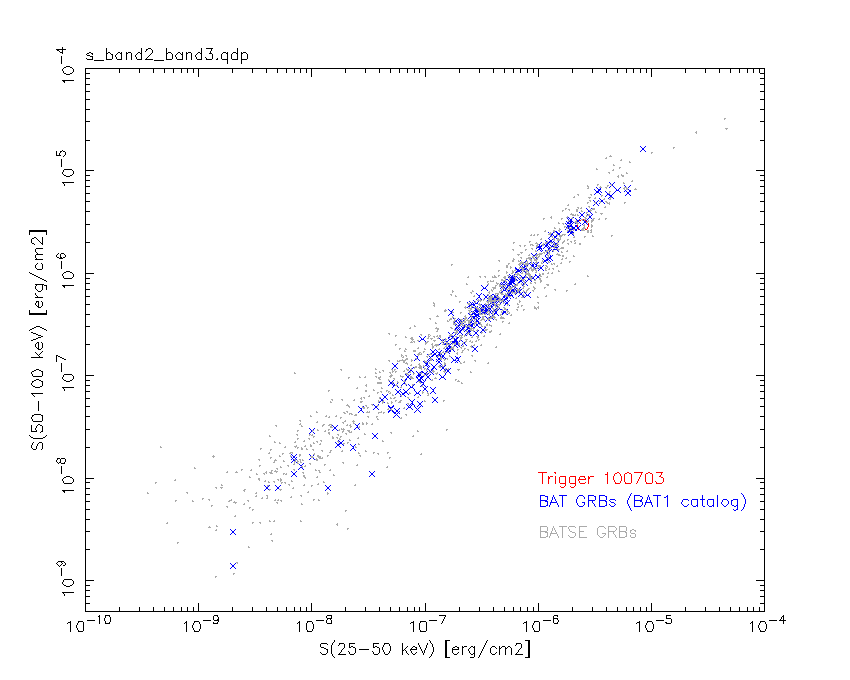
S(25-50 keV)  = 2.47e-06
S(50-100 keV) = 2.97e-06
T90 vs. Hardness ratio plot
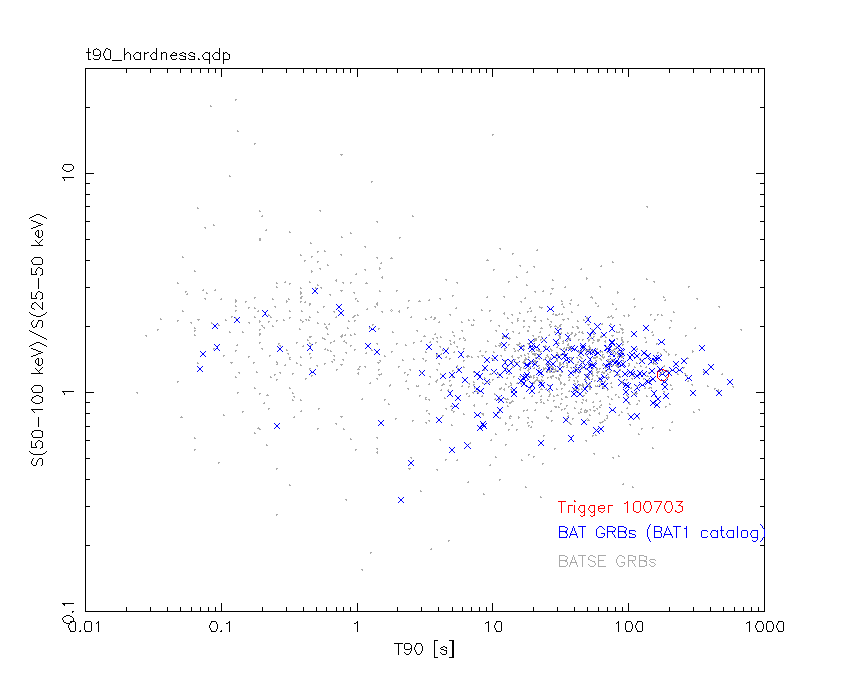
T90                                   = 177.56400001049 sec.
Hardness ratio (energy fluence ratio) = 1.20243
Color vs. Color plot
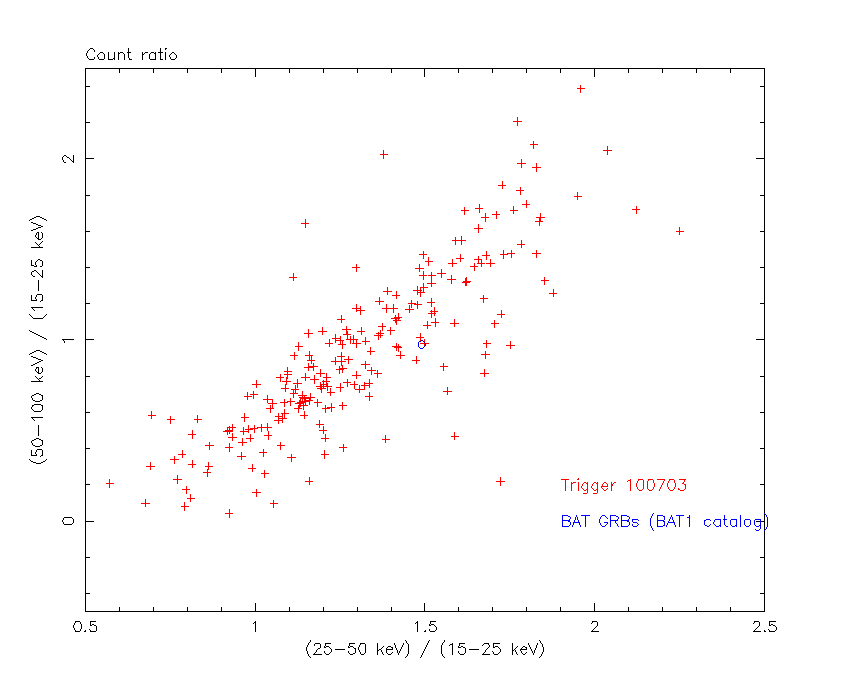
Count Ratio  (25-50 keV) / (15-25 keV) = 1.49064
Count Ratio (50-100 keV) / (15-25 keV) = 0.97452
Mask shadow pattern
IMX = 6.862540828690745E-01, IMY = -4.914374216376731E-01
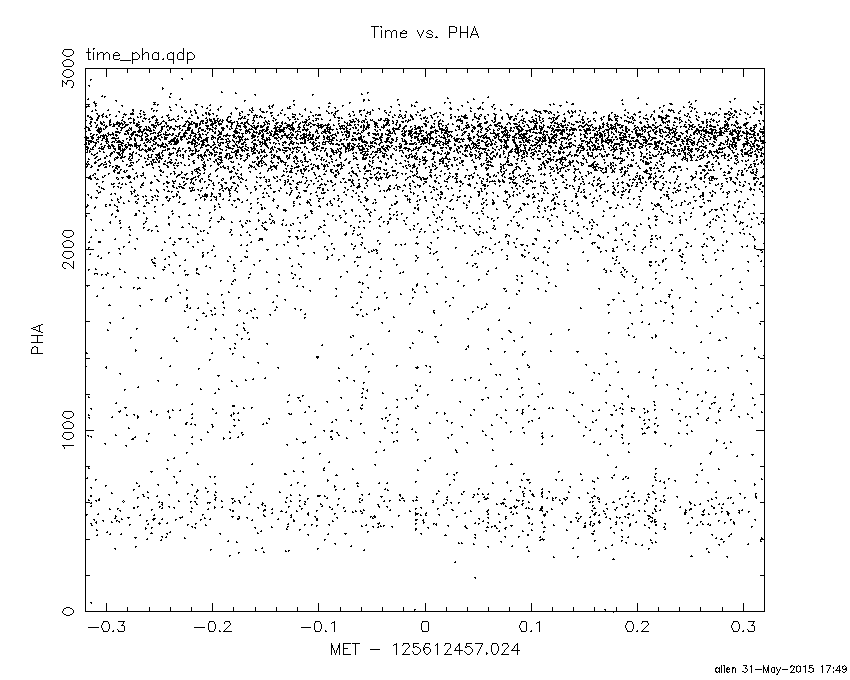
TIME vs. PHA plot around the trigger time
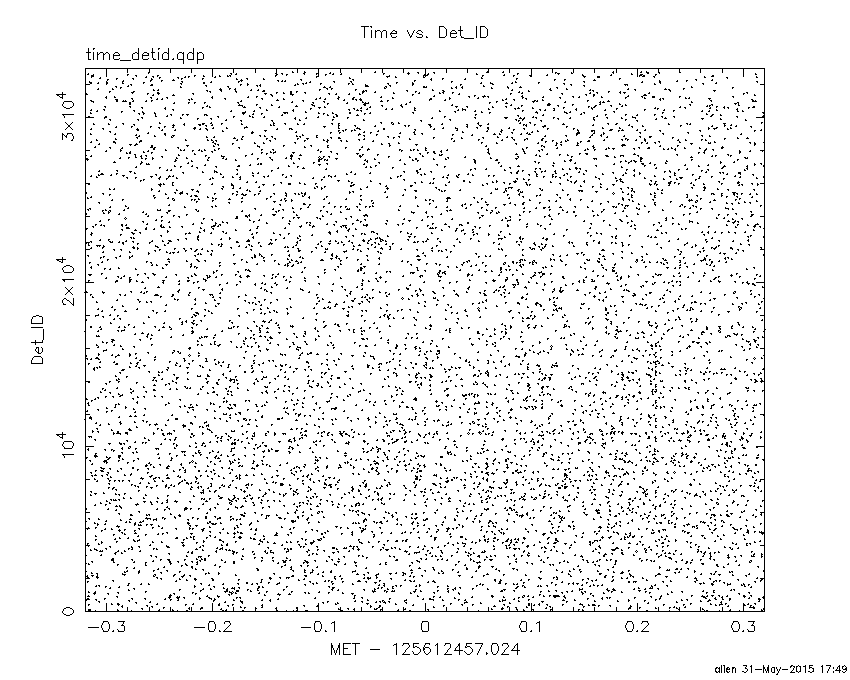
TIME vs. DetID plot around the trigger time
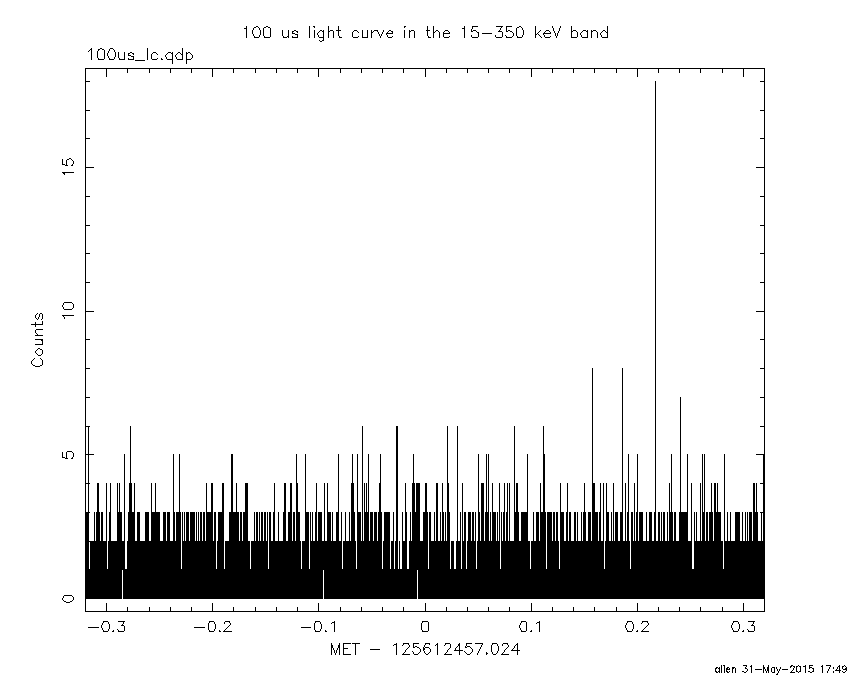
100 us light curve (15-350 keV)
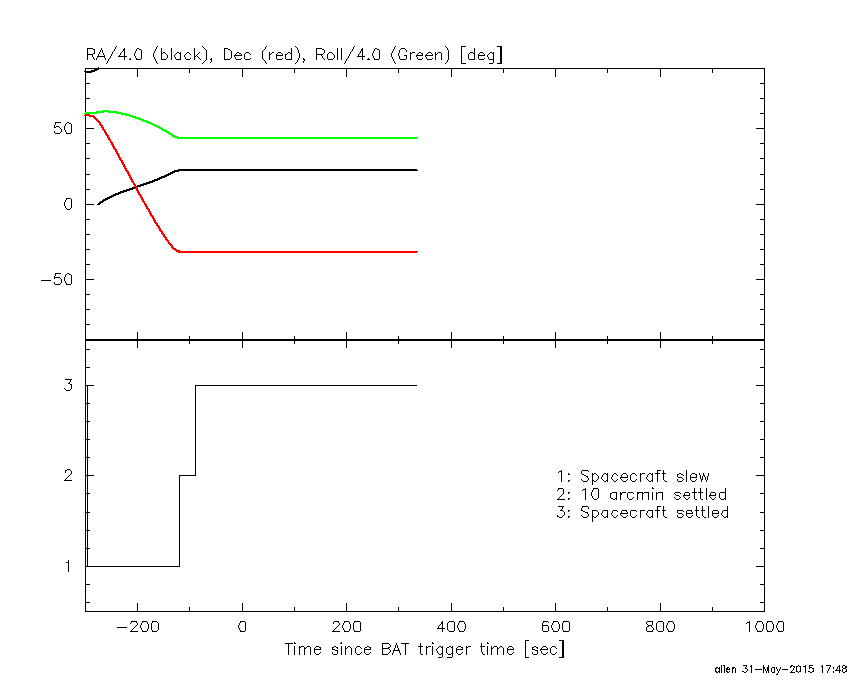
Spacecraft aspect plot
Bright source in the pre-burst/pre-slew/post-slew images
Pre-burst image of 15-350 keV band
Time interval of the image:
-119.523410 -110.652000

# RAcent  DECcent POSerr Theta    Phi  PeakCts   SNR AngSep     Name
#  [deg]    [deg]    ['] [deg]  [deg]                   [']
135.3878 -40.4758    5.6  37.4 -148.8   0.0647   2.1    8.0	Vela X-1
139.4992 -34.6510    2.1  41.2 -157.5   0.1869   5.5 ------	UNKNOWN
138.7935 -41.1302    2.2  39.9 -147.6   0.1798   5.2 ------	UNKNOWN
156.4968 -27.3626    2.1  57.2 -161.4   0.6058   5.4 ------	UNKNOWN
151.1890 -53.4757    2.1  48.3 -129.9   0.5718   5.5 ------	UNKNOWN
Pre-slew background subtracted image of 15-350 keV band
Time interval of the image:
-110.652000 80.622000
81.976000 116.272000

# RAcent  DECcent POSerr Theta    Phi  PeakCts   SNR AngSep     Name
#  [deg]    [deg]    ['] [deg]  [deg]                   [']
135.6790 -40.5656    4.2  37.6 -148.7   2.3091   2.8    6.9	Vela X-1
 56.1934  -6.6624    1.0  40.2   35.6  14.1909  11.4 ------	UNKNOWN
 25.9485 -57.3659    2.2  50.0  -46.3  15.3902   5.3 ------	UNKNOWN
Post-slew image of 15-350 keV band
Time interval of the image:
-299.024000 80.622000
81.976000 302.981200

# RAcent  DECcent POSerr Theta    Phi  PeakCts   SNR AngSep     Name
#  [deg]    [deg]    ['] [deg]  [deg]                   [']
135.5388 -40.5333    1.4  37.5 -148.7   3.3914   8.0    1.4	Vela X-1
 56.1982  -6.6633    0.4  40.2   35.6  15.2135  29.2 ------	UNKNOWN
132.8856 -12.1412    2.7  44.0  168.0   2.1457   4.3 ------	UNKNOWN
 33.7179 -46.0780    3.5  45.1  -31.1   1.6770   3.3 ------	UNKNOWN
151.5337 -53.2144    4.5  48.5 -130.2   3.5988   2.5 ------	UNKNOWN
Plot creation:
Sun May 31 17:49:50 EDT 2015